
Ocean Park Capital Management
2503 Main Street
Santa Monica, CA 90405
Main: 310.392.7300
Daily Performance Line: 310.281.8577
| Dow Jones | 53,185 |
| S&P 500 | 7,686 |
| Nasdaq | 26,370 |
| 2 Yr Treasury | 4.34% |
| 10 Yr Treasury | 4.75% |
| 10 Yr Municipal | 3.38% |
| High Yield | 7.02% |
| Dow Jones | 10.66% |
| S&P 500 | 12.28% |
| Nasdaq | 13.46% |
| MSCI-EAFE | 11.77% |
| MSCI-Europe | 8.87% |
| MSCI-Far East | 18.96% |
| MSCI-Emg Mkt | 22.43% |
| US Agg Bond | -0.31% |
| US Corp Bond | -0.40% |
| US Gov’t Bond | -0.45% |
| Gold | 4,497 |
| Silver | 67.24 |
| Oil (WTI) | 86.25 |
| Dollar / Euro | 1.15 |
| Dollar / Pound | 1.35 |
| Yen / Dollar | 160.09 |
| Canadian /Dollar | 0.71 |
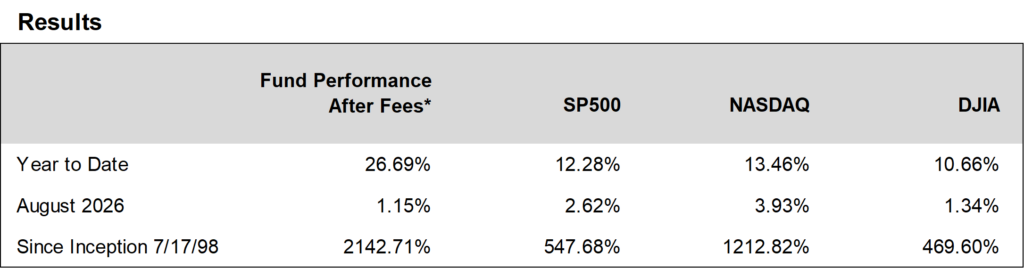
Ocean Park Investors Fund gained 1.15%* in August, while the S&P 500 rose 2.62% and the NASDAQ Composite advanced 3.93%. Year to date, the fund has returned 26.69%*, compared to 12.28% for the S&P 500 and 13.46% for the NASDAQ Composite.
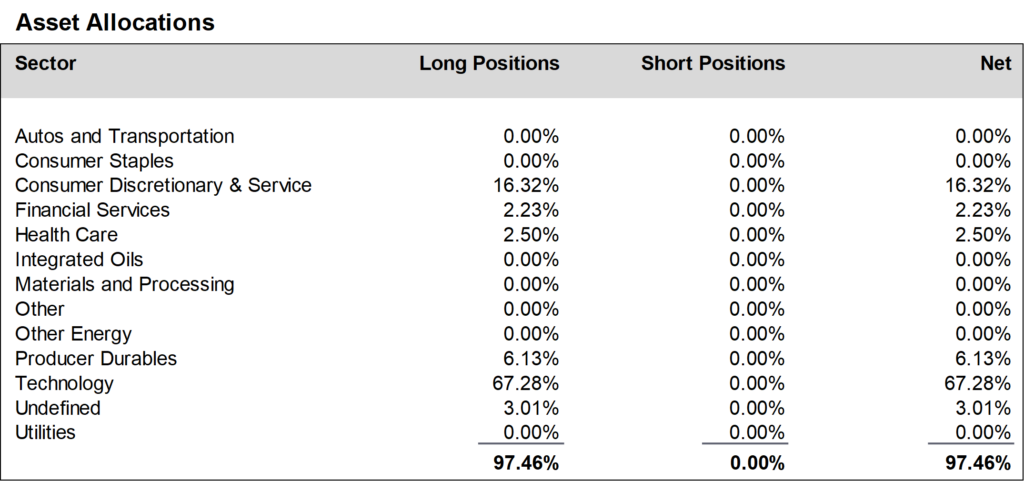
The fund modestly underperformed the broader market in August as core holdings in the memory, optical networking, and AI stocks staged a limited recovery from July’s selloff. Investors regained confidence that AI-related demand remains strong rather than having peaked. Nvidia’s rare long-term revenue projection late in the month reignited enthusiasm across the group, adding nearly $300 billion in market value in a single session and lifting portfolio stocks Micron and Broadcom alongside it.
Daily updates on our activity are available on our Results Line, at 310-281-8577, and on our website at www.oceanparkcapital.com. Enter password opcap.
*These results are pro forma. Actual results for most investors will vary. Additional disclosures on page 4. Past performance does not guarantee future results.

The overall market continued mixed in August. Seven of eleven sectors in the S&P 500 rose, with energy the best sector (again) and utilities the weakest. Reversing from last month, growth stocks outperformed value. Volatility was mild as the S&P 500 moved more than 1% on only 2 of 21 trading days.
Second quarter earnings reported in August reinforced the impressive results in July. Near month’s end, with 99% of S&P 500 companies reporting, 87% beat consensus earnings estimates and 77% beat consensus revenue estimates. The forward price/earnings ratio of the S&P 500 stood at a more reasonable 19.5, below the 5-year average of 19.8.

The dominant macro event of August was Fed Chairman Warsh’s keynote address at the Jackson Hole symposium on August 28. Warsh stated plainly that inflation “is running above our 2% target” and that recent, better-than-expected inflation readings “do not tell me that underlying trends have meaningfully improved,” warning the Fed will “have work to do” if inflation does not move convincingly toward target. While he continued to avoid explicit forward guidance, the speech was read by markets as unexpectedly hawkish and the closest Warsh has come to acknowledging that a rate hike may be needed. As a result, the probability of a rate increase at the September FOMC meeting jumped to roughly 60% from 35% before the speech.
After a lull in direct hostilities, the Iran war flared again late in the month as U.S. forces struck Iranian rocket launchers after detecting preparations to lay mines in the Strait of Hormuz. Iran retaliated with missile strikes on U.S. bases in Jordan and the UAE. Tehran continued to keep the Strait of Hormuz effectively compromised, with crude oil exports through the chokepoint running at a fraction of pre-conflict levels. Oil prices rose more than 2% on the news, with Brent crude back above $90, underscoring how quickly the conflict continues to reassert itself as an inflation risk even after periods of relative calm.

Performance data for OPI reflect the reinvestment of dividends and other earnings on the fund’s assets. Performance data for the major indices reflect only changes in the value of those indices, and would be higher if dividends were included. However, the index data do not reflect fees that would be paid to index fund managers and transaction costs that would be incurred when their component stocks are bought or sold, while OPI’s data do reflect quarterly fees and expenses incurred by the fund. The information provided is believed to be reliable, but its accuracy or completeness is not warranted. This material is not intended as an offer or solicitation for the purchase or sale of any stock, bond, mutual fund, or any other financial instrument. The views and strategies discussed herein may not be appropriate and/or suitable for all investors. This material is meant solely for informational purposes, and is not intended to suffice as any type of accounting, legal, tax, or estate planning advice. Any and all forecasts mentioned are for illustrative purposes only and should not be interpreted as investment recommendations.