Colorado Capital Management is excited to announce that Colleen Harvey, previously serving as the Portfolio Manager, moved into an advisory role as of January. With almost twenty years of experience in the wealth management industry, Colleen has been with CCM since 2014 and has spent the majority of that time directing investment strategy, research, and trading for clients; along with chairing the firm’s Investment Committee. Prior to joining CCM, Colleen worked as a financial advisor at Merrill Lynch in Boulder and spent close to ten years with Fidelity Investments in Boston where she served as a portfolio manager for high net worth clients. Colleen has a bachelor’s degree from the University of Notre Dame, a master’s degree from Tufts University, and holds the Chartered Financial Analyst (CFA) designation.
Colleen’s transition initiated the promotion of Kirsten Roeber, previously Assistant Portfolio Manager, into the Portfolio Manager role, as well as the hiring of Zuzana Birova to fill the Assistant Portfolio Manager position. Zuzana joins CCM with a decade of experience in equity and fixed-income trading, portfolio reconciliation, client reporting and research on traditional asset classes. Originally from Slovakia, where Zuzana received her undergraduate degree in International Business, she went on to pursue her passion in investment management by receiving an MBA at Butler University in Indianapolis. She is currently in the process of acquiring the Chartered Financial Analyst (CFA) designation.
We are excited that our team continues to grow with refined aptitude in new areas, and also champion the advancements that staff have made internally.
Staff ski day at Copper Mountain. Ladies who shred, from left to right: Zuzana Birova, Liz Jacques, Julia Wentworth.
Volatility has existed for years and will continue to exist for years to come
Macro Overview
Volatility was rampant throughout the markets as fear of inflation and rising interest rates pilfered gains that had accumulated from the beginning of the year. Some see a fundamental trend is in place as a normalization of interest rates evolves.
The release of a jobs report in early February was the catalyst for volatility, as the pace of wage growth was greater than expected thus raising the specter of more aggressive Fed tightening to combat inflation. The Federal Reserve communicated that it is on track to raise rates three to four times this year, stating that “substantial underlying economic momentum” exists for further rate increases.
Historically when markets experience a volatility spike as we experienced in February, a strong economy is a buffer against any long-lasting downturns. Regardless of the catalyst, both stocks and bonds tend to regain their footing following such an environment.
The abrupt rise in bond yields over the past month is in anticipation that the Fed will continue to raise short-term rates this year. The 10-year Treasury yield, which is established by the markets, rose to 2.87% in February from 2.46% at the beginning of the year. The higher yield on U.S. debt is starting to attract additional foreign assets relative to lower yields from other developed countries. The increase in rates is beginning to affect consumer loans from homes and autos to credit cards, and quite possibly offsetting the initial benefits of the recently passed tax cuts.
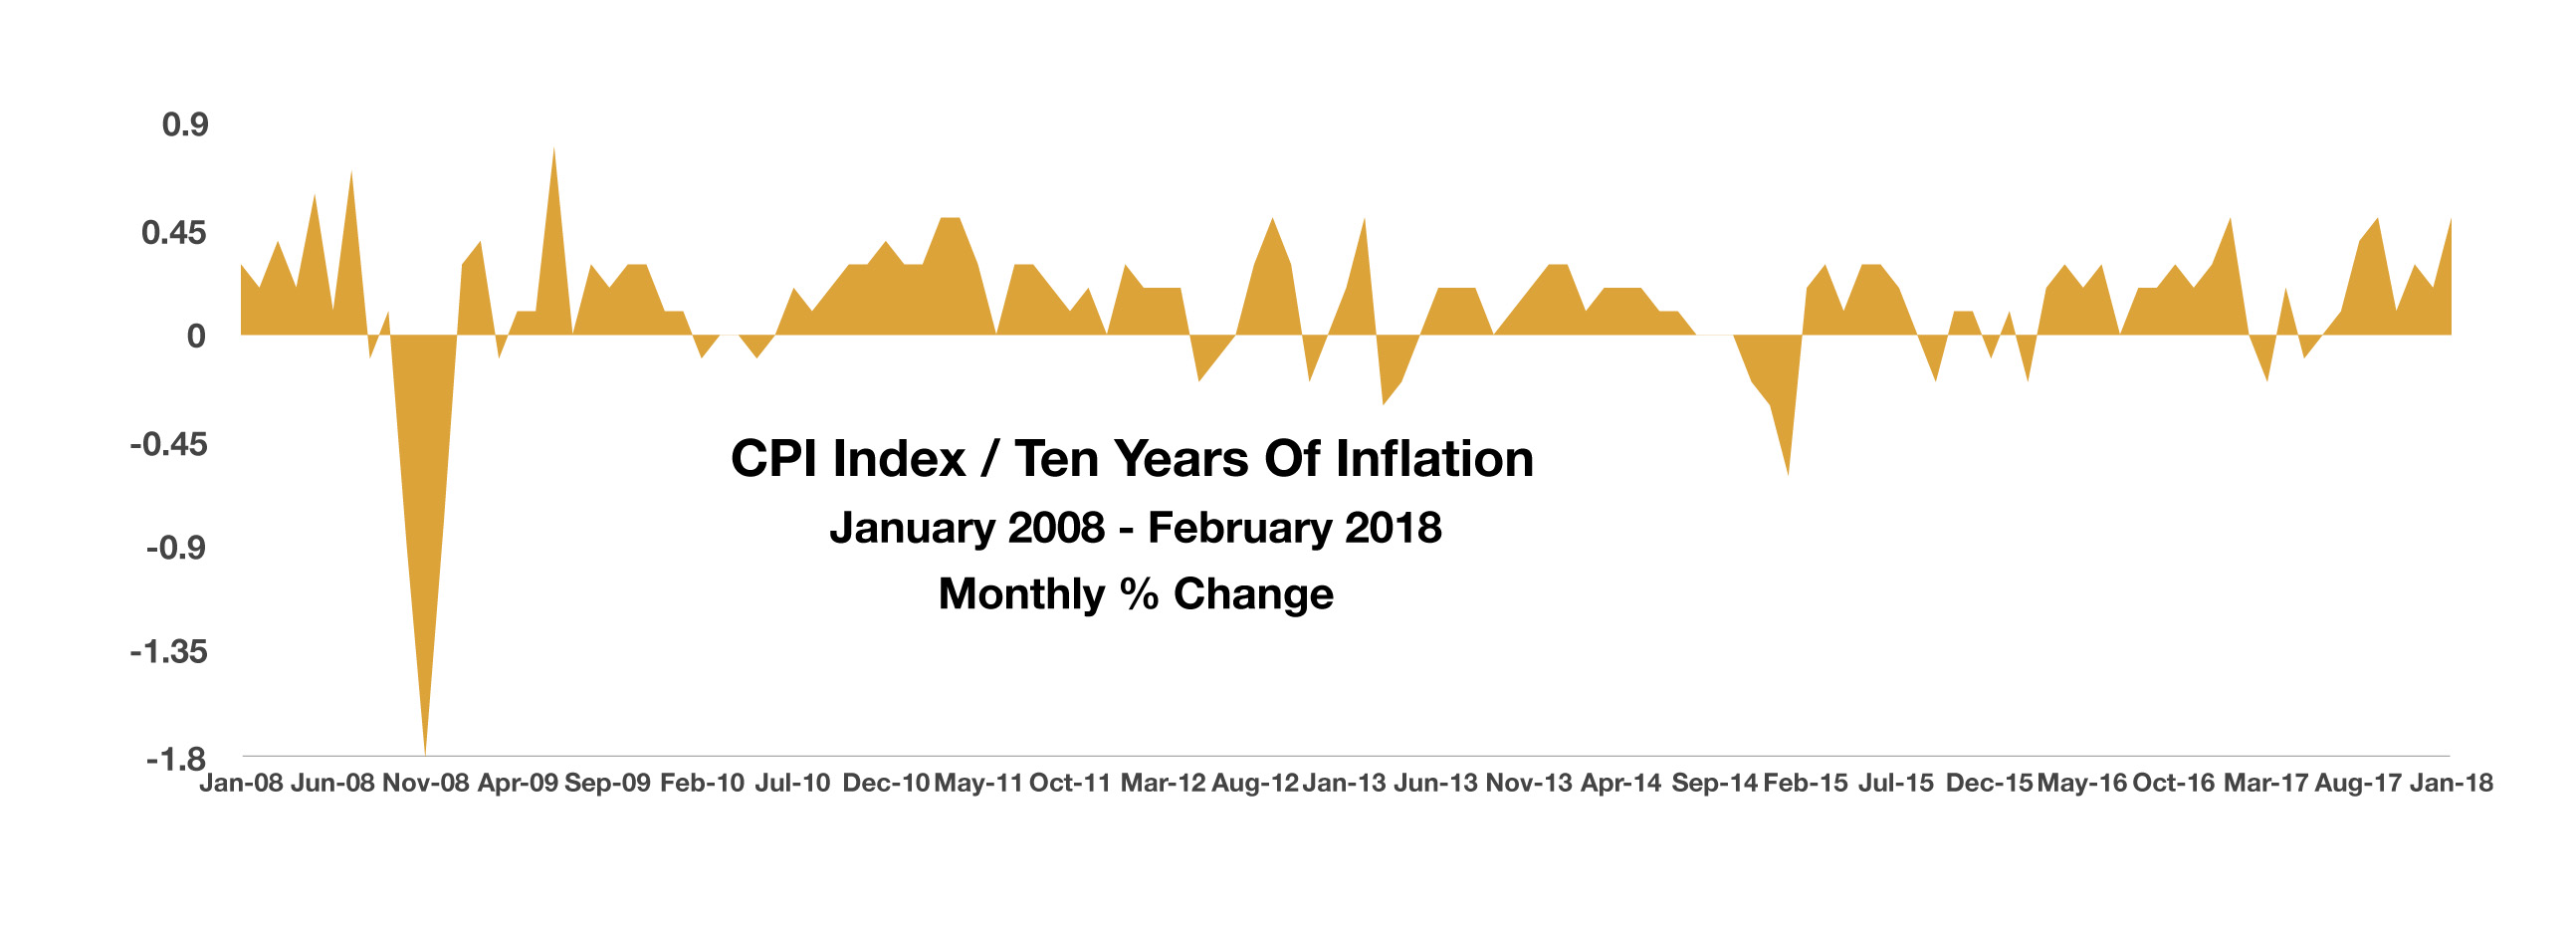
The roughly 50 percent increase in crude oil prices from lows in June 2017 has helped push inflation higher over the past few months of which oil is an integral component. Economists do not consider inflation a threat to economic prosperity as long as it is gradual and controlled, of which inflation is measured by the Consumer Price Index (CPI).
The Labor Department said the cost of employing the average American worker rose 0.5% in the final three months of 2017 and was up 2.6% in the 12 months ending in December. That’s the biggest 12-month gain for the employment cost index in almost three years. There was a 2.9% jump in average hourly earnings over the past year, the highest increase since June 2009. The average work week fell to 34.3 hours from 34.5 hours.
(Sources: Labor Dept., BEA, Federal Reserve, Bloomberg)
The Cost Of Auto Insurance Rose 8.5% In The Past Year
The Return Of Volatility – Equity Overview
Volatility drove all major equity indices lower, prompting a broad increase in trading activity. Regardless of negative news affecting the equity markets, optimism still exists among various analysts and economists.
Some analysts are revising their earnings estimates upward, which means that they believe companies will start to earn more. The benefits of a lower corporate tax rate and the onset of inflation will benefit various companies in different sectors. Inflation will benefit those companies that are capable of raising prices on their services and products, also known as pricing power.
Companies buying their own shares might provide additional fuel for the U.S. stock market following a wave of strong quarterly earnings reports and tax cuts that have left more cash on balance sheets.
Favorable earnings reports lifted equity prices in late February as U.S. companies reported that earnings were improving. According to Thompson Reuters, 77% of companies in the S&P 500 that had reported earnings as of the end of February had exceeded expectations, an optimistic sign.
Many believe that technology has led the market in adjusting much quicker to a changing rate environment, albeit with a higher level of volatility.
Volatility is an inherent part of the market that occurs when the markets undergo the digestion of new data and or occurrence that alters basic fundamentals and expectations of economic growth and company earnings. Volatility has existed for years and will continue to exist for years to come.
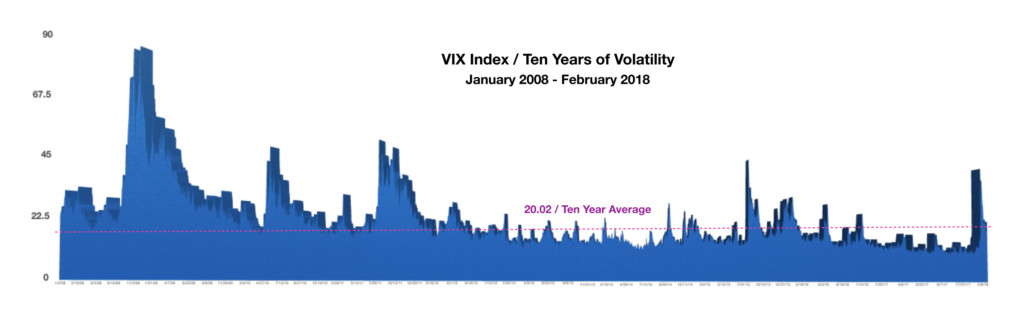
Market volatility is measured by the VIX® Index, which is owned and compiled by the Chicago Board of Exchange (CBOE). The index is calculated by estimating expected volatility for the S&P 500 index.
As of the close of business on February 28, 2018, the VIX Index stood at 19.85, up from 9.77 on January 2, 2018. For the past ten years, the VIX index has averaged a daily closing price of 20.02, almost identical as to where the index closed at the end of February. Different factors bring about volatility, this time it’s primarily the concern surrounding rising rates and inflation. Market volatility is a function of various factors such as a change in fiscal policy, monetary policy, trade policy, geopolitical events, weather, natural disasters, and currencies.
Historically, volatility has always existed and will undoubtedly continue to exist. Investors seeking to shelter their holdings from market volatility take different actions and use various strategies. Volatility is viewed from different perspectives as some see volatility as a hindrance while others view it as an opportunity. Regardless of how it is perceived, being prepared for future volatility is essential in sustaining valuations.(Sources: Bloomberg, Reuters, S&P, CBOE)
Colorado Capital Update
Rates Starting To Normalize – Fixed Income Update
Bond yields rose in February driven by inflation and additional Fed rate hike expectations. Shorter term rates rose in tandem with longer term rates, as a Treasury two-year note auction brought a yield of 2.25%, the highest since 2008. A normalization of rates is simultaneously occurring around the globe. Central banks from various countries are scaling back from stimulus efforts and bond buying activities, leading to rising interest rates. In addition, several countries are selling bonds to raise capital, including the UK, Japan, Germany, and the United States.
The issuance of U.S. debt, by bond sales, is expected to increase throughout 2018 as the Treasury raises additional funds to compensate for the budget deficit and loss of tax revenue due to the recently passed tax legislation. The current status of the economy has led the credit reporting agency Moody’s, to estimate that non investment grade bond defaults will fall to 1.7% by the end of the year, less than half the long-term average of 4.2% going back to 1983.
As rates fell over the past few years, companies are locked in record low interest payments with the average maturity rising from 8.6 years in 2005 to 15.3 years in 2017. Longer term Treasury bonds now have more of a spread with shorter term Treasury notes, whereas investors see such a steepening yield curve as a sign of economic strength, while flat or inverted is seen as a predecessor to poor economic conditions. (Sources: U.S. Treasury, Bloomberg)
Deciding When To Take Social Security – Retirement Planning
Deciding when to take Social Security benefits is one of the most important decisions one will make for retirement. You may either base the decision strictly on monetary benefits, or your decision may be more personal. The important question is when to start taking benefits, and the answer is different for everyone as it depends on various factors such as health, lifestyle, and marital status. The amount of your monthly benefit depends on two variables; when you elect to start receiving it and how much you have earned during your working years. The number of years you’ve contributed to Social Security cannot be changed, yet the option as to when you begin the benefit is up to you. To determine how much you’ve earned the Social Security Administration adds up the income subject to Social Security tax adjusted for inflation during your 35 highest-earning years. It then divides that total by 420, the number of months in 35 years. This figure arrives at your average indexed monthly earnings. The higher this is, the higher your benefits will be. The Social Security Administration designs the benefit formula based on an average, so the same amount of lifetime benefits is calculated irrespective of when you begin receiving payments. The U.S. Government Accountability Office (GAO) explains this in a report on social security retirement saying “the Social Security benefit formula adjusts monthly payments so that someone living to average life expectancy should receive about the same amount of benefits over their lifetime regardless of which age they claim”. When it comes to deciding as to what age to start taking benefit payments, various strategies and philosophies come into play. The calculated benefit amount per the Social Security Administration is known as the “full benefit”, in essence providing 100% of the calculated benefit due. A break-even analysis can be done to determine the optimal age to take benefits, thus calculating how much more in benefits you may get, either by waiting for a higher benefit say age 70, or taking a lower benefit at a younger age such as 62. Essentially, if you decide to wait, then you lose out on payments you could have been receiving since age 62. If you wait, yes the benefit payment will be higher, but you may end up receiving less overall benefit payments if you die sooner than expected. (Sources: Social Security Administration, GAO)