Dow Jones | 42,270 |
S&P 500 | 5,911 |
Nasdaq | 19,113 |
2 Yr Treasury | 3.89% |
10 Yr Treasury | 4.41% |
10 Yr Municipal | 3.31% |
High Yield | 7.26% |
Dow Jones | -0.64% |
S&P 500 | 0.51% |
Nasdaq | -1.02% |
MSCI-EAFE | 17.30% |
MSCI-Europe | 21.20% |
MSCI-Pacific | 10.50% |
MSCI-Emg Mkt | 8.90% |
US Agg Bond | 2.45% |
US Corp Bond | 2.26% |
US Gov’t Bond | 2.44% |
Gold | 3,313 |
Silver | 33.07 |
Oil (WTI) | 60.79 |
Dollar / Euro | 1.13 |
Dollar / Pound | 1.34 |
Yen / Dollar | 144.85 |
Canadian /Dollar | 0.72 |
Macro Overview
The rally in stocks that began following the election in 2016 propelled through 2017 as optimism and expectations that growth oriented policies and tax cuts would materialize. Political turmoil was not a deterrent for the markets, as major U.S. equity indices finished the year at near record levels.
The Tax Cut & Jobs Act was signed into law by the President on December 22nd, setting the stage for new tax codes and rules effective January 1, 2018. Following the passage of the new tax law legislation, small businesses and larger corporations prepare for optimal methods of spending capital and expanding in 2018.
Congress passed a short-term funding plan to avert a government shutdown between December 22nd to January 19th. Since federal funding gaps are common, Congress institutes a continuing resolution or CR to provide interim funds in order to maintain government operations.
Strengthening economic conditions throughout the international markets helped buoy global stocks and mildly boost inflationary pressures, which can be beneficial for certain equities. Economic stimulus efforts by central banks were reigned in during 2017, as developed and emerging market economies exceeded growth expectations.
The Federal Reserve raised rates as expected with the objective of curtailing inflationary pressures. The December rate hike was the third of the year, pushing shorter-term rates higher, which are more sensitive to Fed rate increases. Overall, rates remained fairly stable in 2017, as inflation and economic growth were tepid. The 10-year Treasury yield ended 2017 at 2.40%, down from 2.45% at the beginning of the year.
Commodity prices, including precious metals and energy products, are expected to rise in 2018 as the prospect of inflationary pressures increases. A rise in global oil demand along with curtailment of production pushed prices higher in 2017 to levels not reached in over two years.
Confusion surrounding prepayment of property taxes was a nationwide problem the last week of the year as homeowners rushed to prepay 2018 property tax bills without being certain if a deduction could be taken in 2017. In a statement, the IRS did specify that taxpayers could deduct prepaid 2018 state and local property taxes on 2017 returns only if the taxes were assessed before 2018.
Sources: Congress.gov, Federal Reserve, IRS, U.S. Treasury
Equity Overview – Global Stock Update
Global markets accelerated throughout 2017, marking new highs and sending broader market indices higher. The election prompted rally in domestic stocks continued on in 2017 as optimism and expectations that growth oriented policies and tax cuts would fuel earnings appreciation.
International markets excelled in 2017 as both developing and emerging stocks were boosted by expanding economies throughout Europe and Asia.
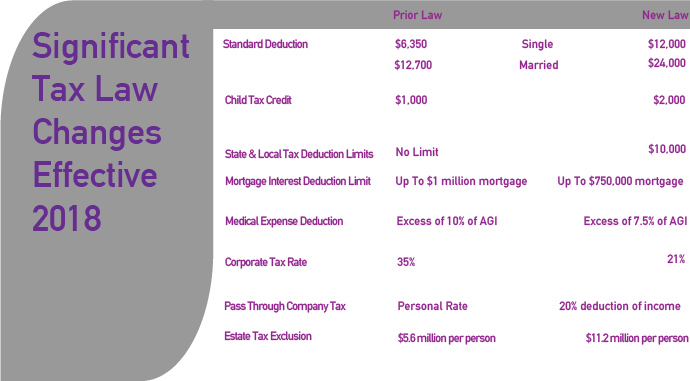
The new tax law imposes a repatriation tax on cash held overseas by U.S. corporations. A tax of 15.5% on liquid assets will affect various sectors and numerous companies that are estimated to have amassed over $2 trillion overseas. The new rate is considerably lower than the previous rate of 35%, incentivizing companies to bring cash back to the U.S.
Of the several sectors encompassing the equity markets, technology and healthcare companies hold the most cash overseas, placing them at the forefront of bringing billions of dollars back to the U.S. at the preferable tax rate.
After 4 days of trading in 2018 the S&P is up 2.6% year-to-date, the best start to a year since 2006. Since 1950, when the first 5 days are up over 2%, the S&P is higher for the year 15 out of 15 times with an average return of 18.6%. January is a seasonally strong month with an average return of 1.2% and historically a positive January has led to a positive year 86% of the time.
In previous newsletters we have discussed the “melt-up” theory which holds that bull markets usually end with a violent up move. This is the point where all the bears give up and all the retail money that has been on the sidelines rushes in and push stock prices much higher. We have previously mused that while this is one of the longest bull markets in history that there could still be significant upside. Clearly we are seeing the melt-up play out as nearly everyone is now on board.
There are a lot of reasons for bulls to celebrate and data to back up their case. The economy seems to be going gangbusters as GDP is hitting levels not seen in at least 8 years (the entire Obama administration), corporate earnings are strong, we have a seemingly business friendly administration cutting regulations, and to top it off we have a major tax overhaul. Strong technical and fundamentals can easily push this market much higher in the next 12 months but there could be a few speed bumps along the way that slow this market considerably. See our market commentary on page 8 of this newsletter to find out what might go wrong. Meanwhile, enjoy the party while it last – just don’t be the last one heading for the exits when the music ends.
Sources: Bloomberg, Reuters, www.congress.gov/bill/115th-congress/house-bill/1
Short Term Rates Heading Higher – Bond Market Overview
The Federal Reserve raised a key short-term rate as expected by the markets and made fairly optimistic comments about economic growth projections for 2018. The federal funds rate rose to a target range of 1.25 – 1.50%. The increase is a strategy of tightening and also meant to alleviate inflationary pressures. Concurrently, the Fed is also shrinking its $4.4 trillion balance sheet, a dual monetary policy effect expected to curtail inflation and reduce stimulus.
Members of the Federal Reserve indirectly expressed concern about the labor market, suggesting that improvements in the job market were expected to ease. The Fed committee also maintained a conservative growth estimate for 2018 of 1.8%, hinting that the new tax plan may not yet produce economic benefits in 2018.
The yield curve flattened throughout 2017, with a rise in short term rates and a drop in longer-term rates. The yield on the 2-year Treasury Note had its largest annual increase in over 10 years, ending the year at 1.89%, up from 1.22% at the beginning of January 2017 and has since risen to 2.09% The benchmark 10-year Treasury bond yield saw almost no change in 2017, falling to 2.40% at year end. from 2.45%. The 10 year has risen to 2.59% so far in 2018, a significant move in a very short period. Sources: Federal Reserve, U.S. Treasury, Bloomberg
Is The Bond Bull Dead?
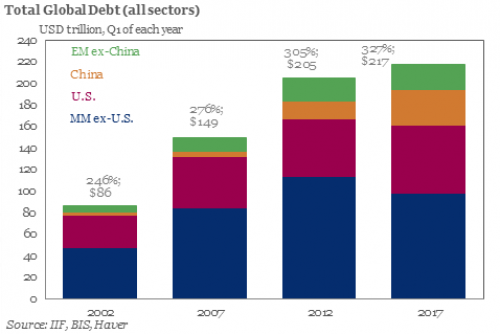
On January 9th, the (former) “bond king” Bill Gross tweeted “Bond bear market confirmed today. 25 year long-term trendlines broken in 5yr and 10yr maturity Treasuries”. As we have written previously, rising interest rates will have significant impact on investors and will result in massive losses for bond investors. Global debt has now reached $233 trillion, up $16 trillion in six months!! A mere 1% rise in interest rates equates to approximately $1.2 trillion in losses for bond investors. As interest rates continue to rise, liquidity in the credit markets could begin to dry up meaning many borrowers will be paying much higher rates to refinance their debt or even worse the lower credit quality borrowers (high-yield (junk) ) may be unable to obtain financing at any rate resulting in massive defaults. As we have discussed in previously newsletters this could be the trigger that not only slows down the stock market but we believe will ultimate cause a credit crisis that will dwarf the 2008 crisis. Why? Because global debt is nearly $80 trillion higher now than in 2007-2008 and much of this debt is very low quality. (Continued on next page)
Fixed Income Update – Global Debt Bubble
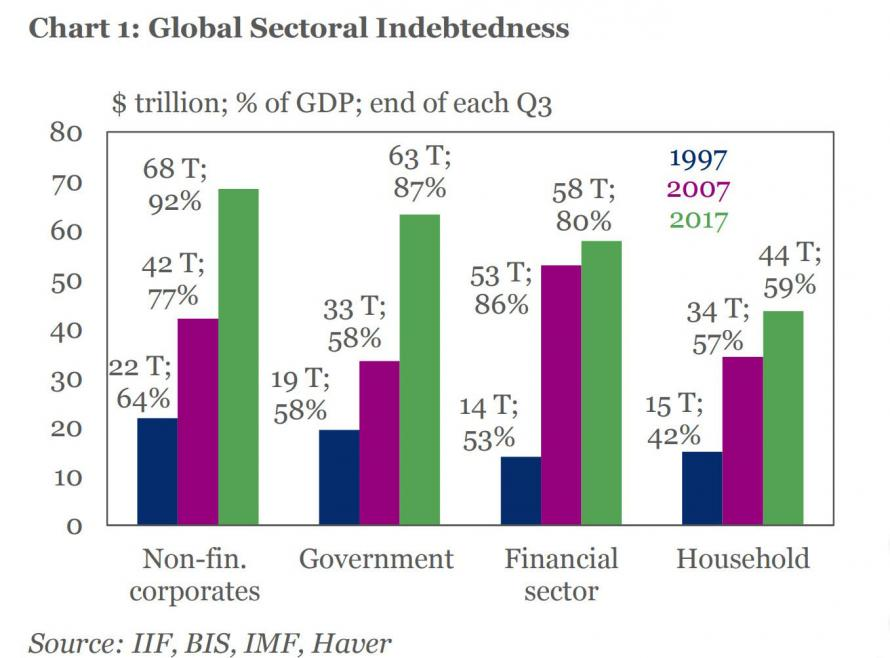
It isn’t just the total amount of debt that should worry investors but also the type of debt. As the chart below illustrates debt in every sector of the economy has ballooned since the financial crisis and is now at record levels.
In the 3rd quarter of 2017 household debt increased by $116 billion bringing total household debt to a record $12.96 trillion ($280 billion above the 2008 peak). Credit card debt surged 8% in the 3rd quarter alone bringing the total to $810 billion in unsecured debt. Auto loans increased 6.1% to a record $1.21 trillion. This is an amazing number when you consider that during the credit crisis total auto loan debt was approximately $500 billion. Almost $300 billion of the total auto debt is sub-prime loans and the delinquencies in these loans are already soaring to record levels. Many of these loans were made with no or in most cases negative equity, at interest rates of 25% or higher and terms of 84 months or longer. Needless to say, these borrowers have almost no hope of ever having equity in their vehicles and we expect to continue to see increasing defaults. Of course, these loans were almost all securitized into asset-backed securities (ABS) and the investors in the lower rated ABS could face some potentially massive losses. The largest risk lies with loans originated by auto finance companies where delinquencies have soared to 9.7% (and climbing) which is only 1.2% below the record 10.9% set during the Great Recession.
However, the most troubling area of debt for the economy, and the one most likely to end in complete disaster is the high yield debt market. A record amount of high yield (junk) debt has been issued since the Great Recession and much of this debt is coming due over the next 3-4 years. Zero (or negative in some cases) central bank policies have driven institutional investors searching for yield (after all they get paid to perform and they can’t sit in treasuries) and they have been all to eager to purchase shaky debt at historically tight levels. This yield grab has caused credit spreads to hit historically tight levels, which brings us to our next subject….
(Continued on next page)
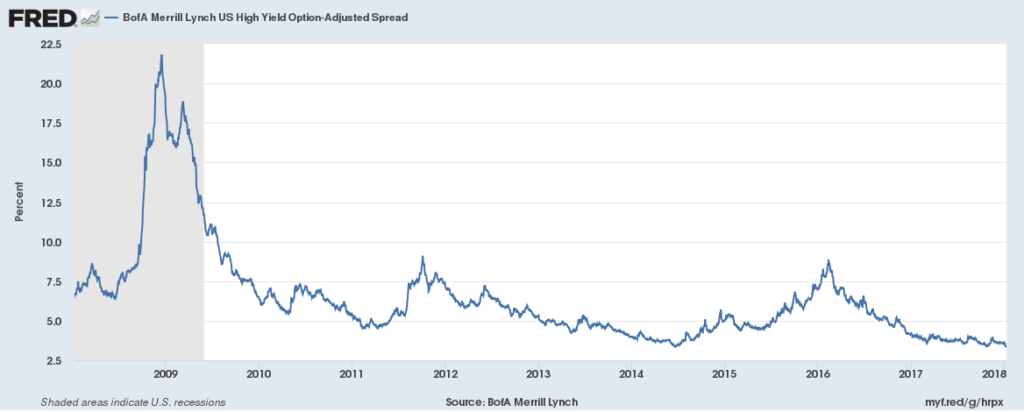
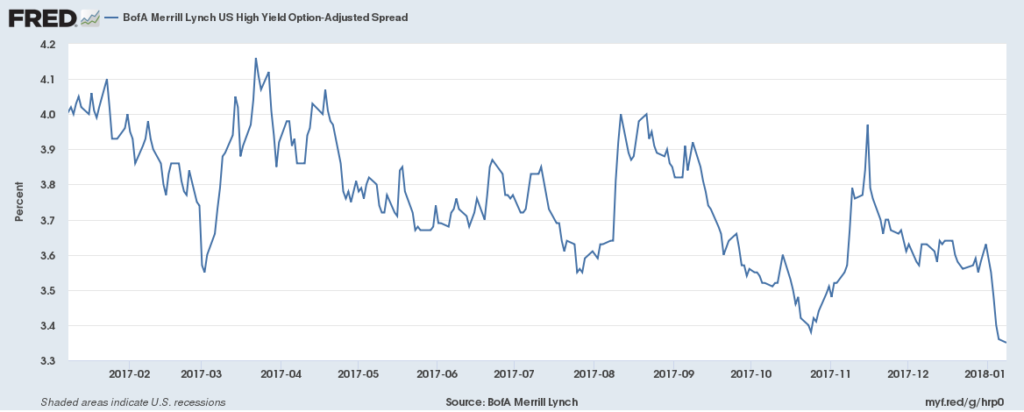
If you have read our past newsletters you know we have gone to great lengths to explain credit spreads (the compensation bond investors receive for taking risk) and if you have not they are available on our website for review. Each month we post this chart from the federal reserve which shows the spread (risk premium) investors are receiving on high yield bonds.
As the graph indicates, after a speed bump in November spreads have continued to grind tighter. High yield spreads are now sitting at the historically low level of 3.35%. This means an investor is receiving 3.35% over a comparable maturity treasury bond for loaning money to companies with poor credit (junk). Okay, so this 1 year chart doesn’t look so bad – spreads have come down but the graph doesn’t look so scary right? Let’s add some historical perspective to things.
However, the 10 year chart looks a bit more frightening:
Credit Spreads (Continued)
The chart clearly illustrates that we are at or near historically low spread levels. During the Great Recessions, spreads were over 20% and as recently as 2016 they were over 7.5% meaning investors are now receiving half the compensation for taking risk now than in 2016. Certainly, some would argue that the economy is doing better and companies should thrive and be able to repay their debt. The flip side is this much of this debt should have never been issued in the first place and most of it has been issued with extremely poor covenants (protection for investors – see November newsletter for explanation). So what does this all mean to investors? To put it in perspective, if spreads were to return to 2016 levels an investor holding an 8 year corporate bond would lose approximately 30 points in value ($100,000 invested today would be worth $70,000).
Now for our monthly TESLA check-in. As our readers know our favorite whipping dog is Tesla and believe the Tesla $1.8 billion 5.3% bonds issued in August 2016 represent the height of investors blind greed and the epitome of the insatiable yield orgy we have witnessed. Investors got a break since our last issue and the bonds seem to have stabilized in the $95 area for the past 2 months. Investors who own these bonds should consider being down 5% since issue a gift and run for the exits. As we have discussed these are unsecured bonds from a company that bleeds money and likely will for some time. Even worse, these bonds have very poor covenants and could easily become subordinate to a new issue any time Mr. Musk decides he needs more money (which likely won’t be long).
The New Tax Bill – Fiscal Policy Review
Both individual taxpayers and companies will see broad changes for deductions and tax rates. The emphasis of the tax bill, known formally as the Tax Cuts & Jobs Act, is to stimulate economic activity via new and higher paying jobs. This is why many of the changes directly benefit large and small businesses in order to encourage hiring.
Some of the tax provisions enacted by the new tax act will be temporary, while others permanent. The cost of reduced tax revenue brought about by tax cuts may only be viable for a certain period, thus producing more immediate benefits from tax cuts rather than later.
Affecting essentially every taxpayer is the increase in the standard deduction, which is meant to simplify the tax preparation process by replacing itemized deductions with a larger standard deduction.
The IRS estimates that about 95% of the businesses in the United States are pass-through entities, such as sole proprietors, S-Corps, LLCs, and partnerships. These entities are called pass-throughs because the profits generated are passed directly through the business to the owners, which are taxed at the owners’ individual income tax rates. The new tax law allows for a 20% deduction of that income, thus reducing overall taxable income. According to the Tax Foundation, pass-through businesses account for over 55% of all private sector employment, representing over 65.5 million workers nationwide.
Sources: IRS, www.congress.gov/bill/115th-congress/house-bill/1,
While the economy seems to be firing on all cylinders and everyone from Wall Street to Main Street is celebrating we remain optimistically cautious. The “melt-up” certainly appears to be playing out and there are likely some large gains left to be had in the stock market. So what could go wrong? Well, if you read this newsletter the imminent global credit crisis might give you pause. In our opinion it isn’t a matter of if but when this debt party will end and it will end very badly. Consumer debt is at all time record highs yet even with unemployment (supposedly) near 4% wages have barely moved and households have very little disposable income (as evident by the fact that they appear to be charging everything). Price/Earnings ratios are hitting historically high levels and rising interest rates will mean that they will have eventually come down. Margin debt (borrowing against securities in your brokerage account) has also hit a record level meaning that even a small drop in stock prices will trigger margin calls and investors will either be forced to sell securities or deposit more money into their account (which I think we have already established they likely do not have). Professional managers are also leveraging up which would exacerbate any sell off. Volatility is at historic lows and the trade of the last year has been to short volatility which could again further exacerbate any sell-off. There is also a significant amount of global political risk (terrorism, war, trade wars, etc.) and we believe it is highly unlikely that 2018 will be as tranquil as 2017. We remain very cautiously optimistic and believe investors should take steps to protect their investments. Low volatility means that protecting a portfolio is relatively inexpensive using options and advocate investors with large stock positions to purchase cheap insurance.
Where We See Value
While we are clearly concerned with rising debt levels and interest rates, we continue to advocate the mortgage and asset backed (MBS/ABS) trade for fixed income investors. The odd-lot market is extremely inefficient and retail investors (with a savvy adviser) can exploit that market and lock in some extremely attractive yields with very little risk. This week we purchased micro lot (10k-20k blocks), investment grade, short duration bonds with yields between 5.5-7.5%. The short duration and monthly cash-flow features of these assets mean they should fare far better in a major market correction or spread widening than traditional bullet maturity fixed income securities especially those with longer maturities. In one of the best examples of the massive inefficiency in this market this week we purchased several pieces of AAA/AAA rated auto and credit card ABS at yields over 6%. The IDENTICAL bonds were trading institutionally on the exact same day at yields under 2%. These bonds had an average life of between .5 and 1 year meaning that they have very little price sensitivity to moves in interest rates and spread widening. For the last several months we recommended several sectors in the ABS market (containers, rail cars, solar) and that trade has performed extremely well as spreads on these bonds have tightened considerable (meaning price has gone up). While we still prefer these to corporate bonds we believe they have tightened to levels that would give us pause. And remember – pigs get fat, hogs get slaughtered! Don’t be this guy!