MACRO OVERVIEW
Market Update
(all values as of 04.30.2024)

Stock Indices:

Dow Jones 37,815
S&P 500 5,035
Nasdaq 15,657

Bond Sector Yields:

2 Yr Treasury 5.04%
10 Yr Treasury 4.69%
10 Yr Municipal 2.80%
High Yield 7.99%

YTD Market Returns:

Dow Jones 0.34%
S&P 500 5.57%
Nasdaq 4.31%
MSCI-EAFE 1.98%
MSCI-Europe 2.05%
MSCI-Pacific 1.82%
MSCI-Emg Mkt 2.17%
 
US Agg Bond 0.50%
US Corp Bond 0.56%
US Gov’t Bond 0.48%

Commodity Prices:

Gold 2,297
Silver 26.58
Oil (WTI) 81.13

Currencies:

Dollar / Euro 1.07
Dollar / Pound 1.25
Yen / Dollar 156.66
Canadian /Dollar 0.79
 

Macro Overview – July 2018

Trade and tariffs disrupted markets in June as the U.S. Commerce Department announced tariffs on $250 billion worth of Chinese imports. The 25% tariffs will be imposed on 1,300 items encompassing a variety of products including aluminum, iron, gas turbines, snow blowers, milking machines, and dental drills.

A flattening yield curve, characteristic of rising short-term rates along with lingering long-term rates, startled fixed income markets. Higher interest rates reflect expectations of inflationary pressures and robust growth, while lower rates imply less inflation and dismal economic expansion.

As expected by economists and the markets, the Federal Reserve raised its short-term key policy rate, the federal funds rate, by 25 basis points to 1.75% – 2.00%. The gradual rise in rates is seen as a normalization of interest rates as the U.S. economy continues to expand. The Fed is accelerating the rate of tightening with increases slated for 2019 and 2020 now expected to occur in 2018 and 2019.

Reports from various Federal Reserve district banks reveal that a robust economy, growing tariff pressures, rising wage costs, and a tight labor market are contributing to consumer inflation. The Atlanta Federal Reserve’s economic growth model, GDPNow, estimates GDP growth for the second quarter of 2018 at 4.5%, adding to inflationary pressures.

Household wealth reached $100 trillion for the first time ever, as reported by the Fed. The $100 trillion mark is double of where household wealth was at the lows of the financial crisis in 2009.

The Supreme Court ruled in June that public sector unions cannot charge fees to government employees who do not support the union and who do not want to pay. The decision is expected to further weaken the influence of unions, which have been in a decades-long decline.

Emerging market currencies faltered against the U.S. dollar as global trade tensions and rising rates in the U.S. added pressure on emerging economies. China’s stock market and currency are both off since tariff contentions began, with the Shanghai Composite Index off 13.9% for the year and the Chinese currency off 3.5% against the U.S.dollar in June alone.

Volatility in the second quarter didn’t deter equity indices, as the S&P 500 was up 2.9% and the Dow Jones was up 0.7%. The tech heavy Nasdaq advanced 6.3% for the quarter, driven by buyers seeking shelter from the imposed tariffs. A stronger U.S. dollar is starting to weigh on the technology sector as earnings may become affected.

Sources: U.S. Commerce Dept., Federal Reserve, U.S. Treasury, https://www.supremecourt.gov, Bloomberg, S&P,Dow Jones, Nasdaq

 
FIXED INCOME UPDATE - YIELD CURVE

Flattening Yield Curve Startles Markets – Domestic Fixed Income Update

The rapid rise of short-term rates along with lingering long-term rates created unease with markets. A lack of rising long-term rates is indicative of weak long-term economic growth, where inflationary pressures may not be present or expanding. .

The continued increase in the 2-year Treasury yield is drawing interest from short-term investors as the 2.52 % yield at the end of June was greater than the 1.84% yield on the S&P 500. .

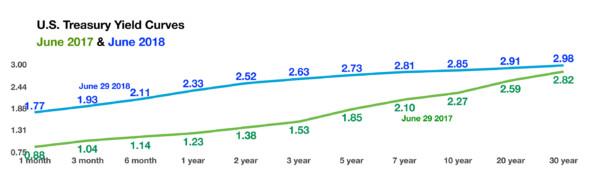
The difference in yield between the 2-year Treasury note and the 10-year Treasury bond narrowed to levels not seen since 2007. Also known as the spread, the difference between the 2-year note and 10-year bond is a barometer of economic sentiment. Should shorter term rates, such as the 2-year note, yield more than longer term rates such as the 10-year bond, then economic growth is expected to be lackluster. Some analysts view this narrow spread as a temporary event until economic growth accelerates driving longer term rates higher.  Sources: U.S. Treasury, S&P, Bloomberg

We have been discussing the declining yield curve for some time and we are now reaching levels that should give equity investors some concern. The debate rages on daily on CNBC and other financial networks about what the curve is telling us and there is no shortage of “this time it’s different” analyst telling viewers that the curve is not a reliable predictor of future economic activity. As our readers know, generally a very flat or inverted yield curve precipitates a recession and falling stock prices. Over the last 20 years it has been one of the most reliable indicators of an impending recession. Certainly, global central banks have distorted the yield curve with their massive quantitative easing and bloating their balance sheets to historic levels and this time may actually be different – but not in a good way. We believe fed intervention coupled with unprecedented levels of global debt could mean that this time is actually worse and artificially low interest rates have left central banks with very few bullets to fire should we see an economic slowdown or credit event.

 
FIXED INCOME UPDATE - CREDIT MARKETS

Risk Premium

In our April issue (see archives on website) we highlighted a chart which showed the historic spread difference between investment grade and high yield corporate bonds.  At the time, the difference was 234 basis points – meaning junk investors were being rewarded a 2.34% premium for taking the additional risk of owning junk paper and today that spread has moved a whopping 2 basis points and now sits at 236 basis points (2.36%).  Fixed income investors now face a rapidly declining and historically low yield curve (time premium) as well as a historically low credit spread (risk premium).  It should be obvious that bond investors are not being rewarded for the risk involved in owning longer maturity/lower credit quality securities and should be looking to move their fixed income investments into shorter maturity/higher credit quality bonds.  However, investors need to be very careful even buying investment grade (BBB or better) bonds because as we will now discuss “BBB ain’t what it used to be”.

The Changing Debt Market

In a recent Bloomberg article titled Corporate Bonds Are Getting Junkier the author Danielle Dimartino Booth (former adviser to the Dallas Fed) breaks down the debt market and  states:

Few investors realize the ticking time bombs populating what they believe are the safest parts of their portfolios”

In the article she points out that BBB rated corporate bonds (the lowest rung on the investment grade ladder) has quadrupled since the credit crisis and now totals $2.56 trillion surpassing the sum of all higher-rated debentures which total $2.55 trillion.  This means that BBB rated bonds now exceed by 50% the size of the entire investment grade market at the peak of the last credit boom in 2007.  Meanwhile, net leverage has increased from 1.7 times in 2000 to 2.9 times as of the end of 2017.

Today, there is more than $1.21 trillion worth of junk-rated debt outstanding which is nearly double the amount of junk debt in 2007.  If that isn’t scary enough for you, levered loans (which are generally riskier than junk bonds) have reached a mind boggling $1.22 trillion meaning it is now larger than the junk bond market. The levered loan market is generally where companies whose credit is so weak they can’t access even the high-yield bond market to obtain financing.  In both the junk and levered loan market the covenant quality has deteriorated to historical lows.  Remember, covenants are the rules that borrowers and lenders agree upon and are in place to enforce what issuers are required to do and what they cannot do meaning these covenant lite loans offer investors almost no ability to force the borrowers to behave.  Several issues ago we reported that Moody’s Covenant Quality Indicator now sits at 4.32 – a score of 1 denotes the strongest investor protection and 5 is the weakest.  We are now in the 11th consecutive month above 4.2.

For perspective, the total corporate bond and levered loan market totals $7.5 trillion meaning that junk and levered loans now account for 1/3 of the entire market and BBB bonds which are ONE downgrade away from being junk account for another 1/3.  This is simply astounding and illustrates that the credit markets learned absolutely nothing from 2007.

We do not know how to be any more clear on this subject – fixed income investors need to exercise extreme caution and make sure they have a very good understanding of the risk they are taking in their portfolios.

 
FIXED INCOME UPDATE - CONCLUSION

Fixed Income Conclusion and Recommendations

Regular readers know that since the inception of this newsletter we have followed the TESLA corporate bonds which were issued last August at par ($100) with an almost laughable 5.3% coupon.  The bonds traded in the $87 area as recently as May and have recovered slightly and now trade at $90.83.  This bond issue epitomizes investors carefree and glutenous chase for yield at any cost.

Given the low credit spreads and flat yield curve where can income seeking investors find value?  We recommend investors look to investment grade asset-backed securities with short durations.  This is one area where smaller investors actually have an edge over the institutional players as the price disparity between round-lots and odd-lots (for our purposes we will call a round-lot over $100k although in the institutional world anything under $1 million is considered an odd-lot).  Small block sizes of AAA to BBB rated asset-backed securities can be purchased several points below the exact same security trading in larger size with yields ranging from 5% to as high as 7%.  These securities have the added protection of being backed by hard assets (auto loans, mortgages, credit card receivables) and generally consist of a large number of assets which diversifies the risk of a single borrower going bad.  These are complex securities and require an extremely knowledgeable adviser with the proper analytics and we suggest anyone interested in purchasing these securities ask some very tough questions of their asset manager.

Last month we issued a special report (available on our website) on a particular type of floating rate corporate bond which we believe offers one of the best risk/return and total return profiles we have seen since the credit crisis. These bonds are investment grade rated (generally high IG – A or better), offer a floored worst case return in the 3.5% to 4% range but have double digit upside.  We are allocating 10% of conservative clients portfolios into this trade and up to 50% for aggressive client portfolios.  For the full report you can visit our website and see the June special report and there is a condensed version at the end of this newsletter.

Our model portfolio was up 3% (after fees) for the first half of the year  which is quite remarkable considering the Bloomberg Barclays Bond index is essentially flat for the year and has a duration of more than double our model portfolio duration (meaning we are generating higher returns with less risk).  Many of the largest bond mutual funds actually have YTD returns that are negative and mutual fund investors should be diligent in understanding the investments in their funds.  One of the largest bond funds in the world which is managed by none other than the “Bond God” Bill Gross recently dropped 3% due to bets he had made on foreign bond spreads.

The lesson here is do your homework and make sure your adviser or manager can explain the rationale and risk behind each investment made on your behalf.  Of course if you are in a mutual fund you are unfortunately at the mercy of the managers whims – I seriously doubt Bill Gross will pick up your call and explain to you how 3% of you money just disappeared.

 
Fixed Income Update - Social Security Troubles

Social Security Taps Trust Fund – Financial Planning

The Social Security program’s cost will exceed its income this year for the first time since 1982, forcing the program to access a $3 trillion trust fund to cover future benefits. Social Security is funded by two trust funds, one for retiree benefits and another for disability benefits.

The latest annual report issued by the trustees of Social Security and Medicare revealed that by 2034, the program’s trust fund will be depleted. Depletion means that Social Security recipients will 
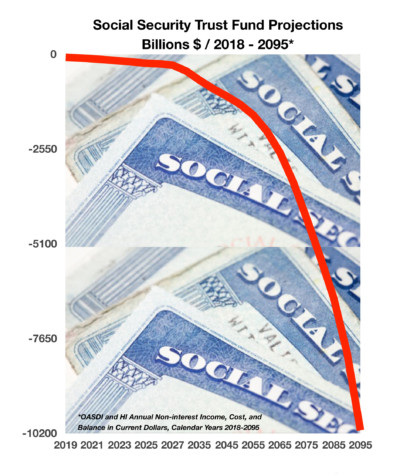
no longer be receiving full scheduled benefits. Recipients would receive about three-quarters of their scheduled benefits after 2034. Congress can eventually act to fortify the program’s finances, but it may be years before it actually takes effect and funds.

The report also mentioned that Medicare’s hospital insurance fund would be depleted in 2026, three years earlier than anticipated in last year’s report. The trustees noted that the aging population of the country has placed additional pressure on both the Social Security and Medicare programs. A decade ago, roughly 12% of Americans were age 65 or older, today 16% of Americans have already surpassed 65, the eligibility age for Medicare.

The Social Security Administration considers various factors in projecting its estimates, including fertility, immigration, wages, health, and economic growth. A recent drop in U.S. birthrates along with stagnant wages has placed additional burden on the viability of future benefit payments.
Sources: https://www.ssa.gov/oact/TR/2018/index.html

The lesson here is that you better be ready to supplement (or completely fund) your own retirement.  If they are telling us 2034 you can best believe it is almost certainly going to be broke MUCH sooner and the cuts will be coming.


EQUITY UPDATE

Equities Achieve Positive Quarter Despite Volatility – Domestic Equity Markets Update Energy and technology sector stocks led the markets in the second quarter. All three major indices ended the quarter positively, in light of volatility and trade policy tensions. The S&P 500 was up 2.9% and the Dow Jones was up 0.7%. The tech heavy Nasdaq advanced 6.3% for the quarter. With oil prices climbing, the energy sector was the market’s top performer for the second quarter, marking its single largest quarterly gain since 2011. Technology sector stocks were also up for the quarter as the sector dodged the tariff turmoil during most of the second quarter, but may be adversely affected by a continuing strengthening dollar. US intellectual property and the growing prominence of technology in the global economy is becoming forefront for regulators, as the administration focuses on protecting U.S. intellectual assets. Markets are attempting to decipher what industry and companies may be hindered by the newly imposed tariffs. Some companies plan to absorb a portion of the tariffs while others will pass along the costs in the form of higher prices to customers. Liquidity among S&P 500 companies is distributed unevenly, with the top 25 companies in the index accounting for over 55% of the $1.9 trillion in corporate cash. The bottom 250 companies in the S&P 500 hold essentially no cash.

Sources: S&P, Dow Jones, Nasdaq, Bloomberg

We expect to see continued volatility as the equity markets struggle to find a direction.  The market has to overcome some significant headwinds – trade wars, domestic and geo-political concerns including mid-term elections, a slowing global economy, as well as central bank tightening.  It isn’t clear yet if the big move up in stocks over the last 2 years was the “melt-up” and we tend to think that there is still a major leg up ahead before this market finally runs out of steam.  However investors would be wise to stay flexible and hedged.  At the very least,  investors who have been riding the margin train should consider reducing or eliminating their leverage.  We have seen record amounts of margin debt (as well as every other type of debt) which could easily exacerbate any protracted move down in stock prices.


NEXT PAGE: FIXED INCOME TRADE IDEA – YIELD CURVE STEEPENING TRADE

 
FIXED INCOME TRADE IDEA - YIELD CURVE STEEPENERS

Corporate Structured Notes – Yield Curve Steepening Trade

Overview
Corporate structured notes with coupons which are calculated based on the steepness of the yield curve have seen significant price declines in the last 12 months and we believe at the current distressed levels they represent one of the best risk/return profiles available in the fixed income universe. Yield Curve “Steepeners” are issued by many of the largest financial institutions (Bank of America, JPM, Citicorp, etc.) and carry the same investment grade rating as the issuers on-the-run debt. These bonds are designed with coupons that float based on the steepness of the yield curve – steep yield curve = higher coupon and vice versa. For the most part, the coupons on the secondary offerings issued 4-5 years ago have gone to zero sending prices plummeting 30-50%. The bonds can now be purchased with a significant spread to treasuries assuming a zero coupon for life offering investors a “floor” or minimum return if held to maturity but have tremendous upside price potential should the curve normalize.

Investment Thesis

1. Minimum Return with Significant Upside – At current levels, secondary Yield Curve Steepeners offer investors a “floored” return in the 3%-4% range to maturity with possible double-digit annualized returns should the yield curve normalize.
2. Distressed Pricing– The recent flattening in the yield curve has pushed the coupons to zero which resulting in a mass exodus by retail investors and price declines of 30%-50%. We believe the bulk of the price damage has already been done.
3. Spread – The bonds now offer a generous spread over treasuries even as a zero coupon for life. It is almost certain that at some point over the life of these bonds the yield curve will widen from current levels which would significantly further increase the spread to treasuries over on-the-run bullet corporates with similar maturities.
4. Credit Worthiness – The issuers are the largest financial institutions in the world and are generally rated high investment grade. There has been no deterioration in the credit quality of the issuers. The price decline is merely a function of the declining coupon and mass selling.
5. Historical Yield Curve – The yield curve is currently near historic lows and has been declining for four years. In previous cycles, once the yield curve reaches a bottom it tends to widen very quickly and overshoot the historical averages.
6. Callability – a quickly steepening yield curve would send the coupons on these bonds significantly higher very quickly making it likely the issuers would call the bonds at par. This would generate returns in the 20% range.
7. Timing – The recent wave of selling has resulted in an unusual amount of secondary supply meaning larger investors can likely build sizable positions which is generally difficult given the small issue sizes.
8. Hedge – The yield curve tends to steepen during times of economic stress meaning the coupons on these bonds should be moving higher as interest rates move lower and stock prices are declining.


FIXED INCOME TRADE IDEA - YIELD CURVE STEEPENERS

The Yield Curve
Steepeners have floating coupon rates which reset based on the steepness of the treasury swaps curve with the 30yr to 2yr, 30yr to 5yr, and 10yr to 2yr being the most commonly used curves. The chart below shows the current and 10-year historical swap curves for the most commonly followed curves.

The left side of the chart shows the current curve levels and the right side shows the historical high, low, and average for each curve for the last 10 years. Note how close several of the curves are to inverting,  5’s to 30’s is currently 5.42 basis points with a 10-year historical average of 129 basis points. The 2’s to 10’s curve is 18.27 with a 10-year historical average of 154 basis points. Across the board almost all the curves are making new 10-year lows. In the range column you can graphically see how far each curve is from its historical average. The #SD column shows the number of standard deviations we currently are from the 10-year historical average. The 5’s to 30’s curve is -2.1 standard deviations from the mean which is statistically significant in that we can deduce over the long run that we are at historical extremes and while the timing is uncertain a reversion to the mean is almost a statistical certainty.


NEXT PAGE: ANALYZING THE BONDS

 
FIXED INCOME TRADE IDEA - YIELD CURVE STEEPENERS

Bond Structure
These bonds are issued by almost all the major financial institutions with stated final maturities of between 10-15 years and are generally investment grade rated. The coupons generally reset quarterly and are calculated using a formula based on the steepness of the yield curve. The parts of the formula are:

1. Teaser Rate – the initial high coupon used to entice investors which usually last for 1 year.
2. M – Multiplier. In almost all formulas the spread difference between 2 treasury swap curves is
1. multiplied to get the coupon, the M can vary from 4-9.
2. S1 – The longer-term swap rate being used to calculate the yield curve.
3. S2 – The shorter-term swap rate which is subtracted from the long-term rate to determine the spread that will be multiplied by M.
4. St- Strike. Some structures have a strike level which is further subtracted from the difference in the yield curve before multiplying by the M.

The formula can be expressed as:
Coupon = M x ((S1 – S2)- St)

While it may seem complicated it is simply the Swap Curve – Strike x Multiplier. Below are some of the most commonly used formulas:

1. 4 x ((30yr – 5yr) -25bps) 4. 4 x ((30yr – 5yr) – 50bps)
2. 4 x ((30yr – 2yr)- 25bps) 5. 4.5 x ((30yr – 2yr) – 100bps)
3. 5.5 x (30yr – 2yr) 6. 4 x ((10yr – 2yr) – 50bps)

Working through the formula you will find that all else being equal you would prefer a higher multiplier off the widest curve and a low (or no) strike. Of the three formulas above and all else being equal (price), bond 3 would be superior because it has the highest multiplier, uses the traditionally widest curve, and has no strike. Of course, the price of the bond is determined to a large extent by the formula. Formulas that are more likely to get a coupon more quickly trade at higher prices. The bonds that do not have a strike will have a coupon unless the yield curve is inverted. The table below contains four bonds from our inventory which we will use to illustrate a few of the different formula structures and how they affect pricing and expected returns.

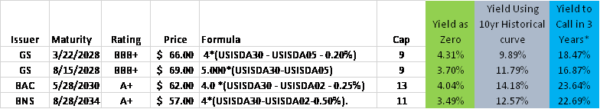
The important takeaway from this chart is that if the yield curve never steepens and stays flat or inverted (which has never happened in history) the worst case yield on these bonds is between 3.49% on the BNS (Bank of Nova Scotia) and as high as 4.31% on the GS (Goldman Sachs).  If we use the historical yield curve pattern since 2006 the yields are between 9.89% on the GS bond and 14.18% on the BAC (Bank of America).

 
FIXED INCOME TRADE IDEA - YIELD CURVE STEEPENERS

Timing – Why Now?

If the yield curve is still falling and likely to stay low for the next couple of years why put this trade on now and essentially have dead money for up to 2 years earning a zero coupon. To answer that it is important to understand the typical investor of these bonds and how that is affecting the supply of available bonds which has led to the currently distressed prices. These bonds are generally issued with very small deal sizes and as new issues are geared toward less sophisticated retail investors. If the largest and presumably smartest financial institutions are issuing these bonds it should be obvious that as new issues they are not a good deal for the investor. Investors who couldn’t believe their good fortune that Bank of America decided to pay them a 10% coupon for a year have now seen their coupons continuously fall for 3-4 years and their prices drop 30-50%. For most of these securities, the recent sharp decline in the yield curve means the coupons have finally hit zero and prices have fallen precipitously in the last six months. Panicked investors have begun a mass exodus out of these securities which has led to an increase in supply and has also sent prices plummeting to levels that we believe is below where these bonds would normally trade. Once the weak hands have been washed out it is likely that the supply of available bonds will decrease rapidly causing prices to normalize and making it difficult to build a sizable position.

Risk Factors and Considerations
1. Flat Yield Curve – if the yield curve fails to normalize over the life of the bond the coupon would remain zero and the total return remains in the 4% area.
2. Bankruptcy – The underlying issuer goes bankrupt and there is no recovery.
3. Credit spreads widen – A dramatic widening in credit spreads could negatively impact the price of the bonds.
4. Alternative Investments – Investors could invest in the standard fixed rate, similar maturity debt of the same issuers and do a slight pick in spread of 10-50 basis points.
5. Income – There is no guarantee the yield curve will steepen and never produce income therefore these bonds should be avoided by investors whose priority is income vs. total return.
6. Pricing – The bid/ask spread is extremely wide on these securities and it is reflected in the pricing of the major pricing services. Investors who purchase these securities are almost certain to find that they are priced below their purchase price (often by points). It is common for these to be priced below the actual bid side. This pricing problem will keep many professional money managers from even considering these securities as it can have an immediate negative impact on their performance numbers (this is also a reason they trade at distressed levels).