Ocean Park Capital Management

2503 Main Street

Santa Monica, CA 90405

Main: 310.392.7300

Daily Performance Line:  310.281.8577

March 2017 Results
Market Update
(all values as of 06.28.2024)

Stock Indices:

Dow Jones 39,118
S&P 500 5,460
Nasdaq 17,732

Bond Sector Yields:

2 Yr Treasury 4.71%
10 Yr Treasury 4.36%
10 Yr Municipal 2.86%
High Yield 7.58%

YTD Market Returns:

Dow Jones 3.79%
S&P 500 14.48%
Nasdaq 18.13%
MSCI-EAFE 3.51%
MSCI-Europe 3.72%
MSCI-Pacific 3.05%
MSCI-Emg Mkt 6.11%
 
US Agg Bond -0.71%
US Corp Bond -0.49%
US Gov’t Bond -0.68%

Commodity Prices:

Gold 2,336
Silver 29.43
Oil (WTI) 81.46

Currencies:

Dollar / Euro 1.06
Dollar / Pound 1.26
Yen / Dollar 160.56
Canadian /Dollar 0.73

Fund Overview

Equities were mixed in March, with the Dow and the S&P 500 down and the NASDAQ Composite up.  Paced by our positions in technology stocks, we posted solid gains and outperformed all the major indices.

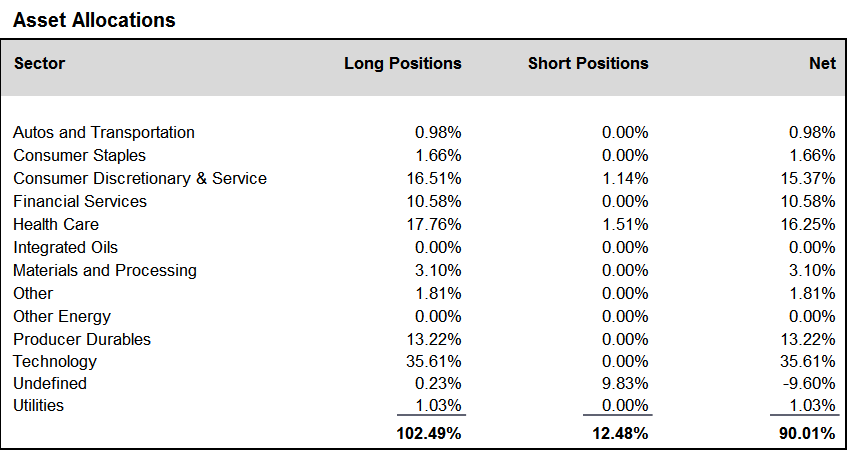
During the month of March, we increased positions in the financial services, producer durables, and materials and processing sectors.  To maintain balance in the portfolio, we increased our short position in SPYs and QQQs, which appears in the Undefined category in the Asset Allocation Chart.  We finished the month at about 90% net long, unchanged from the end of February.

A schedule showing the performance of the Investors Fund is included below, along with our Asset Allocation Chart. Daily updates on our activity are available on our Results Line, at
310-281-8577, and current information is also maintained on our website at www.oceanparkcapital.com. To gain access to the site enter password opcap.


*These results are pro forma.  Actual results for most investors will vary.  See additional disclosures on page 4.
Past performance does not guarantee future results.

 
March 2017 - Equity Update

Equity Overview

Stocks moved in a narrow range in March and finished the month close to their February levels.  This pause is not surprising, given the advances since the election.

As in the prior month, investors favored growth over value stocks, and stocks in companies with positive earnings surprises did well.  Bank stocks reversed from their February highs and were the worst-performing sector for the month.  Technology stocks were strongest, followed by manufacturing and consumer stocks.

Toward month’s end, as it became clear that efforts to repeal Obamacare would fail, the Dow dropped for eight straight days, its longest losing streak in six years.  The actual losses, however, were modest, totaling about 2%.


March 2017 - Macro Overview

Macro Overview

Economic data for March were generally positive.  Employment and hourly wages grew strongly.  Manufacturing activity reached its highest level since 2014, and consumer confidence as measured by the Conference Board reached its highest level since 2000.

In response to signs of a strengthening economy, the Fed raised interest rates for the second time in three months.  As we previously suggested might happen, the markets interpreted the event positively, and rallied. In addition, talk is turning to unwinding the Fed’s outsized balance sheet, which ballooned to $4.5-trillion in the aftermath of the financial crisis. New York Fed President Dudley has suggested that the Fed may delay further interest rate hikes while the unwinding process begins, so as to observe its impact on long-term rates.

Less sanguine for the new administration were prospects for its legislative agenda, which appears stalled.  Notwithstanding their control of the presidency, the Senate, and the House of Representatives, Republicans were unable to make good on their promise to “repeal and replace” Obamacare, as a result of discord among competing factions of the party.  When it became clear that they did not have the votes for passage in Congress, Republicans withdrew their bill.  Analysts saw broader implications in this failure, most notably its impact on tax reform.  Republicans had projected a $1-trillion savings from Obamacare repeal, which they planned to use to fund large-scale tax cuts.  The absence of that savings added to the already uncertain prospects for significant tax reform.


March 2017 - Additional Disclosures

Additional Disclosures

Performance data for OPI reflect the reinvestment of dividends and other earnings on the fund’s assets.  Performance data for the major indices reflect only changes in the value of those indices, and would be higher if dividends were included. However, the index data do not reflect fees that would be paid to index fund managers and transaction costs that would be incurred when their component stocks are bought or sold, while OPI’s data do reflect quarterly fees and expenses incurred by the fund.  The information provided is believed to be reliable, but its accuracy or completeness is not warranted. This material is not intended as an offer or solicitation for the purchase or sale of any stock, bond, mutual fund, or any other financial instrument. The views and strategies discussed herein may not be appropriate and/or suitable for all investors. This material is meant solely for informational purposes, and is not intended to suffice as any type of accounting, legal, tax, or estate planning advice. Any and all forecasts mentioned are for illustrative purposes only and should not be interpreted as investment recommendations.