April 2017
Market Update
(all values as of 08.30.2024)

Stock Indices:

Dow Jones 41,563
S&P 500 5,648
Nasdaq 17,713

Bond Sector Yields:

2 Yr Treasury 3.91%
10 Yr Treasury 3.91%
10 Yr Municipal 2.70%
High Yield 6.92%

YTD Market Returns:

Dow Jones 10.28%
S&P 500 18.42%
Nasdaq 18.00%
MSCI-EAFE 9.72%
MSCI-Europe 9.81%
MSCI-Pacific 9.34%
MSCI-Emg Mkt 7.44%
 
US Agg Bond 3.07%
US Corp Bond 3.49%
US Gov’t Bond 2.95%

Commodity Prices:

Gold 2,535
Silver 29.24
Oil (WTI) 73.65

Currencies:

Dollar / Euro 1.10
Dollar / Pound 1.31
Yen / Dollar 144.79
Canadian /Dollar 0.74

Macro Overview

Equity markets advanced during the first quarter as improving economic data supported gradually rising earnings. A steady and predictable path of anticipated rate increases this year by the Federal Reserve was well received by financial markets.

Domestic equity indices ended positive for the first quarter of 2017. The Dow Jones Industrial Index was up 4.6%, the S&P 500 Index returned 5.5%, and the technology heavy Nasdaq ended the quarter with a 9.8% gain. Many believe that an underlying global recovery may be underway, leading to domestic equity demand here in the U.S.

The Fed hiked short-term rates as expected in March, on track with two additional hikes in 2017 with improving economic data validating the Fed’s continuance of rate increases. The Fed has so far increased rates only three times in the past 16 months, one of its slowest paces ever. Fixed income analysts view the Fed’s decision to set two additional rate hikes in 2017 as a normalization of the interest rate environment, away from further accommodative policy producing low rates.


Inflation On Track For Fed Rate Hikes – Monetary Policy

A primary determinant for the Fed’s decision to raise rates is inflation. As part of its monetary policy objectives, the Fed had set a 2% target for consumer inflation as a trigger for sustained rate increases.

A closely follo
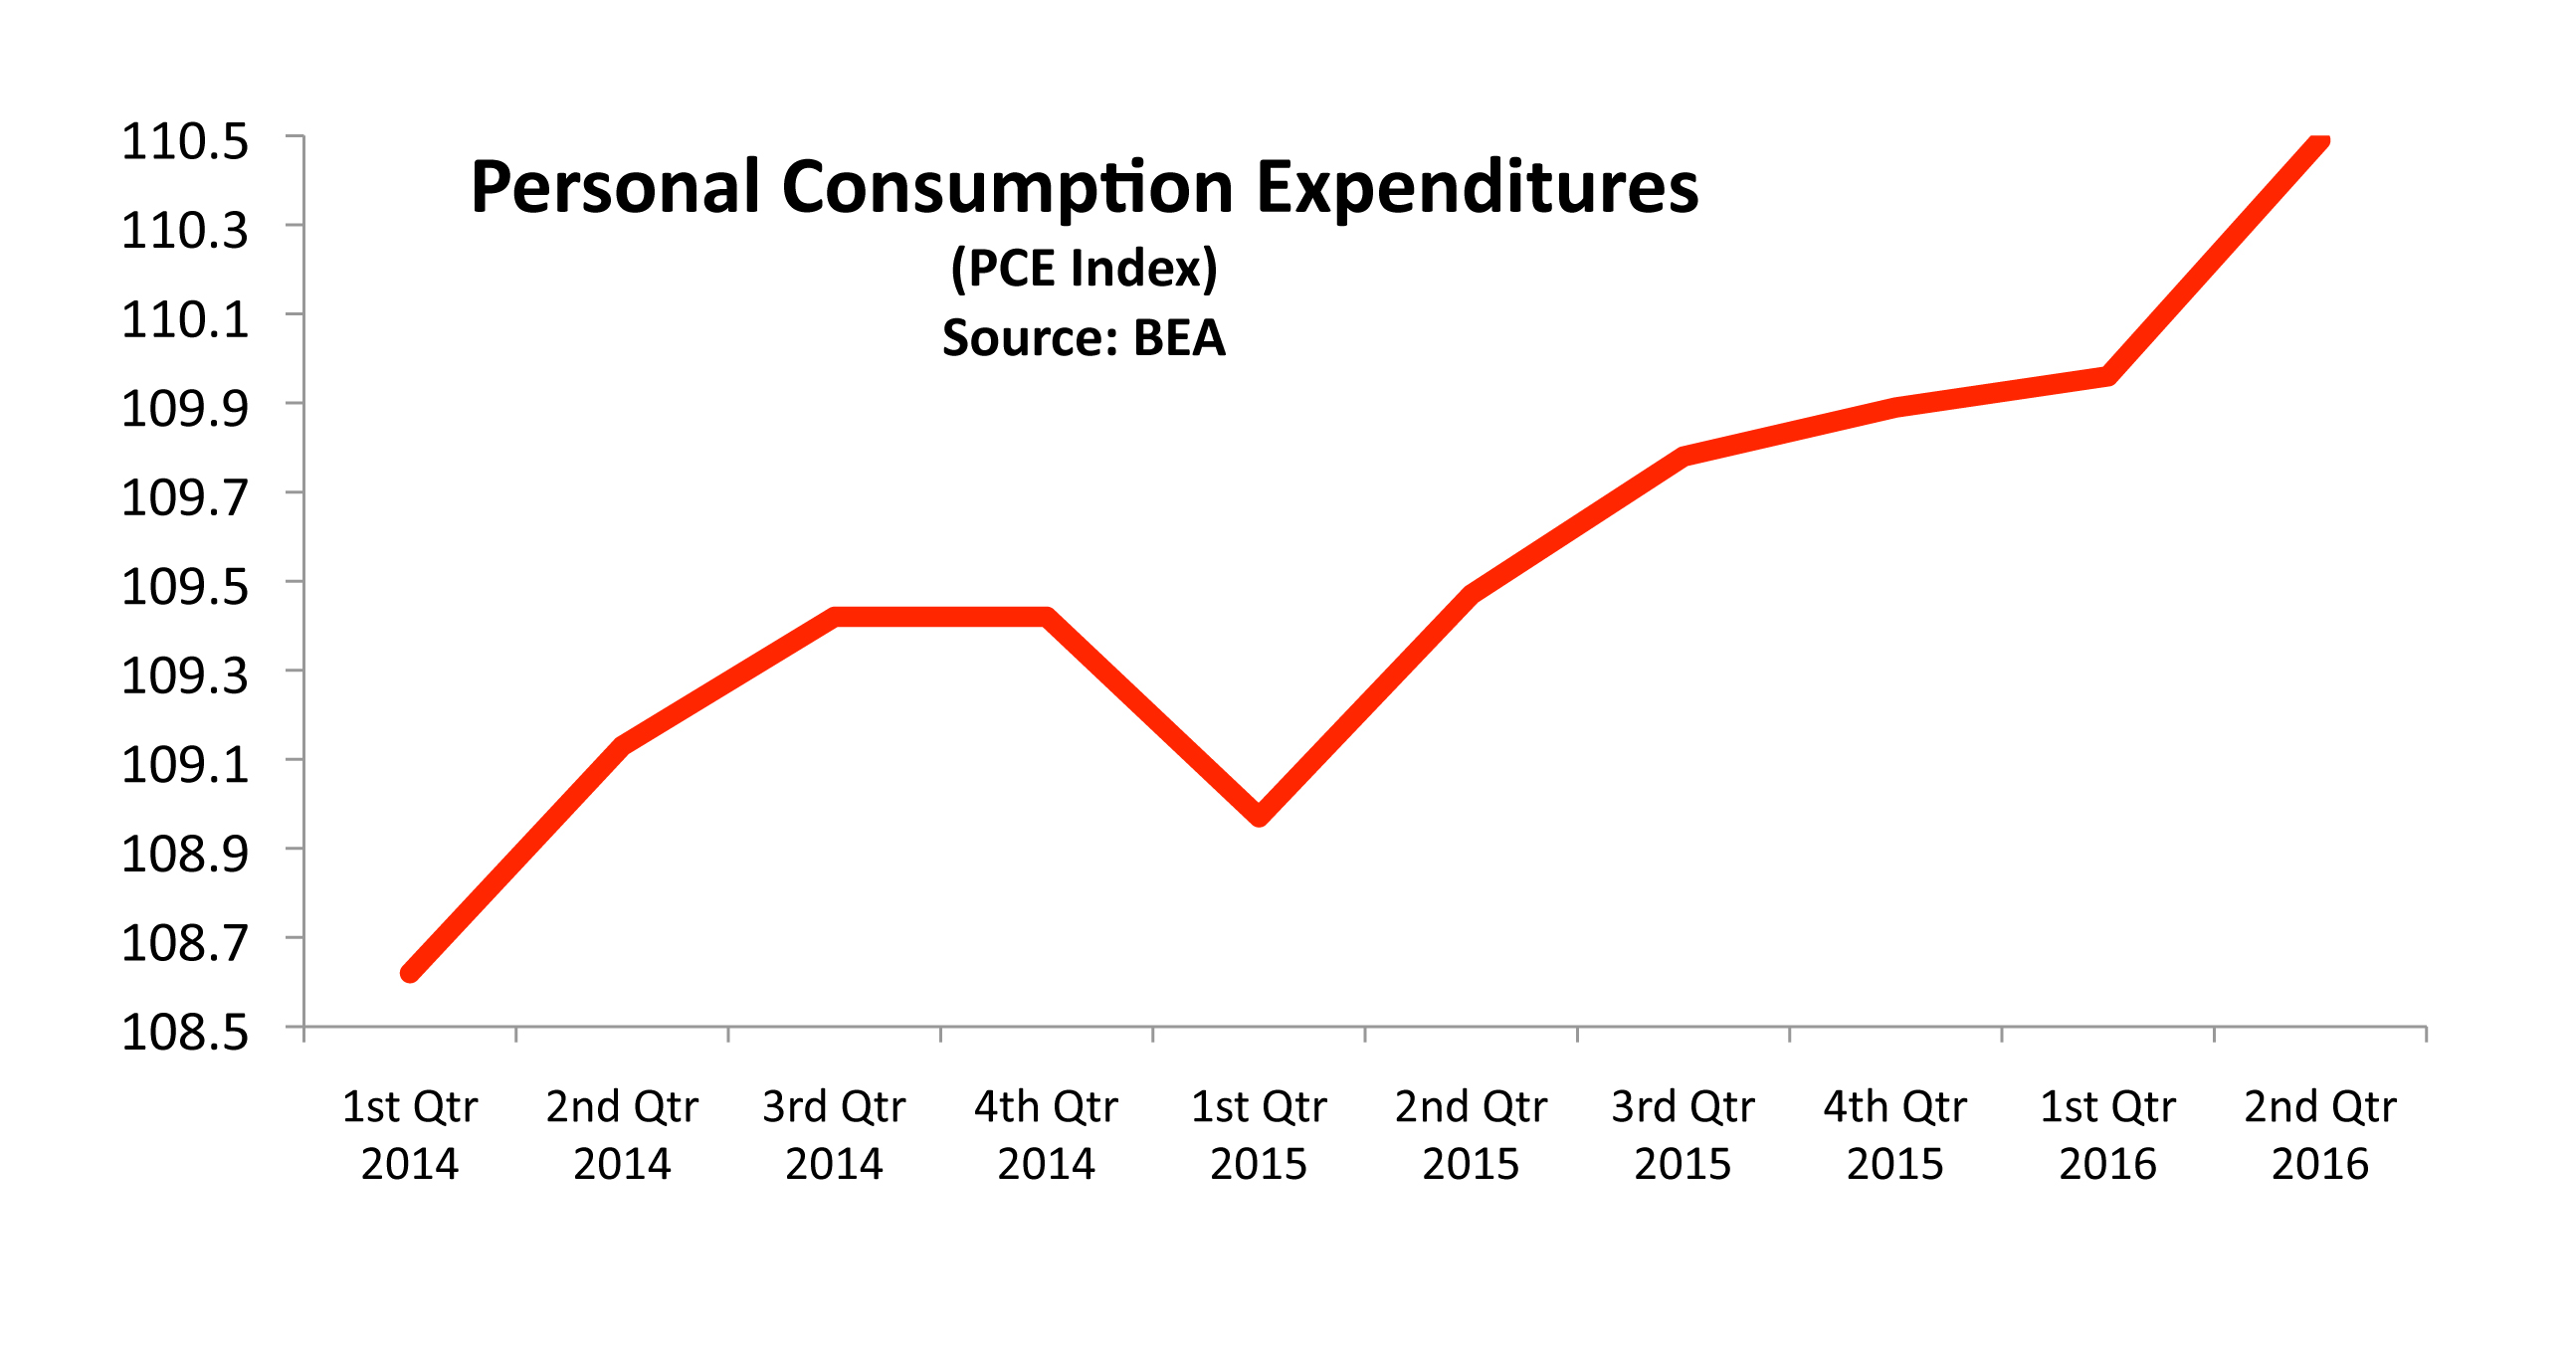
wed indicator of inflation and what consumers pay for goods and services is the Personal Consumption Expenditures Index, also known as the (PCE), which is compiled and released by the Commerce Department each month. The most recent data released shows that consumer inflation edged up 2.1% over the past year, marking its largest annual gain since March 2012.

A rising PCE is indicative of rising prices for consumers throughout the economy, in other words inflation. One of the Fed’s mandates is to thwart inflationary pressures with gradual increases in short-term rates. This monetary policy tool has been used for decades as it stems inflation and slows consumers down from spending too much before it evolves into inflation. (Sources: Commerce Dept., Fed.)


U.S. Tax Revenue & Tax Freedom Day

U.S. Tax Revenue – Fiscal Policy Review

With tax season upon us, the Federal government’s ability to tax comes into full force. The dynamics of tax revenue is a combination of economic prosperity, tax rates, and the existing population of taxpayers. Ong
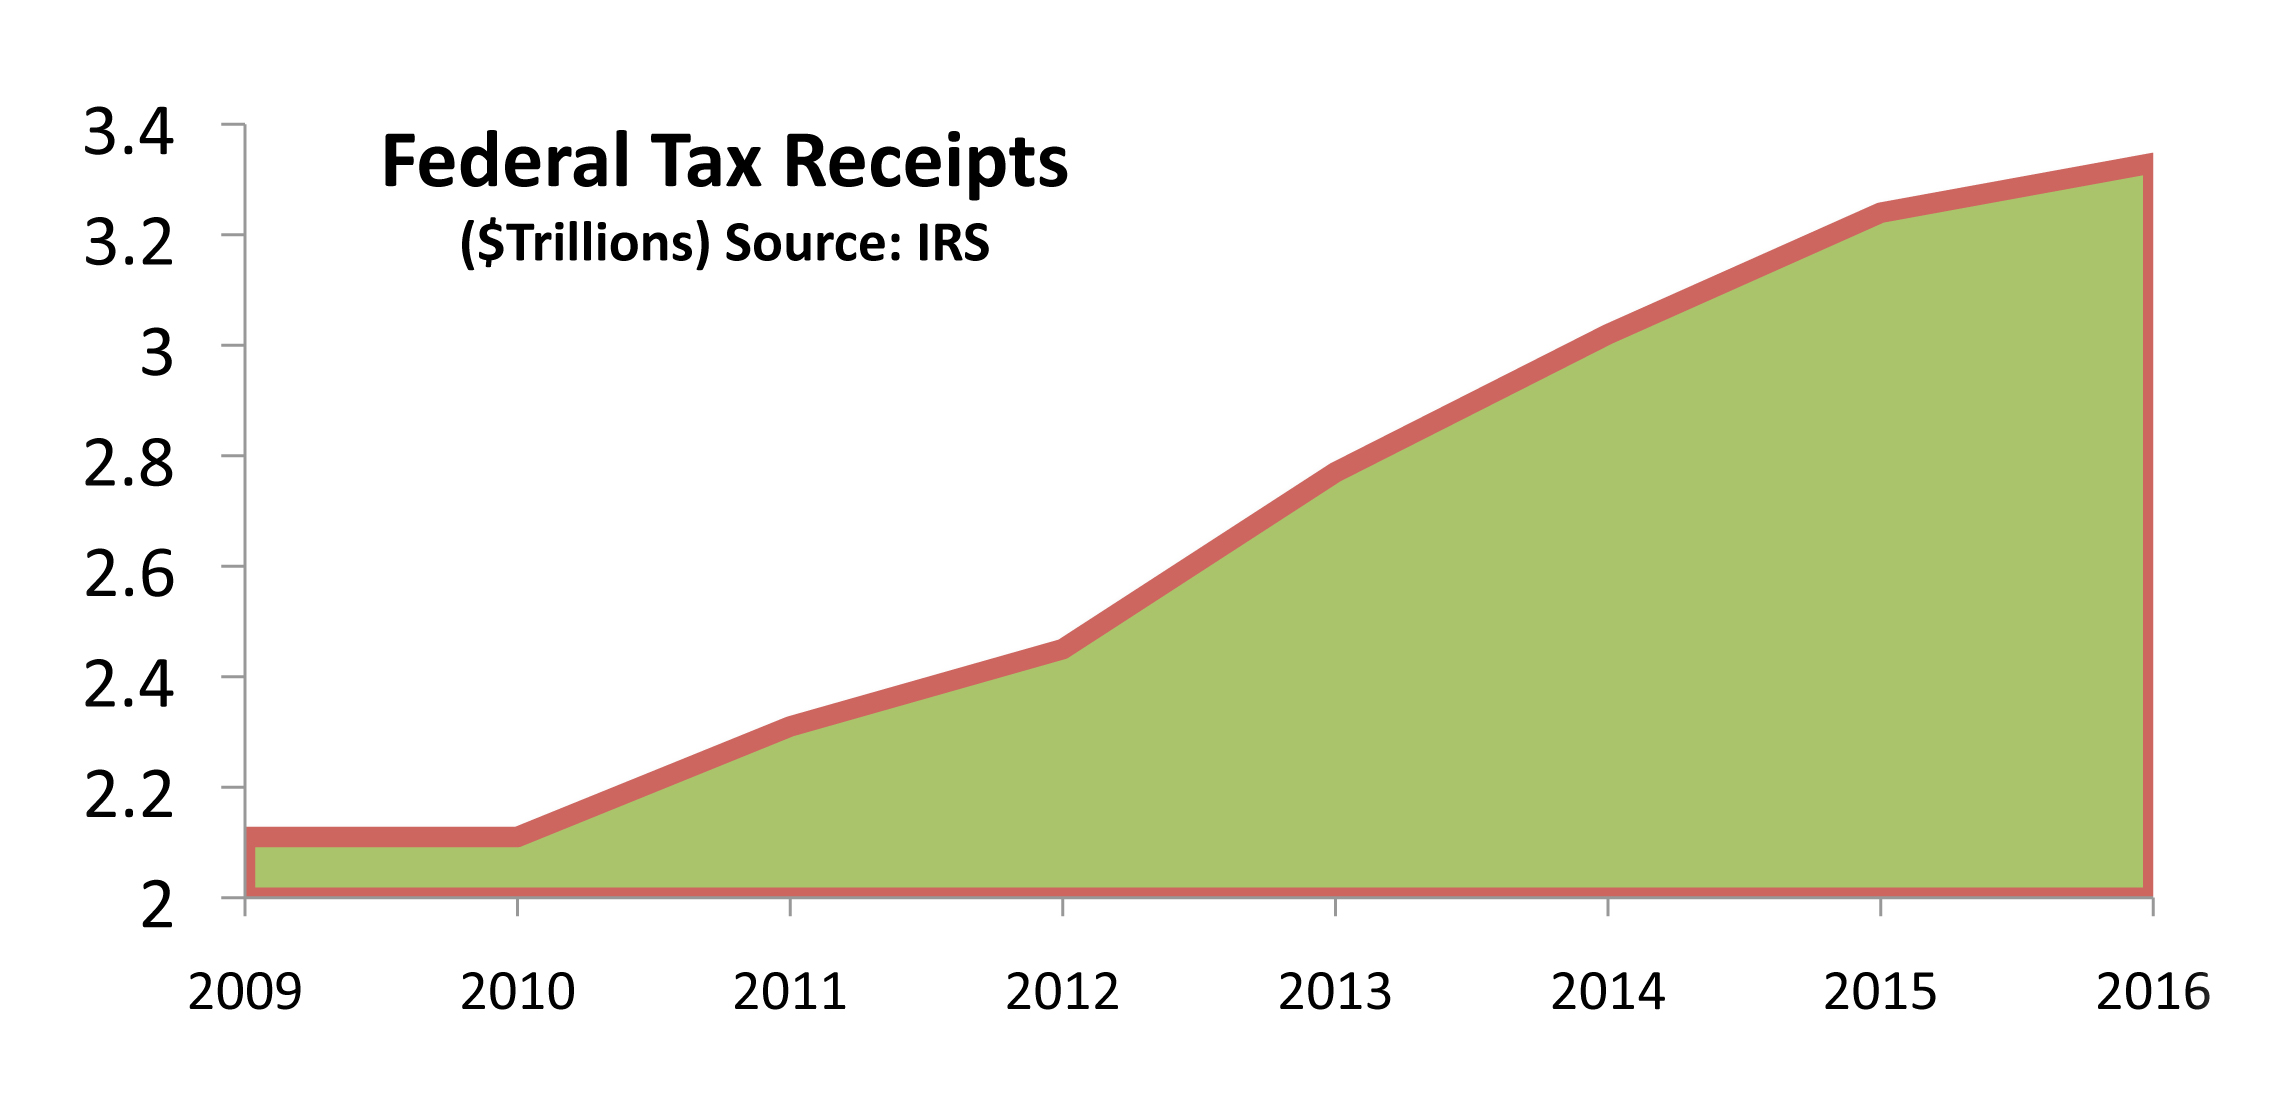
oing discussions surrounding tax rates have been a focus of how to increase tax revenue. However, the other two components include economic conditions and the number of individuals paying income taxes. As new hires enter the workforce, either out of school or as immigrants, additional tax revenue is derived from their incomes. As economic conditions improve, companies may hire additional employees and eventually start to issue pay raises.

For the past 40 years federal tax receipts have increased an average of 6.76% each year, including year-over-year decreases in 1983, 2001, 2002, 2003, and 2009. (Sources: CBO, Tax Policy Center)


Tax Freedom Day – Market Fact

Every year, the nation celebrates Tax Freedom Day, the day that the nation as a whole has earned enough to pay for all taxes due throughout the year. This year, Tax Freedom Day is April 24th.

The Tax Foundation calculates Tax Freedom Day by using the total amount of taxes paid the previous year then considers historical trends and recent economic data.

For 2016, the Foundation projected $3.3 trillion in federal taxes and $1.6 trillion in state and local taxes. The total of $5 trillion is then divided by the total personal income earned by Americans each year, deriving a ratio of 31. This number means that Americans work a third of their lives just to pay taxes. Once the ratio of 31 is multiplied by 365 days, then that’s how we arrive at April 24th.

From a calendar perspective, January income is for federal income taxes, February is for Social Security, Medicare, and payroll taxes. March income is for state, excise and property taxes, while April is for the incidental corporate, estate tax and motor vehicle fees.

Taxes due from state to state vary considerably, since some states carry higher taxes than others. Residents from certain states such as Connecticut, New York, and New New Jersey may not celebrate Tax Freedom Day until May, while Louisiana celebrates it in late March. (Sources: IRS, The Tax Foundation)


Where Our Tax Dollars Go To & Consumer Confidence On The Rise

Where Our Tax Dollars Go To – Historical Fiscal Overview

For fiscal 2015, the federal government took in over $3.2 trillion in tax payments, a record year compared to previous fiscal years. The federal budget for fiscal year 2015 ran from October 1, 2014, to September 30, 2015.

The total figure amounts to approximately $21,833 for every person in the United States.

Taxpayers wonder, where does all their tax money go. The office of Management & Budget breaks down where tax payments go each year, allowing Americans to see what they’re getting. (Sources: Office of Management & Budget)


Consumer Confidence On The Rise – Consumer Behavior

Two key measures of consumer confidence soared to levels not seen since 2000, helping to propel equities higher towards the end of the first quarter.

Since consumer expenditures make up nearly 70% of Gross Domestic Production (G
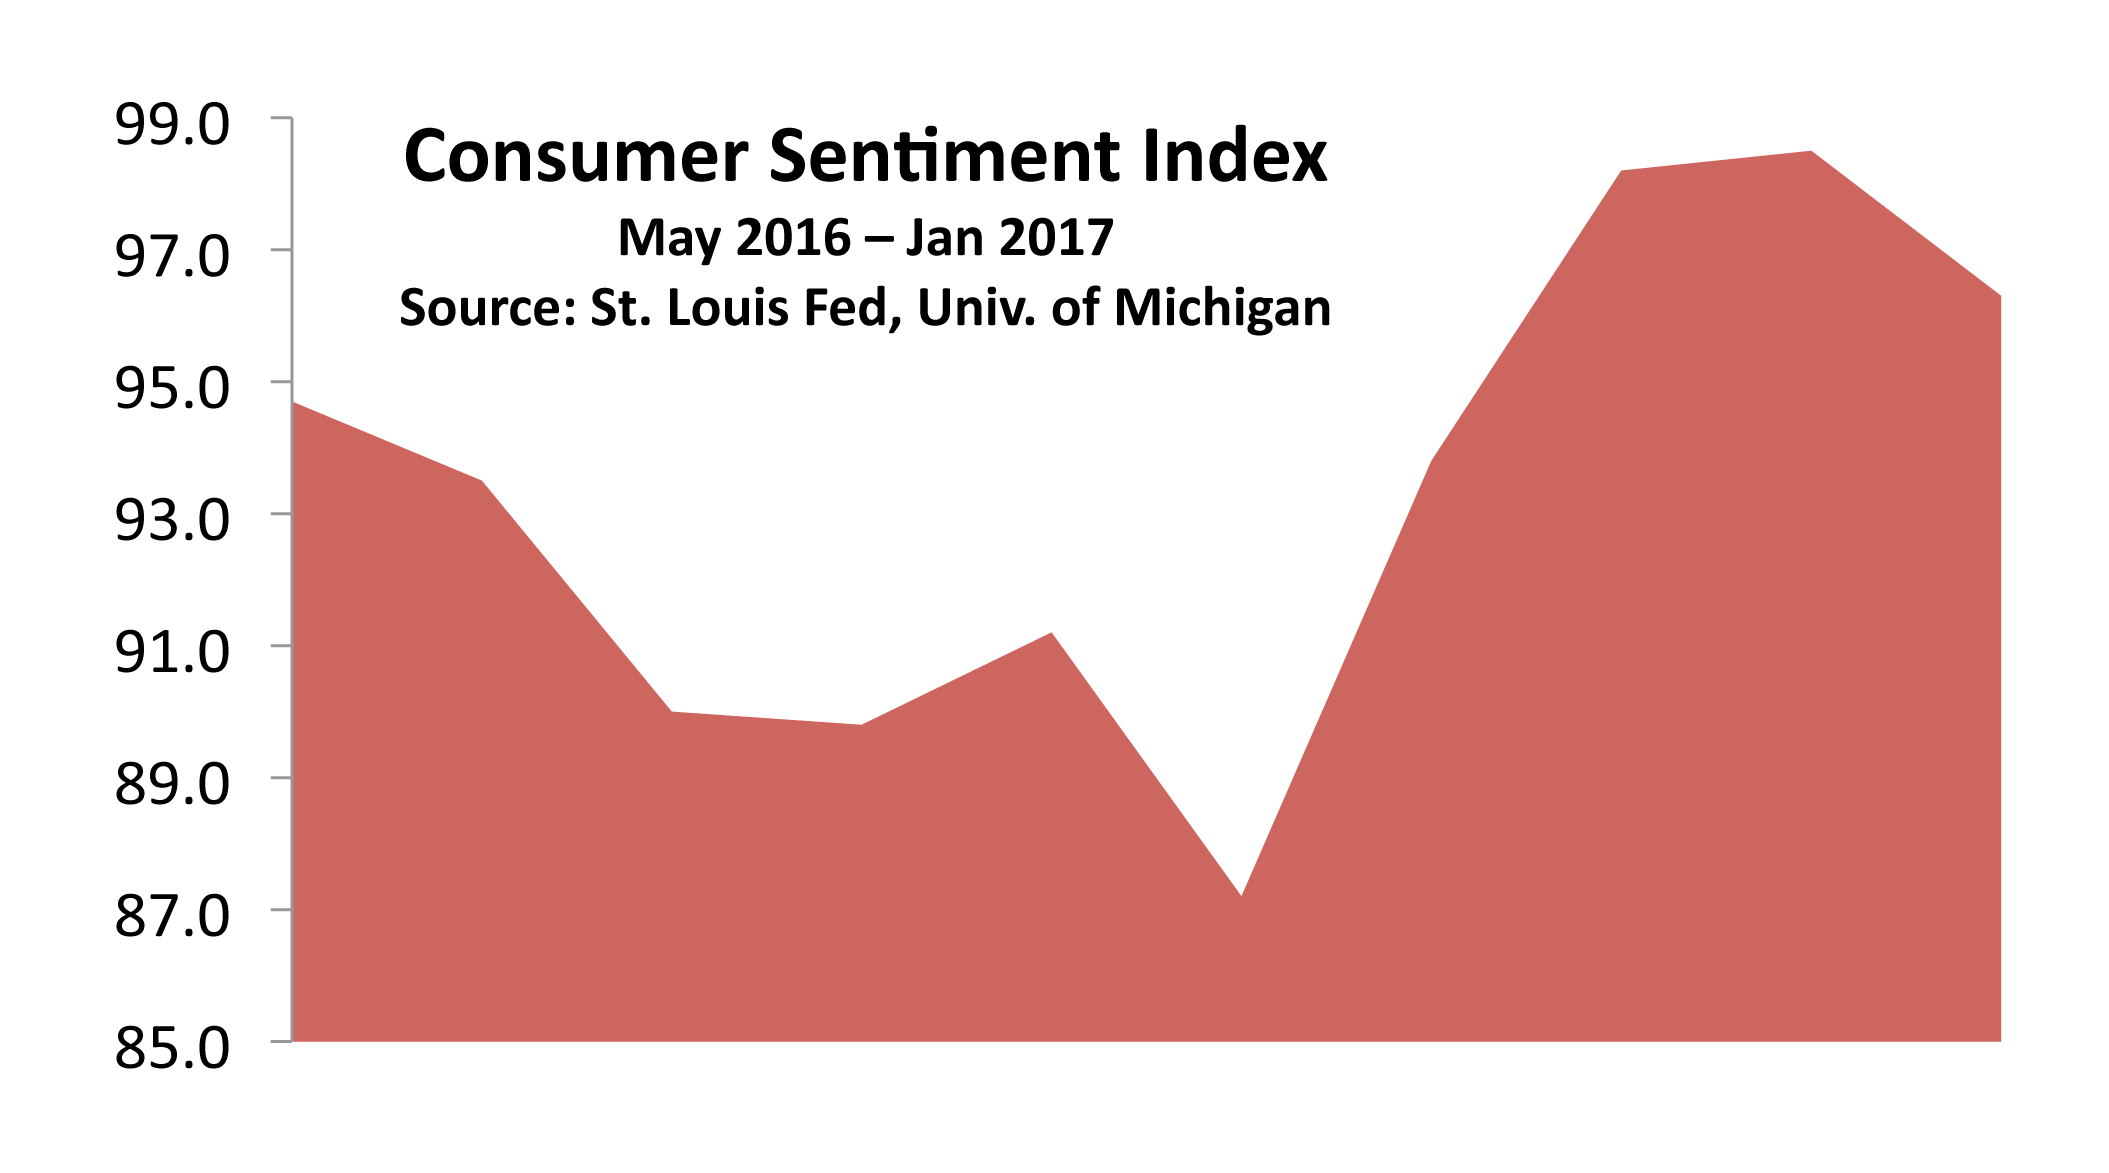
DP), growing confidence among consumers is viewed optimistically by economists.

A non-profit research group, The Conference Board, compiles and releases its Consumer Confidence Index each month, an indicator of consumer sentiment. In its most recent release, the Conference Board saw the largest increase in its index since December 2000.

Another highly regarded index on consumer confidence is the Consumer Sentiment Index from the University of Michigan, which saw its largest increase in 17 years. (Sources: Commerce Department, Univ. of Michigan, Conference Board)


Household Debt On The Rise Again & Auto Sales May Have Peaked

Household Debt On The Rise Again – Consumer Finance

According to data from the Federal Reserve Bank of New York, total household debt climbed to $12.58 trillion at the end of 2016, an increase of $460 billion for the year, making it the largest increase in almost a decade. The current amounts are almost equal to the debt levels Americans had in 2008, when total consumer debt reached a record high of $12.68 trillion.

The Fed tracks household debt by categories, such as mortgage, student, credit cards, home equity loans, and auto loans. Over the decades, the most consistent and significant amount of household debt has been mortgages.

The recent increase in total overall debt is primarily attributable to a steady rise in both student and auto loans. Recent Federal Reserve data shows that these two loan types are primarily held by younger consumers. The concern is that the difficulty of obtaining mortgage loans has led younger consumers to take out student and auto loans instead. (Sources: Federal Reserve Bank of New York)


Auto Sales May Have Peaked – Industry Overview

Low interest rates and aggressive leasing programs have made some fairly expensive cars affordable. Rather than struggling to get approved for a new home loan or refinance, Americans have instead financed cars, where getting a loan approval has been easier. The abundance of attractive loans has helped elevate auto sales throughout the country over the past few years. Recent auto sales have been slowing across the country as dealer incentives have become less effective.

The end of 2016 saw auto loans outstanding reach $1.1 trillion, propelled by continued low interest rates. Federal Reserve data revealed that the average rate on a typical 4 year auto loan was 4.45% in the 4th quarter of 2016. The same auto loan in February 1982 was 17.05%. (Source: Fed)