Joseph SchwSDWIA Bridgearz, CFA 612.355.4365

Stephen Dygos, CFP® 612.355.4364

Benjamin Wheeler, CFP® 612.355.4363

Paul Wilson 612.355.4366

www.sdwia.com

Market Update
(all values as of 06.28.2024)

Stock Indices:

Dow Jones 39,118
S&P 500 5,460
Nasdaq 17,732

Bond Sector Yields:

2 Yr Treasury 4.71%
10 Yr Treasury 4.36%
10 Yr Municipal 2.86%
High Yield 7.58%

YTD Market Returns:

Dow Jones 3.79%
S&P 500 14.48%
Nasdaq 18.13%
MSCI-EAFE 3.51%
MSCI-Europe 3.72%
MSCI-Pacific 3.05%
MSCI-Emg Mkt 6.11%
 
US Agg Bond -0.71%
US Corp Bond -0.49%
US Gov’t Bond -0.68%

Commodity Prices:

Gold 2,336
Silver 29.43
Oil (WTI) 81.46

Currencies:

Dollar / Euro 1.06
Dollar / Pound 1.26
Yen / Dollar 160.56
Canadian /Dollar 0.73

Macro Overview – April 2017

Equity markets advanced during the first quarter as improving economic data supported gradually rising earnings. A steady and predictable path of anticipated rate increases this year by the Federal Reserve was well received by financial markets.

Domestic equity indices ended positive for the first quarter of 2017. The Dow Jones Industrial Index was up 4.6%, the S&P 500 Index returned 5.5%, and the technology heavy Nasdaq ended the quarter with a 9.8% gain. Many believe that an underlying global recovery may be underway, leading to domestic equity demand here in the U.S.

The Fed hiked short-term rates as expected in March, on track with two additional hikes in 2017 with improving economic data validating the Fed’s continuance of rate increases. The Fed has so far increased rates only three times in the past 16 months, one of its slowest paces ever. Fixed income analysts view the Fed’s decision to set two additional rate hikes in 2017 as a normalization of the interest rate environment, away from further accommodative policy producing low rates.

President Trump’s political capabilities are being tested as he needs to substantiate that he can formalize legislative arrangements rather than business transactions. The inability to initiate a bill to repeal the Affordable Care Act (ACA) created uncertainty as to whether or not future legislative ambitions would prove more challenging. In addition to resuscitating a health care bill, tax reform is expected to be President Trump’s next objective, which many expect easier to tackle since lower taxes are a common theme among the divided Republican party.

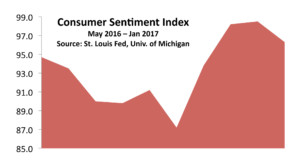
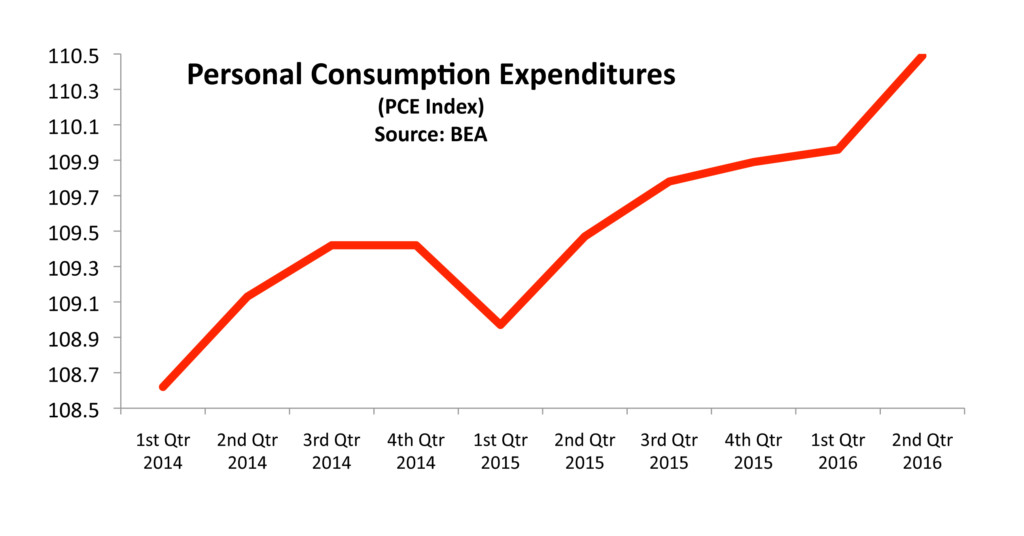
Two well respected measures of how consumers feel and how they perceive the economic environment showed dramatic increases in their most recent data. The Consumer Confidence Index, compiled by the Conference Board, and the Consumer Sentiment Index, prepared by the University of Michigan, both elevated to record levels. Since consumer expenditures make up nearly 70% of Gross Domestic Production (GDP), growing confidence among consumers is deemed optimistic by economists.

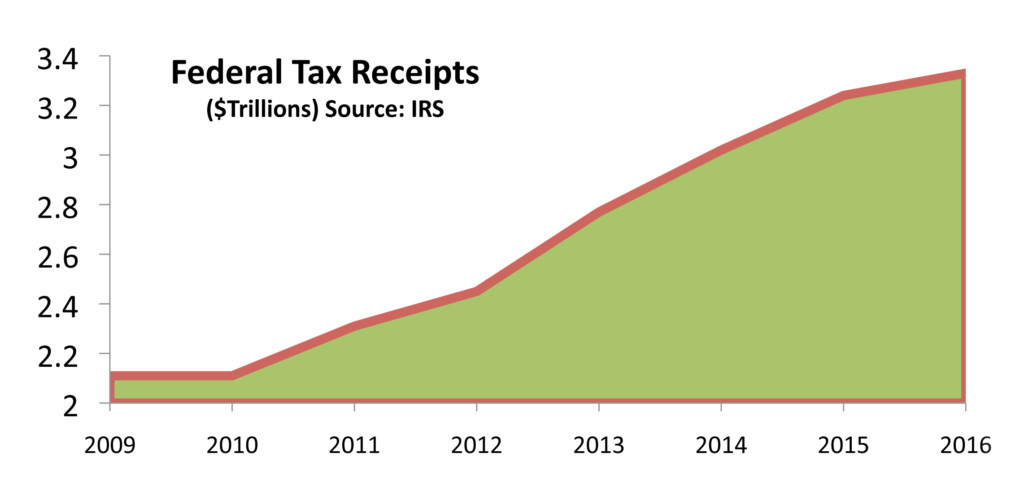
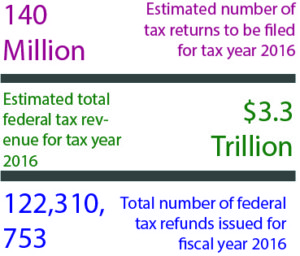
With tax season underway, estimates from the IRS show that over 140 million tax returns will be filed for the 2016 tax year with over $3.3 trillion in federal tax revenue.

Sources: Federal Reserve, Dept. of Commerce, Dow Jones, S&P


Generous First Quarter – Domestic Equity Update

The first quarter saw all of the major equity indices end positive, with the Dow Jones Industrial Index ending up 4.6%, the S&P 500 Index returned 5.5%, and the Nasdaq ended the quarter with a 9.8% gain. The S&P 500 index peaked on March 1st, ending lower at quarter end yet still up for the quarter as its sixth straight positive quarter.

Equity markets reversed an upward trend in place since the election, as the inability for House Republicans to agree on a revised healthcare bill dampened growth prospects towards the end of the first quarter.

What was of interest regarding the positive outcome in the first quarter was that the market’s performance was not due to the Trump sector stocks that excelled following the election, which were actually lack luster during the 1st quarter. Technology underperformed after the election but had the single largest return of any of the sectors. The technology sector led the 1st quarter rally, producing the largest gain of any of the industry sectors.

On March 22nd, the Securities & Exchange Commission (SEC) adopted a rule to shorten the settlement period for securities from 3 business days to 2 business days. The SEC believes that a shorter settlement period will reduce certain credit, market, and liquidity risks. The new rule will take affect September 5, 2017.

Sources: SEC, Dow Jones, S&P

Rates On Track To Rise Slowly – Fixed Income Overview

Rates retreated downward during the first quarter as growth prospects were alleviated even though the Federal Reserve raised rates in March.

Treasury bond yields rose in early March in anticipation of accelerated Federal Reserve tightening and then fell following a sense that the Fed may proceed with cautioned rate hikes due to possible lackluster economic data. The Fed increased its target on short-term rates (Federal Funds Rate) to 0.75-1.0% and signaled two more anticipated hikes in 2017.

A jump in the Personal Consumption Expenditure (PCE) index to 2.1% has validated the Fed’s stance of continued rate hikes and an eventual winding down of its government and mortgage bond holdings on its $4.5 trillion balance sheet.

Sources: Federal Reserve, Reuters, Bloomberg


Inflation On Track For Fed Rate Hikes – Monetary Policy

A primary determinant for the Fed’s decision to raise rates is inflation. As part of its monetary policy objectives, the Fed had set a 2% target for consumer inflation as a trigger for sustained rate increases.

A closely followed indicator of inflation and what consumers pay for goods and services is the Personal Consumption Expenditures Index (PCE), which is compiled and released by the Commerce Department each month. The most recent data released shows that consumer inflation edged up 2.1% over the past year, marking its largest annual gain since March 2012.

A rising PCE is indicative of rising prices for consumers throughout the economy, in other words inflation. One of the Fed’s mandates is to thwart inflationary pressures with gradual increases in short-term rates. This monetary policy tool has been used for decades as it stems inflation and slows consumers down from spending too much before it evolves into inflation.

Ironically, even though inflation erodes the buying power of consumers, it is an essential ingredient for healthy economic growth. Inflationary pressures help elevate wages and income, allowing consumers the ability to spend more throughout the economy.

Sources: Commerce Dept., Federal Reserve


Brexit Is Finally Underway – Euro Region Update
Ever since British voters decided to have Britain exit the European Union (EU) in June 2016, the process and timeline of the exit have been in question. This past month, British Prime Minister Theresa May triggered Article 50 which begins a two-year period of negotiations with the EU on exiting the union and establishing remediary trade arrangements with applicable countries. Should negotiations not be completed within the two-year period, then Britain would be required to follow World Trade Organization (WTO) rules on tariffs.

What has kept Britain from formally moving forward with its decision to exit the EU has been the delay in executing Article 50, which was never signed by the prior prime minister, David Cameron, and delayed by British courts on its applicability.

The execution of Article 50 comes at a time when other EU member countries are having elections with EU membership as a notable topic.

Here in the United States, triggering Article 50 is akin to having a U.S. state secede from the nation.

Sources: EuroStat, Europa.eu

Consumer Confidence On The Rise – Consumer Behavior

Two key measures of consumer confidence soared to levels not seen since 2000, helping to propel equities higher towards the end of the first quarter. Since consumer expenditures make up nearly 70% of Gross Domestic Production (GDP),growing confidence among consumers is viewed optimistically by economists.

A non-profit research group, The Conference Board, compiles and releases its Consumer Confidence Index each month, an indicator of consumer sentiment. In its most recent release, the Conference Board saw the largest increase in its index since December 2000. Another highly regarded index on consumer confidence is the Consumer Sentiment Index from the University of Michigan, which saw its largest increase in 17 years.

Sources: Commerce Department, University of Michigan, Conference Board


U.S. Tax Revenue – Fiscal Policy Review

With tax season upon us, the Federal government’s ability to tax comes into full force. The dynamics of tax revenue is a combination of economic prosperity, tax rates, and the existing population of taxpayers. Ongoing discussions surrounding tax rates have been a focus of how to increase tax revenue. However, the other two components include economic conditions and the number of individuals paying income taxes.

As new hires enter the workforce, either out of school or as immigrants, additional tax revenue is derived from their incomes. As economic conditions improve, companies may hire additional employees and eventually start to issue pay raises.

For the past 40 years federal tax receipts have increased an average of 6.76% each year, including year-over-year decreases in 1983, 2001, 2002, 2003, and 2009.

Sources: CBO, Tax Policy Center

45% of Americans Pay No Federal Income Tax – Fiscal Policy

Disparity of income has been a preponderate subject for politicians and activist groups for sometime, yet in the end, it’s those that earn the higher incomes that pay for the majority of taxes.

An estimated 77.5 million Americans, identified as households, pay no federal income tax. The non-partisan, non-profit tax group known as The Tax Policy Center released income tax data it analyzed for 2015 and found that nearly half, about 45.3% of American households, paid no federal income tax in 2015. The Tax Policy Center estimates that the percentage of Americans that will not pay income tax for tax year 2016 will drop slightly to 44.5%.

Generous tax credits and low tax brackets for low-income earners allow minimal to no federal tax payments. The Tax Policy Center did find that these lower income households did pay their share of state, local, property, sales, and excise taxes.

Federal tax data for 2014 and 2015 showed the top 1% of taxpayers subject to a higher effective tax rate, averaging about 23%, seven times higher than taxpayers in the bottom 50%.

The ultra wealthy, also know as the top 1% of taxpayers, with annual incomes of about $2 million, pay about 44% of all of the federal income taxes in the U.S.

Source: Tax Policy Center/Washington D.C.