Ocean Park Capital Management

2503 Main Street

Santa Monica, CA 90405

Main: 310.392.7300

Daily Performance Line:  310.281.8577

March 2018
Market Update
(all values as of 04.30.2025)

Stock Indices:

Dow Jones 40,669
S&P 500 5,569
Nasdaq 17,446

Bond Sector Yields:

2 Yr Treasury 3.60%
10 Yr Treasury 4.17%
10 Yr Municipal 3.36%
High Yield 7.69%

YTD Market Returns:

Dow Jones -4.41%
S&P 500 -5.31%
Nasdaq -9.65%
MSCI-EAFE 12.00%
MSCI-Europe 15.70%
MSCI-Pacific 5.80%
MSCI-Emg Mkt 4.40%
 
US Agg Bond 3.18%
US Corp Bond 2.27%
US Gov’t Bond 3.13%

Commodity Prices:

Gold 3,298
Silver 32.78
Oil (WTI) 58.22

Currencies:

Dollar / Euro 1.13
Dollar / Pound 1.34
Yen / Dollar 142.35
Canadian /Dollar 0.72

Fund Overview

Equities sustained broad single digit losses in March.  The Ocean Park funds also declined, but only fractionally.  As happened in February, the technology sector lost ground overall but our technology stocks posted a modest gain and helped us buck the trend.  For the year to date, we remained well ahead of all the major indices as well as the HFRI Equity Hedge Total Index, which was up 0.71% through March.

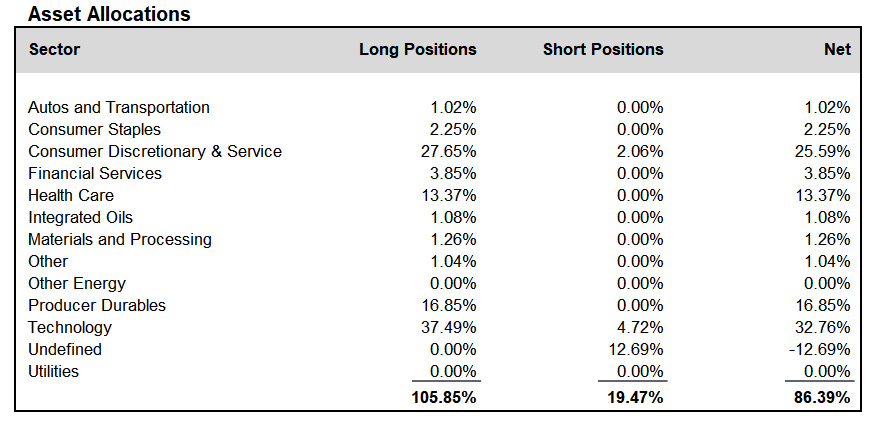
During the month, we added to positions in the health care sector and reduced positions in the consumer discretionary and service sector. We finished the month at about 86% net long, down from about 89% at the end of February.

A schedule showing the performance of the Investors Fund is included below, along with our Asset Allocation Chart. Daily updates on our activity are available on our Results Line, at
310-281-8577, and current information is also maintained on our website at www.oceanparkcapital.com. To gain access to the site enter password opcap.


*These results are pro forma. Actual results for most investors will vary. See additional disclosures on page 4. Past performance does not guarantee future results.

 
Equity Overview - March 2018

Equity Overview

Volatility continued in March, as 7 of 21 trading days saw gains or losses of more than 1% in the S&P 500, with several days in excess of 2%.  When added to the volatility in January and February, this meant that the first quarter of 2018 was among the most volatile in the past 25 years–as contrasted with every quarter of 2017, which was among the least volatile.

Continuing the trend, investors favored growth over value stocks, and stocks in companies with positive earnings surprises did well.  But all sectors retreated except for real estate, utilities, and energy.  The FAANG stocks (Facebook, Amazon, Apple, Netflix, and Google) all lost ground.

Although stock prices have come down, consensus earnings estimates for the S&P 500 over the next year have risen as analysts have calculated the impact of the corporate tax cuts and a strengthening economy on company profits.  Thus stocks are more reasonably valued, as the forward price earnings ratio of the S&P 500, which had been a somewhat extended multiple of 19, is now closer to its historical mean of 15.


Macro Overview - March 2018

Macro Overview

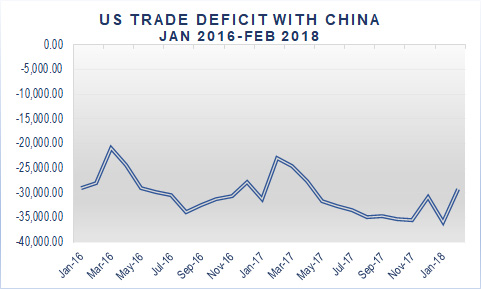
The administration continued its aggressive trade policy, announcing an additional $60-billion in tariffs on Chinese imports.  China immediately threatened to retaliate with tariffs on a wide range of American products.  The real prospect of a trade war unsettled the stock market and contributed to the unusual volatility.

Nonetheless, economic statistics in March were generally positive.  Manufacturing was strong, as was employment.

After much drama, Congress avoided a shutdown and passed an omnibus $1.3-trillion spending bill which funds the government through September.  After a brief interlude during which the president contemplated a veto, he ultimately signed it into law.

In its first meeting since Jerome Powell became chairman, the Fed, as expected, raised the funds rate by 0.25% to a target of 1.50% to 1.75%.  They stated that “the economic outlook has strengthened in recent months,” and raised their forecast for 2018 GDP growth from 2.5%  to 2.7%.  The market anticipates at least two more interest rate increases this year.


Additional Disclosures - March 2018

Additional Disclosures

Performance data for OPI reflect the reinvestment of dividends and other earnings on the fund’s assets.  Performance data for the major indices reflect only changes in the value of those indices, and would be higher if dividends were included. However, the index data do not reflect fees that would be paid to index fund managers and transaction costs that would be incurred when their component stocks are bought or sold, while OPI’s data do reflect quarterly fees and expenses incurred by the fund.  The information provided is believed to be reliable, but its accuracy or completeness is not warranted. This material is not intended as an offer or solicitation for the purchase or sale of any stock, bond, mutual fund, or any other financial instrument. The views and strategies discussed herein may not be appropriate and/or suitable for all investors. This material is meant solely for informational purposes, and is not intended to suffice as any type of accounting, legal, tax, or estate planning advice. Any and all forecasts mentioned are for illustrative purposes only and should not be interpreted as investment recommendations.