Market Commentary & Investment Perspective April 2018
Market Update
(all values as of 04.30.2025)

Stock Indices:

Dow Jones 40,669
S&P 500 5,569
Nasdaq 17,446

Bond Sector Yields:

2 Yr Treasury 3.60%
10 Yr Treasury 4.17%
10 Yr Municipal 3.36%
High Yield 7.69%

YTD Market Returns:

Dow Jones -4.41%
S&P 500 -5.31%
Nasdaq -9.65%
MSCI-EAFE 12.00%
MSCI-Europe 15.70%
MSCI-Pacific 5.80%
MSCI-Emg Mkt 4.40%
 
US Agg Bond 3.18%
US Corp Bond 2.27%
US Gov’t Bond 3.13%

Commodity Prices:

Gold 3,298
Silver 32.78
Oil (WTI) 58.22

Currencies:

Dollar / Euro 1.13
Dollar / Pound 1.34
Yen / Dollar 142.35
Canadian /Dollar 0.72

Macro Overview

Markets were rattled in March as a looming trade war between China and the U.S. enhanced market volatility. The administration announced $60 billion in tariffs for Chinese imports, with a detailed list of products which will be identified by the Commerce Department in April. China threatened to retaliate by imposing tariffs on U.S. imports as well as curbing U.S. Treasury purchases.

Intricate supply chains have evolved between the United States and China over the past twenty years. Some U.S. manufacturers ship U.S. made components to China for final assembly, then ship finished products back into the U.S., thus posing a challenge as to how trade deficits are calculated.

Key economic data released over the past month revealed that key data points were the strongest reported since 1998. The market has become much more dependent on data as it looks for signs of inflation and rising rates. Various analysts view current market volatility primarily driven by non-systemic events and isolated to specific events and individual company news.

A key lending benchmark, the Libor, has been rising steadily. The three-month U.S. dollar Libor rate surpassed 2% in early March, the highest level since 2008. Based in London, the Libor affects U.S. consumer loans, commercial loans, and adjustable rate mortgages.

Rapidly rising mortgage rates are dampening the hopes of families eager to lock in rates before payments start to become too expensive. The continued lack of housing supplies has added a double cost factor to the market, with prices elevating due to tight supplies and rising mortgage rates.
The International Energy Association (IEA) projects that the United States is on track to become the worlds single largest oil producer by 2023. The estimates are based on production growth and supplies generated by U.S. energy producers over the next few years. U.S. daily oil production alone is expected to reach over 12 million barrels per day by 2023, a 20% increase from the current levels of 10 million barrels per day.

Congress reached a $1.3 trillion budget deal that will fund the federal government through September. The extensive 2,232 page bill averts a government shut down and funds special programs for child care, infrastructure, medical research, opioid abuse prevention, and national security. The IRS audited roughly 0.05% (half of one percent) of the 195,614,161 returns filed for tax year 2016. The number of examinations, also know as audits, was higher in the mid 1990s, when about 1.7% of returns were audited.     Sources: Dept. of Commerce, Bloomberg, congress.gov


Over 25% of the S&P 500 Index is currently comprised of technology sector stocks

Tech & Tariff Influenced Volatility – Equity Update

Technology stocks led volatility in the first quarter, pulling other sectors into trading frenzies. Over 25% of the S&P 500 Index is currently comprised of technology stocks, having added volatility to the index for the first quarter. Trade war rhetoric added to volatility as U.S. companies sensitive to higher import prices on raw materials and certain finished goods experienced pullbacks.

Companies in the technology sector faltered as privacy concerns drove social media shares lower. The technology sector has also became more prone to volatility leading to gyrating valuations. In addition, news of heightened regulatory rules for technology and social media related companies escalated a sell off heading into the second quarter.

Transportation stocks are rising more closely with the rest of the market, an optimistic signal according to the century old Dow Theory.

Sources: Dow Jones, S&P, Bloomberg

World’s Largest Consumer Markets – Global Commerce

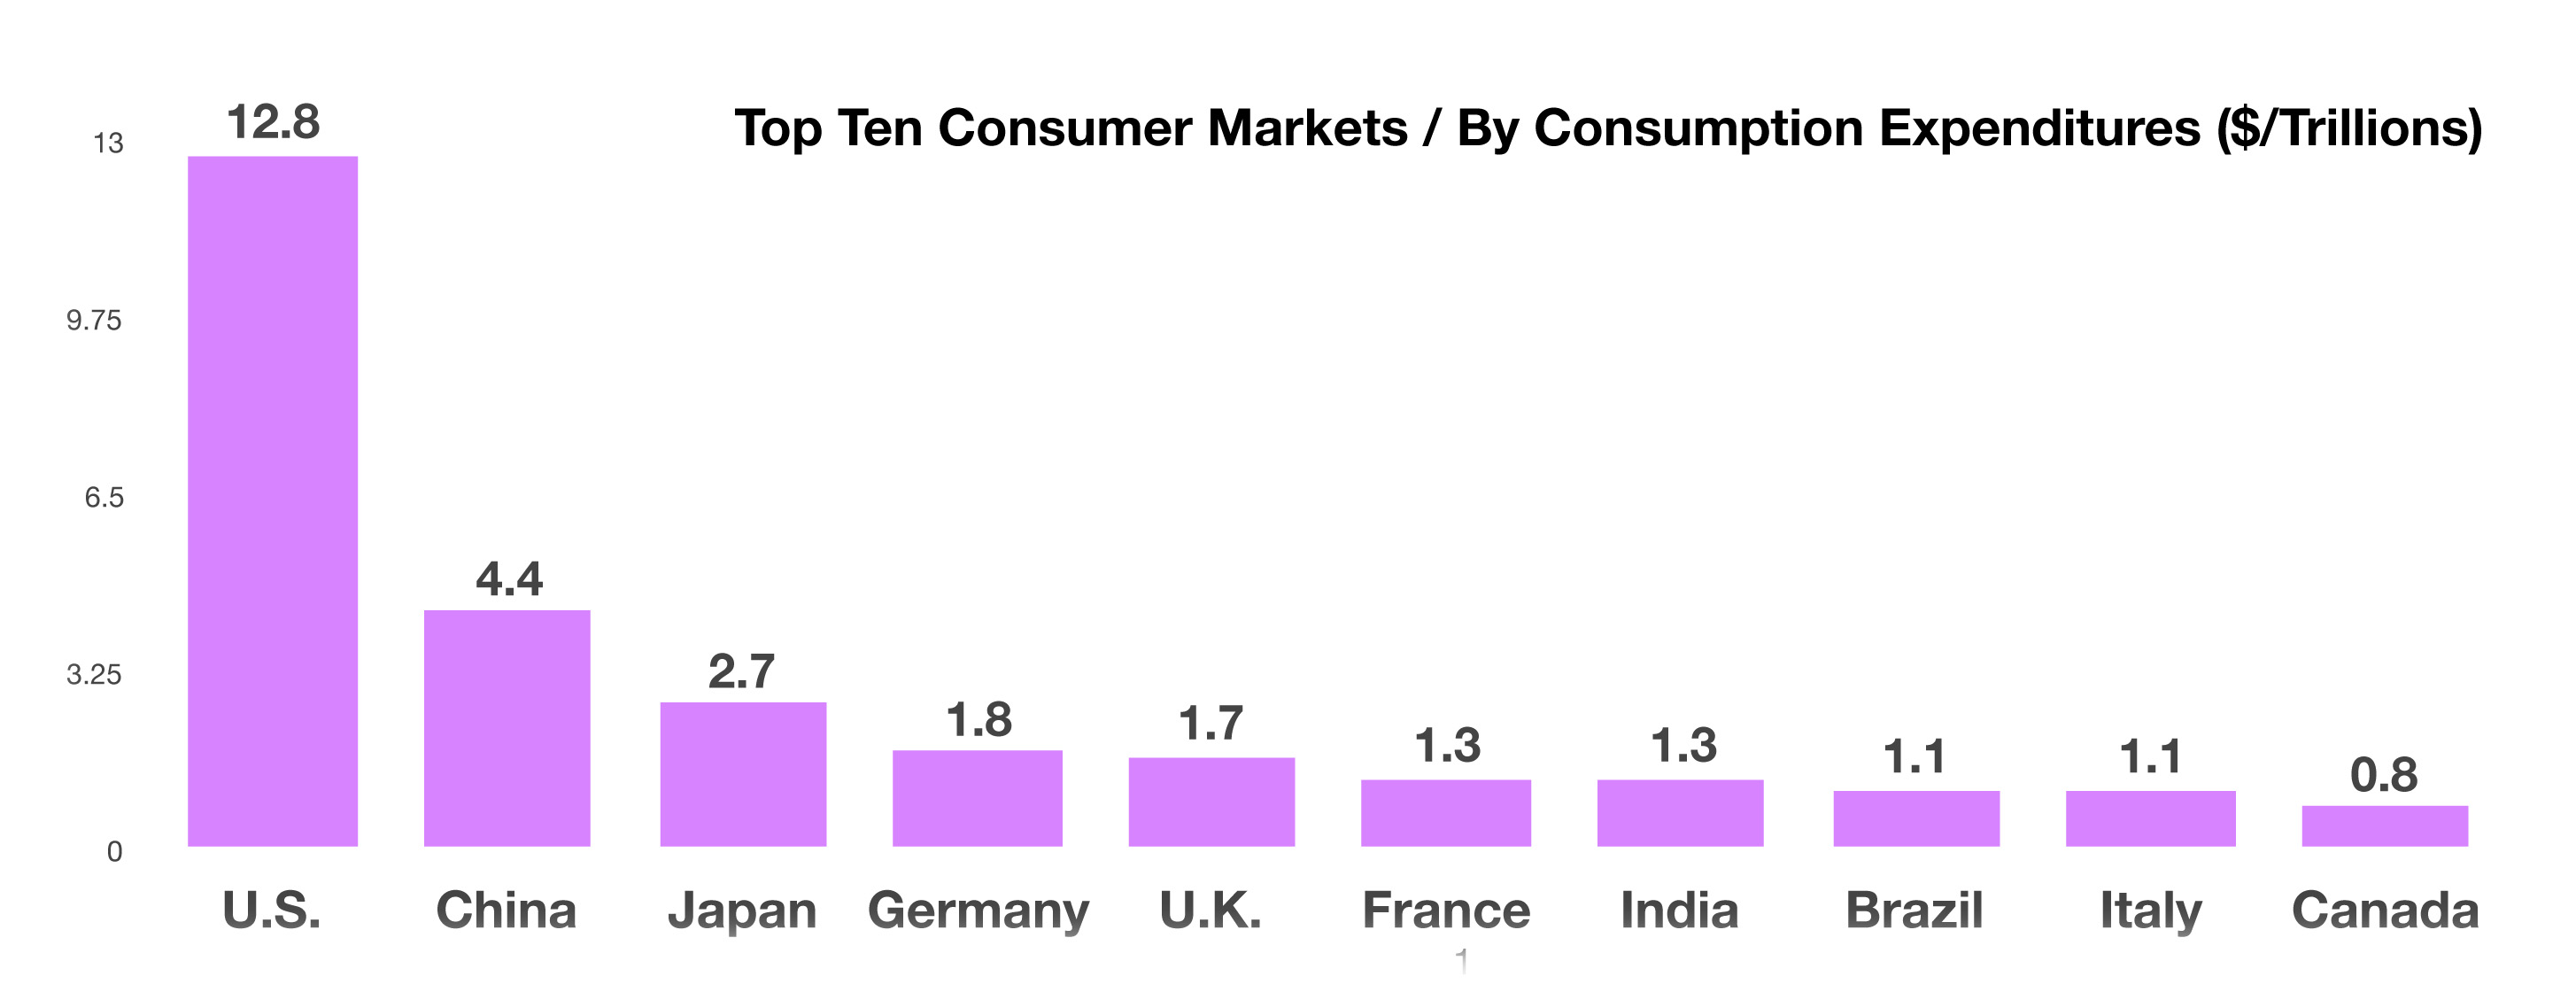
The United States by far has the single largest consumer market of any country worldwide, representing over 26% of the entire global consumer market. U.S. consumers spent over $12.5 trillion in 2017, nearly three times as much as the second largest consumer market, China. China’s consumer market is currently one of the world’s fastest growing markets, with nearly $4.5 trillion in consumer expenditures.

International companies selling to the U.S. marketplace are attracted to the enormous wealth that consumers have access to in the United States. Ample and readily accessible credit sources in the U.S. also allow consumers the ability to purchase a wide variety of products.

Emerging market economies such as India and Brazil not only have a growing consumer market, but also benefit from exports to the U.S. Whereas, developed economies such as Japan and Germany have shrinking consumer markets yet depend heavily on exports to the United States.

Demographics has been a driving force in the U.S., as baby boomers provided an enormous amount of activity among various sectors and industries for decades. Now, as baby boomers retire and exit their prime spending years, it is up to younger consumers to create and replace much of the wealth needed to maintain consumption expenditures.

Sources: World Bank Group, United Nations Statistics Division

 
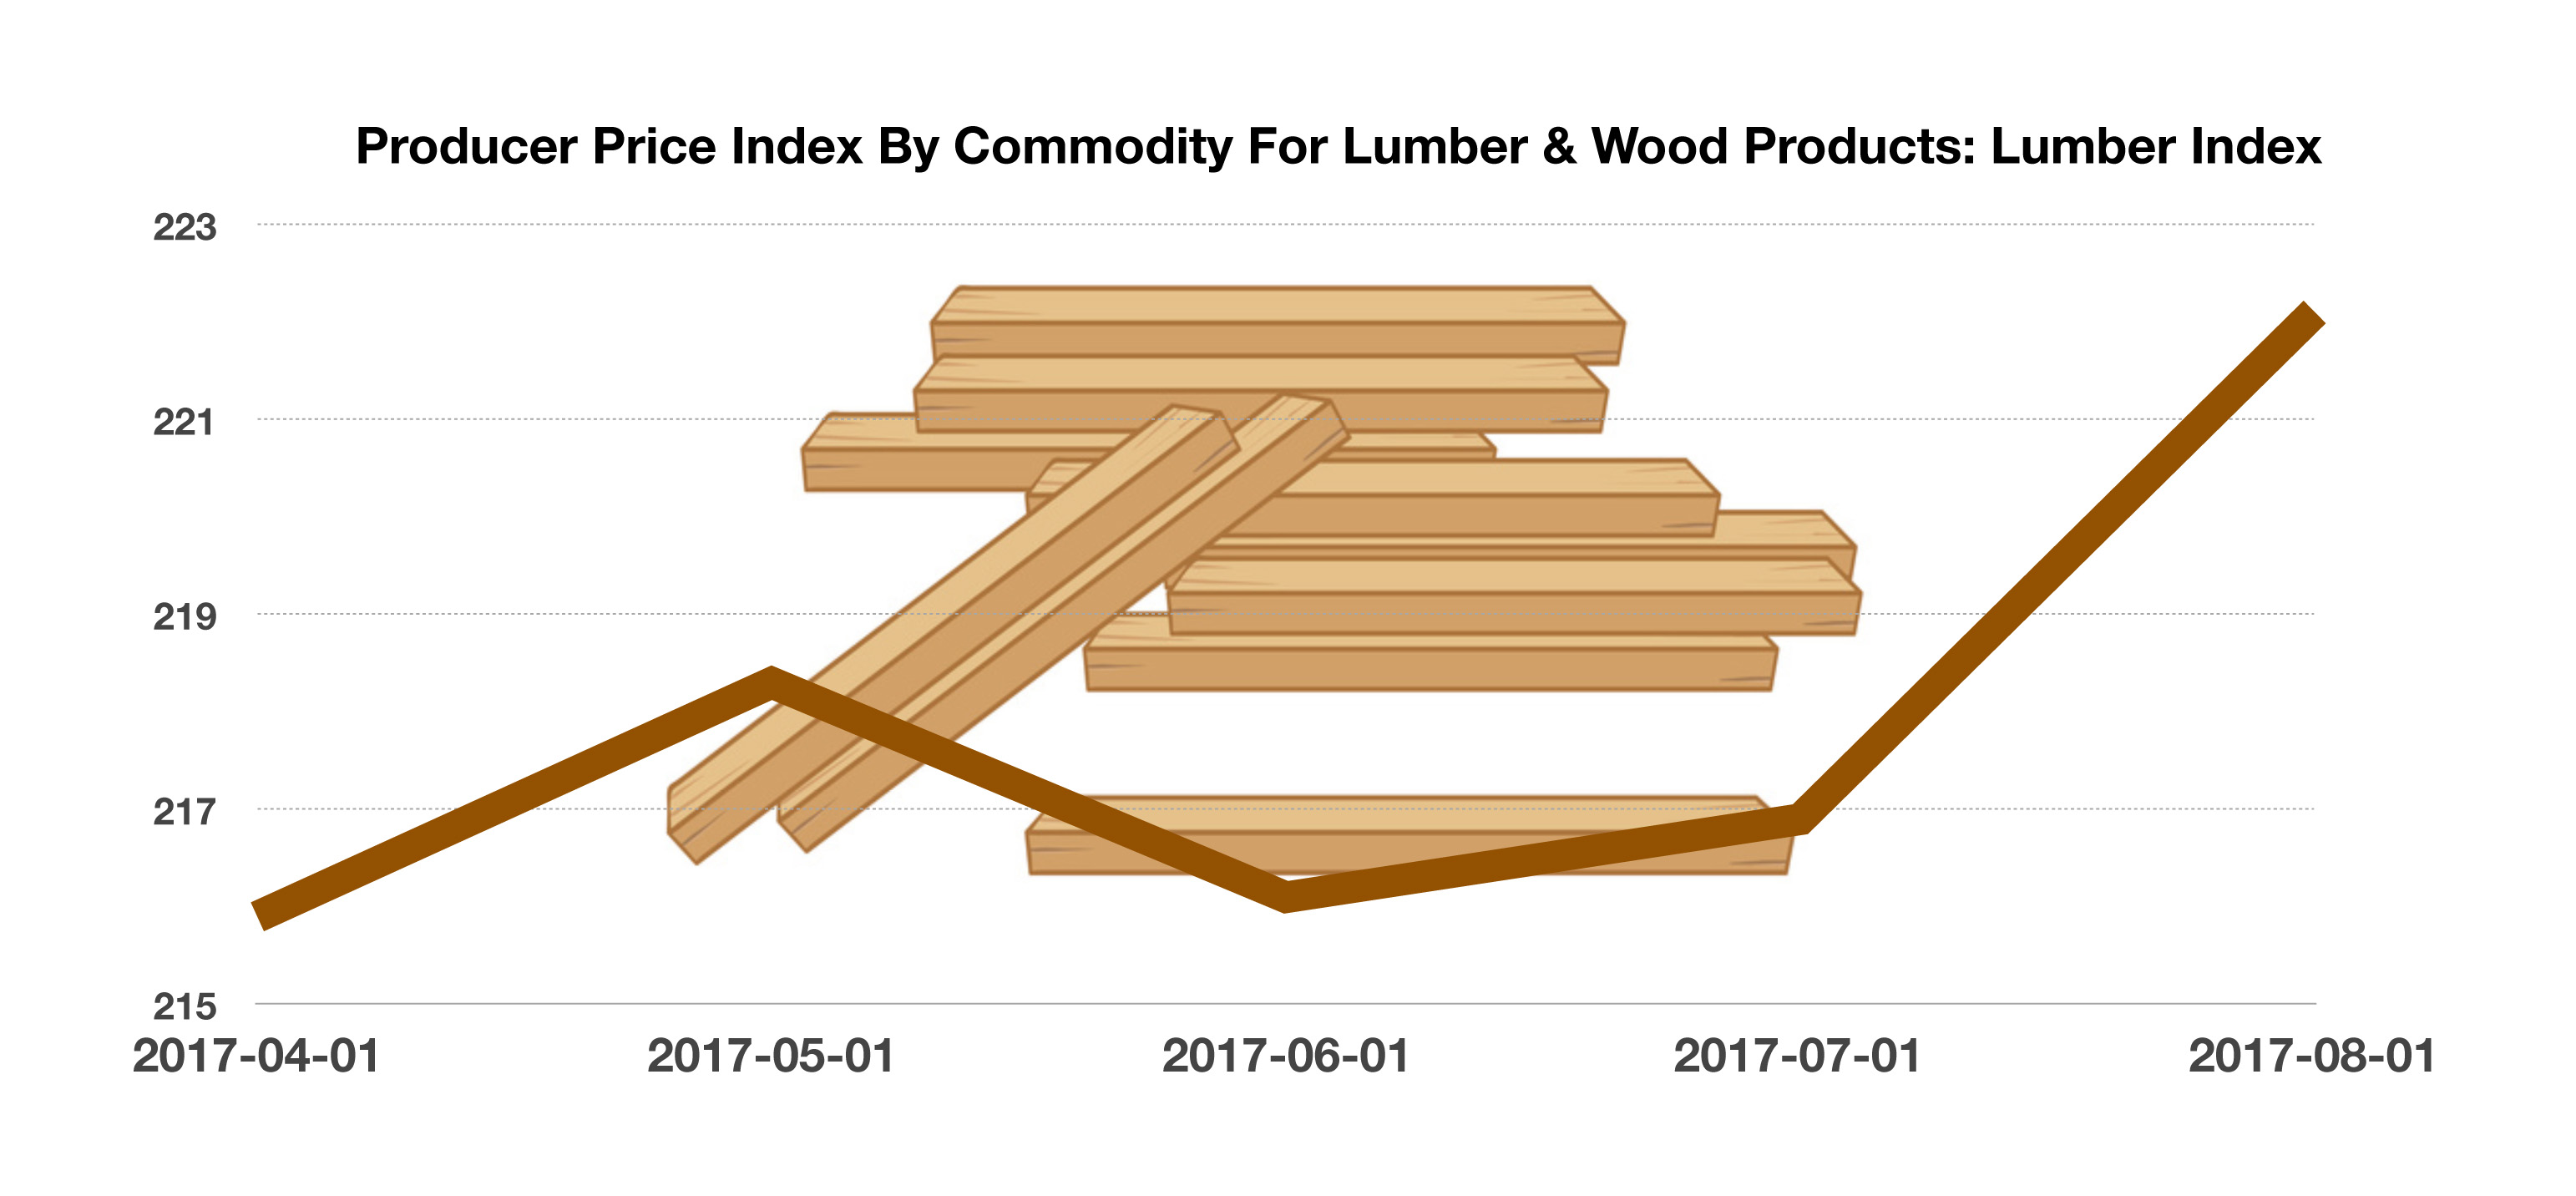
A key leading rate, the Libor, rose the most in 10 years.


The Significance of the Transportation Index – Historical Note

The Dow Jones Transportation Index is a historical index that dates back to 1884. It is comprised of leading bellwether transportation stocks in the trucking and delivery sector, domestic airlines, as well as companies in the railroad sector.

As a leading indicator of economic growth, these strong gains in the index are often a good sign for the U.S. economy, especially in periods when energy prices are high or increasing as well. The biggest risk to these strong gains is most likely a pullback in consumer spending activity, which would negatively affect shipping and logistics demand. Consumer confidence, manufacturing activity, and strong corporate earnings are all factors to watch to see if these gains in transportation related stocks are sustainable.

The returns of the industry components within the index are also worth watching for potential distortions that may mislead index followers. For example, the airline sector is up strongly this year, increasing approximately 34% due to strong industry profitability from recent airline mergers and restructurings as well as increased passenger traffic data. The railroads component is up nearly 10% YTD as growth in general merchandise, chemicals, and oil freight more than offset declines in coal shipments. The courier and trucking components have increased less than the index average and their contribution to the index gains have been minimal.

The Transportation index is also one of the underpinnings of the Dow Theory of stock price movements. This technical theory states that a major trend in the stock market must be confirmed by the simultaneous movement of the Dow Jones Industrial Average and, the Dow Jones Transportation Average to new highs or lows.

Source: Dow Jones

Rates Stabilized In March – Fixed Income Overview

Equity market volatility in March drove assets towards various sectors of the bond market, thus pushing yields slightly lower and various fixed income prices higher.

A key leading rate, the Libor, rose the most in 10 years. Debt reliant companies and consumers with variable rate loans tied to the Libor are most susceptible. The three month Libor rate rose to 2.31% at the end of the quarter. The six-month Treasury bill reached a yield of 1.88% in early March, an important yield because that’s exactly what the S&P 500 Index yields. Some income seeking investors may begin to view short-term bonds as an attractive alternative to dividend paying stocks prone to market volatility.

The Federal Reserve decided to raise the Fed Funds rate to a range of 1.5 – 1.75%, on track for another three rate increases this year. Language from the Fed Chief Jerome Powell shed some optimism on economic activity, noting that “the economic outlook has strengthened in recent months”, warranting further increases in the Fed Funds rate. (Sources: Federal Reserve, Bloomberg)

The 10-year US Treasury is over 3% at the time of this post (April 25), leading to equity market volatility – a routine push/pull correction process seen in late market cycles.

 
The Three Big Things : Looking Ahead

Looking Ahead
In the U.S. in January ’18, we saw the Fed continuing to tighten, hints of a trade war and technology regulation. If that sounds familiar, it should!  Remember January ’17?  Our response remains the same…”Wait and see”.  So far, we have only some irregular indications of the correction we’ve been anticipating for a very long time.

We remain late in the profit and market cycles.  If interest rates are going to be “normalized” by the Fed, the strong economy and bull market have made the timing idyllic.  This has caused elongation of the cycle.  (Sources: Richard Bernstein Advisors, LLC) Credit and Libor spreads have been widening (Sources:  Bloomberg, Natixis Distribution L.P.) and the market is trading in about a 10% range. (Sources: Dow Jones, Bloomberg.com)  We continue to monitor Corporate Profits and will take a more defensive position if we see negative quarterly profits or an inverted yield curve. (Sources:  Statista.com, Bureau of Economic Analysis)

At this time, we believe the good outweighs the bad.

KCG favors Cyclicals including Tech, Financials and Commodities and we are closely watching Energy and Industrials for a positive trend to exploit.  Tech is taking a hit because of recent news events about cyber security.  The consequences will apparently be new regulations.  Some have expressed surprise that Facebook’s Mark Zuckerberg seemed content to submit to any new regulation, but when you think about it, it is really not surprising.  Facebook, Twitter, and Google can afford new regulations, but new companies, starting in their garage like Zuckerberg did, will no longer stand a change against the FANG behemoths.  They simply won’t be able to afford to comply.  That said, I believe you will see FANG stocks continue to appreciate from this point, perhaps a more slowly.

Profits
While inflation is bad news for preferred stocks, real estate and interest-sensitive sectors, it’s great for earnings! 1Q18 earnings are expected to be in the high teens to low 20%.  10-12% of that growth is organic – ex the impact from our new tax law.  With rising earnings, P/E’s become more reasonable and valuations look Fair, extending the cycle still further. (Source:  Steve Parker JP Morgan Private Bank, CNBC)

Liquidity
It appears we are in an inflationary transition, moving from a very long period of disinflation/deflation, into a period of insipient inflation.  While Consumers and Investors alike (not to mention the US government) have become reliant upon the effects of artificially low interest rates, the US Treasury needs to sell a lot more bonds to “normalize”. Thus, KCG’s bias toward Cyclicals which benefit from nominal rather than real growth.

Sentiment
I
nvested dollars seem to be nervous.  Investors who have made a lot over the last 12 months, have now seen three 5%+ pull-backs since February.  Investors are giving in to the impulse to “FIRE-AIM-READY”‘!, leading to more volatility with each news cycle.

KCG has identified specific indicators to monitor for a Bear market, and we are re-focusing on the fundamentals instead of each geopolitical skirmish.  Fundamentals are still good, and we are in it for the long game. 

Participate and Protect.