AIS April 2019 Fixed Income Newsletter
Market Update
(all values as of 06.28.2024)

Stock Indices:

Dow Jones 39,118
S&P 500 5,460
Nasdaq 17,732

Bond Sector Yields:

2 Yr Treasury 4.71%
10 Yr Treasury 4.36%
10 Yr Municipal 2.86%
High Yield 7.58%

YTD Market Returns:

Dow Jones 3.79%
S&P 500 14.48%
Nasdaq 18.13%
MSCI-EAFE 3.51%
MSCI-Europe 3.72%
MSCI-Pacific 3.05%
MSCI-Emg Mkt 6.11%
 
US Agg Bond -0.71%
US Corp Bond -0.49%
US Gov’t Bond -0.68%

Commodity Prices:

Gold 2,336
Silver 29.43
Oil (WTI) 81.46

Currencies:

Dollar / Euro 1.06
Dollar / Pound 1.26
Yen / Dollar 160.56
Canadian /Dollar 0.73

Macro Overview

A change in the Federal Reserve’s stance on the direction of interest rates helped buoy equity and bond prices higher in March, allowing U.S. equity indices to post the strongest first quarter in nearly ten years.

The Federal Reserve scaled back its growth expectations for the U.S. economy and announced that it would hold rates steady with no additional rate increases this year. Economists interpreted the comments as a somber assessment of economic expansion, yet positively received by the equity and fixed income markets. The Fed mentioned trade disputes, slowing growth in China and Europe, and possible spillovers from Britain’s exit from the European Union were factors.

Short-term bond yields rose above longer term bond yields in March creating what is known in the fixed income sector as an inverted yield curve. Normally, short-term yields are lower than longer term yields, resulting in a normal yield curve. A persistent inverted yield curve would become more concerning should it linger for several quarters.

Concerns surrounding economic momentum in Europe became more prevalent as Europe’s central bank, the ECB, signaled that it would maintain interest rates below zero longer than anticipated. Slower growth in both exports and imports have been implying a slowdown throughout the EU, which is comprised of 28 European countries. The pending outcome on how and when Britain finally exits the EU is also adding duress to Britain’s trading and business partners all over Europe.

Chinese government data revealed that exports heading to other countries worldwide fell over 20% in the past year. Data also showed that imports had fallen into China, realizing that Chinese consumers were scaling back demand from prior months.

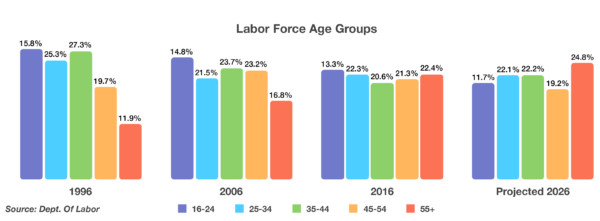
Congressional leaders are considering legislation that would repeal the current age cap of 70.5 for contributing to IRAs as well as increase the required minimum distribution age for retirement accounts from 70.5 to 72. Such legislation, if passed, would be the most significant change to retirement plans since 2006. (Sources: Federal Reserve, Dept. of Labor, IRS, Treasury Dept., ECB)

Lower Rate Outlook & Trade Talks Elevate Stocks In First Quarter – Equity Overview

Optimism over progress on U.S. trade discussions with China seemed to overshadow concerns about a slowing economic expansion helping to propel equity indices towards the end of the third quarter.

Gains were broad for the S&P 500 Index with all 11 sectors ending higher for the first quarter, which has not occurred since 2014. Technology and energy stocks were among the best performing sectors for the quarter, encompassing a broad scope of industries and companies. A counterintuitive environment has driven stocks higher while the bond market is signaling slower growth. Some analysts are expecting a slowdown in corporate earnings growth as global demand projections have been trimmed. (Sources: S&P, Bloomberg, Reuters)


FIXED INCOME UPDATE - INTEREST RATES

Inverted Yield Curve Puts Rates On Hold – Fixed Income Overview

The yield on the 10-year treasury fell to 2.41% at the end of March, down from its peak yield of 3.25% in October 2018. The Fed’s shift from a tightening mode to a hold mode is interpreted by some economists and analysts as a lack of confidence in economic growth.

Treasury yields inverted further as the 6-month treasury note yielded more than the 7-year treasury bond in March. Inverted yields mean that shorter term rates are higher than longer term rates, translated by markets as minimal economic expansion and inflation expectations.

A sustained inversion becomes more concerning should it linger for several quarters. Some are even expecting a rate cut later in the year, if not in 2020, should economic data shed dismal projections.

Negative yields on some European government bonds reflect minimal growth expectations with subdued inflation throughout the EU. An inverted yield curve in the U.S. may partially be the result of slowing economic expectations in Europe and internationally.

The yield curve has been fairly flat over the past few months, meaning that the yield on shorter term bonds have been similar to the yield on longer term bonds. This dynamic created some uncertainty for the Fed, making it difficult to determine whether to raise rates or keep them the same.

Many believe that a divergence between stock prices and bond yields has evolved, where bond prices have risen concurrently with stock prices. Stocks historically head lower when bonds prices head higher in anticipation of slowing economic activity or lingering uncertainty. (Sources: Eurostat, Treasury Dept., Federal Reserve)

For decades the relationship between interest rates, the economy and stock prices held to predictable cycles and gave investors a relatively accurate picture of future economic direction.  In the not so distant past, capital markets were still operating with at least a modicum of freedom and economic cycles tended to run their normal course with government intervention for the most part being limited to tax policy and interest rate manipulation by the central banks.  That ended in 2008 as the financial crisis ushered in a new level of financial engineering by central banks which has turned economic principle and theory on it’s head leaving most investors bewildered.  In the last decade we have seen central banks use tools that would have seemed like true “voodoo economics” from  artificially low interest rates, bail-outs, forced restructurings (basically throwing out centuries old case law) and massive central bank balance sheet blow ups buying securities in the open market to “support” prices to the more ridiculous like cars for clunkers and mortgage modifications.


The Fed itself seemingly has no idea what to do, acting erratically moving in a matter of months from forecasting multiple interest raises to neutral and even possible rate cuts by 2020.  The bond market has historically been the best predictor of the financial health of the economy and for the first time in my career even the “bond gods” seem completely confused changing forecast seemingly every month.  The point is, prediction is a fools game at this point and even the smartest, most sophisticated investors have continuously been wrong when trying to interpret the bogus data being produced by this financial engineering experiment.  One need only look at the performance of most hedge funds for the last decade as some of the supposedly best and smartest funds have significantly underperformed the major indexes.


FIXED INCOME UPDATE - GLOBAL DEBT BUBBLE

GLOBAL DEBT

We have written extensively about the global debt bubble that is now over 10 years in the making and has reached historic levels across nearly every sector of debt from governments all the way down to the individual household.  Bloomberg reported in January that global debt has now reached an astounding $244 trillion.  In ancient Greece the largest number that had a name was 10,000 and for most of us talking about trillions seems unfathomable.  Well folks get ready for the new numerical scale that you will now have to wrap your head around – QUADRILLION.  Yes we now have one quarter of a quadrillion in global debt and at the rate debt is increasing in 20 years we will certainly be talking about $1 quadrillion in global debt.  Of course things could change, society could reach it’s senses  and decide to reverse the trend or more likely we will have a financial crisis which will reset this back to comprehendible levels but either way it will mean extreme pain for investors.

The table below shows the makeup of this enormous debt burden (numbers are in trillions).

Q4 2007 Q3 2017 Q3 2018 YOY Change Change Since Crisis
Household Debt $33 $44.2 $46.1 + $1.9 + $13.1
Corporate Debt $38 $68.6 $72.9 + $4.3 + $34.9
Government Debt $33 $63.5 $65.2 + $1.7 + $32.2
Financial Sector Debt $37 $58.8 $60 + $1.2 + $33
Total $142 $235.1 $244.2 + $9.1 + $113.2

There is now $113 trillion more in global debt than  in 2007 when the credit crisis of a “lifetime” was unfolding.   The last credit crisis was triggered by the poor lending standards and fraudulent loans made to unworthy borrowers made possible the securitization process, government interference in free market and institutional investors incessant appetite for yield and risk. If this sounds even vaguely familiar it should because it is exactly what has happened in the corporate bond market over the last decade. Corporate debt has nearly doubled since the last crisis to an astounding $72.8 trillion due to artificially low interest rates designed to spur an ailing economy which have once again sent institutions chasing yield with a complete disregard for risk. Poorly run corporations on the lowest rung of the credit ladder have had no problem continuously financing their money losing enterprises and are now termed Zombie Corporations because were it not for their ability continuously issue debt at artificially low levels they would have long ago been bankrupt.  Once again the institutional investors in their never-ending chase for yield have completely disregarded the risk by purchasing this shaky debt in the ballooning junk bond and securitized CLO markets.

We would direct investors to our previous newsletters and our website where we have discussed these topics and markets in more detail but it should be clear that this is unsustainable and one of the major reasons the Fed has it’s back against the wall when raising interest rates (tightening credit).  If credit tightens too much it will send a shock wave through the high yield and levered loan markets and force a tsunami of corporate defaults.  On the next page we will discuss credit spreads and why in the face of this massive debt bubble investors should be wary of chasing yield.


NEXT PAGE: THE DEBT BUBBLE AND CREDIT SPREADS


FIXED INCOME UPDATE - THE CREDIT BUBLE AND CREDIT SPREADS

Regular newsletter readers will certainly recognize the graph below which shows the spread (risk premium) investors are receiving on both high-yield (HY) and investment grade (IG) debt over the last 5 years.  Remember the “spread” is the premium over the risk-free rate investors receive for taking the default risk in a non-government issued bond (in this case corporate bonds). 
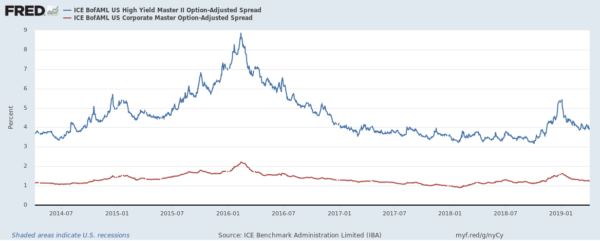
The red line represents the spread on IG bonds and the blue line is the spread for HY bonds. First, it should be clear that IG bonds are significantly more stable than HY bonds as the risk premium has remained between just below 1% to just over 2% in 2016 when the sub $30 oil “crisis” caught investors off guard.  During this short spike in volatility and spreads IG bonds moved wider by approximately 50 basis points, however HY spreads moved a whopping 300 basis points. To put this in dollar loss terms, an investor with $1 million of IG bonds would have seen a price decline of approximately 4 points for a loss of $40,000.  That same $1 million invested in HY bonds would have seen a price decline of approximately 23 points for a loss of around $230,000.  At least in 2016 the spread differential between IG and HY bonds prior to this spike was approximately 450 basis points meaning investors in HY bonds were receiving ~4.5% more for taking risk than IG investors which certainly helps reduce the pain and given enough time (and assuming you didn’t own bonds that defaulted) would help narrow the nearly 4 times greater loss suffered by HY bond investors.

As the chart illustrates, beginning in Feb 2016 both IG and HY spreads began a steady decline which lasted until late 2018 at which point we reached one of the tightest risk premiums between IG and HY bonds in history as the risk premium between IG and HY bonds decreased to under 225 basis points.  At that time we pointed out that investors in HY investors were not being rewarded for taking a massive amount of risk.  Over the last 20 years this spread has averaged over 500 basis points and we pointed out that once again investors were throwing caution to the wind and taking an inordinate amount of price volatility risk for a very small reward.  The 4th quarter of 2018 brought  the return of volatility in the markets for the first time in nearly 3 years and while it might have been painful for investors to see 10-15% moves in stocks, in the big scheme of things this was not a massive event.  But even during this relatively tame and shot lived volatility event IG spreads only moved about 60 basis points while HY spreads widened approximately 200 basis points or about 3.5  times (resulting in a 3.5 times larger price decline).

Volatility has once again begun to fall in 2019.  As you can see in the chart  spreads have once again been grinding tighter with IG spreads moving approximately 30 basis points tighter and HY spreads about 100 basis points.  The chart shows a 5 year average and 4th quarter spike may look relatively muted the reality was far worse than the chart would indicate – there were many days in November and December 2018 were liquidity was non-existent and forced sellers were receiving bids in some cases that were several points below where the same bonds may have traded the previous day.  This created some amazing opportunities for astute investors with cash to spend to pick up bonds at bargain basement prices which has since increased significantly in value.

For a little more perspective on the risk involved in HY vs. IG, during the credit crisis HY spreads widened 0ver 2,000 basis points (20%) and IG bonds moved widened about 500 basis points (5%).


NEXT PAGE: DEBT AND CREDIT WRAP UP

 
FIXED INCOME UPDATE - DEBT AND CREDIT WRAP UP

If we tie together the previous pages information on global debt levels and historically tight credit spreads we hope it is obvious to even novice investors that taking excessive credit risk in today’s market is very likely a losing proposition.  Sure, you might clip an extra 2-3% by purchasing HY bonds today and it may last several more years as the fed continues to manipulate the capital markets but at some point the fiddler will be paid.  The extra $20k-$30k pick up in interest per $1 million invested will not come close to offsetting the probable massive price declines we will see in the not so distant future.  There is a massive tsunami of debt coming due over the next 2-4 years with much of that debt being HY or low IG.  We previously wrote that “Today’s IG is not your fathers IG” meaning that much of the low rated IG paper has been issued by borrowers that are barely hanging on to their IG rating – the makeup of today’s debt market looks nothing like it did 20 years ago as a record amount of the IG paper is rated very low IG.  When (not if) this paper gets ultimately downgraded to junk it will trigger massive selling among institutional investors that have strict guidelines and limits as to how much HY paper they can own and we predict it will be a bloodbath of epic proportions.  The combination of overall record breaking levels of global debt combined with the deterioration in the quality of the debt will mean a massive decline in liquidity and a spread widening that could rival the credit crisis but instead of it being mortgage bonds triggering the crisis it will be corporate bonds.

At this point in the interest of filling the rest of this page and add some comic relief we thought we would re-visit our old friend below:

As the old saying goes:

PIGS GET FAT AND HOGS GET SLAUGHTERED – DON’T BE THIS GUY!


TAX NEWS & WORKFORCE

IRS Gives Taxpayers A Break On Penalties – Tax Planning

The IRS issued some reprise resulting from underpayment on withholdings for 2018 taxes.

Penalties have been waived for taxpayers in the past that underpaid on their taxes by no more than 90%. The IRS has lowered the threshold to 80%. The modifications enacted by the IRS is expected to reduce the number of taxpayers subject to penalties by 25% to 30%. Taxpayers that have already filed their returns are still eligible for a waived penalty by filing Form 843.

Updated federal tax withholding tables released in early 2018 largely reflect lower tax rates and increased standard deductions passed under the new tax laws. This generally meant that taxpayers had less withheld in 2018 and saw more in their net paychecks. The problem arose when withholding tables couldn’t fully factor in other changes such as suspension of dependency exceptions and reduced itemized deductions.

As a result some taxpayers ended up paying too little during the tax year, failing to revise their W-4 withholdings to include larger tax payments. This is where the penalties have primarily been imposed.

Because the U.S. tax system is a pay-as-you-go system, taxpayers are required by law to pay most of their taxes during the year rather than waiting until the end of year. This can be done by either having taxes withheld from paychecks or by making estimated tax payments on a quarterly basis. Sources:www.irs.gov/newsroom/irs-waives-penalty

Workforce Getting Older – Labor Demographics

Demographics drive the domestic labor force, propelled by both young and unskilled workers to older more seasoned individuals. For decades, the baby boom generation commanded the nation’s workforce, representing the single largest age group to hold jobs across all industries and sectors. As those same workers have aged, a younger generation has assumed some of the gaps left by retiring boomers.

Over the years, Labor Department data found that those aged 16-24 have been making up a smaller portion of the workforce. The Department projects that by 2026, only 11.7% of the labor force will be comprised of 16-24 year olds, compared to 15.8% in 1996.  Workers aged 25-54 are expected to make up the bulk of workers, representing over 63% of the nation’s labor force, down from 72.3% in 1996.

Department of Labor data revealed that over a thirty year period, those aged 55 and older will encompass 24.8% of the labor force in 2026, a stark increase from 11.9% in 1996. As American workers have aged over the decades, longer life expectancy and healthy lifestyles have afforded many the ability to continue employment well into their 60s and 70s.

 
BREXIT UPDATE

BREXIT UPDATE

What Britain Leaving The EU Means – Brexit Overview Turbulent and politically charged challenges between the British government and Parliament have resulted in numerous failures to finally execute Britain’s departure from the EU, known as Brexit. The significance of Britain exiting the EU may eventually be substantial as other countries may decide to cast similar votes whether or not to leave the EU. Several of the existing members are anxiously awaiting the outcome of Brexit to determine how challenging both politically and economically it may be. As of the end of 2018, Britain represented roughly 13% of the EU’s total GDP, ranking second in terms of GDP after Germany. The EU (European Union) was established following the end of WW II in order to offer financial and structural stability for European countries. Since its establishment, the EU has grown to a membership of 28 countries, abiding by various rules and policies set forth by the EU Council. One of the responsibilities of member EU countries is to accept and honor immigrants and citizens from other EU countries as part of the human rights initiatives recognized by the EU. Immigration has been a topic of contention among various EU countries for some time. This was a decisive factor for Britain leaving the EU since its economy and cities have been inundated by foreign-born immigrants seeking jobs and a better quality of life. The markets have reacted negatively to the announcement, pushing down stocks, the British pound, and bond yields as investors seek the perceived stability of bonds while markets worldwide acclimate. Since Britain has been part of the EU since 1973, it is expected that the unraveling of British ties from the EU could take years. Contracts, employees, and laws will all have to be revised, reshuffled, and rewritten in order to accommodate the divorce between the two. Now that the British have decided on leaving the EU, many believe that another referendum could possibly be presented in France and other EU countries. The concern of a domino affect is very realistic, as several other EU members are experiencing similar frustrations as Britain. Expected effects in the U.S. include: Prolonged low interest rates More assets flowing into the U.S. from abroad U.S. companies altering European contracts Stronger U.S. dollar versus the British pound and euro Sources: EuroStat, EU Council, Europa.eu

 
SUMMARY AND CONCLUSIONS

As we have done since the inception of this newsletter in 2017 we continue to recommend investors avoid excessive risk.  The U.S. economy appears to be doing fine at the moment but that is almost always the case before the shoe drops.  The “melt-up” we have discussed in many past issues is a toss-up at this point and it is anybody’s guess as to whether we get a final large run-up in stocks that traditionally marks the end of bull markets.  As we stated, the unprecedented intervention by global banks has turned economic principles on their head and even the historically most successful investors are having a tough time navigating these markets.  There has been a return to the massive “short volatility” trade which should give investors some concern.

The flat (and in some cases inverted) yield curve means investors are not being rewarded for taking term (duration) risk and we are keeping our bond holdings far below the 6+ year duration of the Barclays Global Aggregate Bond Index.  Given the historically low credit spreads we are also keeping our credit risk at a minimum.  Smaller investors can still purchase blocks of $25k – $100k of short term IG bonds with yields well above 4% (and often much higher during these mini-volatility spikes).  In the 4th quarter we were able to purchase even some larger size high IG rated bonds with yields well above 5% and have positioned our portfolios with bonds that are heavy in front-end cash flow to enable us to take advantage of these situations as they occur.


We would like to thank our readers and hope you find the information both informative and useful.  We welcome all feedback and are always available to discuss the concepts in our newsletters or on our website.  If there is a fixed income topic you would like to have us cover please drop us a line and let us know and we will do our best to include it in a future issue.


Until then, try and avoid the land mines and happy investing.