Michael McCormick

5 West Mendenhall, Ste 202 | Bozeman, MT 59715

406.920.1682  mike@mccormickfinancialadvisors.com

Sustainable Income Planning | Investments | Retirement

April 2019
Market Update
(all values as of 06.28.2024)

Stock Indices:

Dow Jones 39,118
S&P 500 5,460
Nasdaq 17,732

Bond Sector Yields:

2 Yr Treasury 4.71%
10 Yr Treasury 4.36%
10 Yr Municipal 2.86%
High Yield 7.58%

YTD Market Returns:

Dow Jones 3.79%
S&P 500 14.48%
Nasdaq 18.13%
MSCI-EAFE 3.51%
MSCI-Europe 3.72%
MSCI-Pacific 3.05%
MSCI-Emg Mkt 6.11%
 
US Agg Bond -0.71%
US Corp Bond -0.49%
US Gov’t Bond -0.68%

Commodity Prices:

Gold 2,336
Silver 29.43
Oil (WTI) 81.46

Currencies:

Dollar / Euro 1.06
Dollar / Pound 1.26
Yen / Dollar 160.56
Canadian /Dollar 0.73

Dear Friends,

Happy Springtime!!!  I hope you had a nice break or are about to go on one.  Going on vacation is something everyone needs to do for tons of reasons.  We took a trip to the southern end of the Rockies visiting family, searching for higher temps and no snow underfoot (the photo is of my adorable niece at Sand Dunes National Park).  Now that we are recharged, it’s time for track season for both girls, and ‘Sports Parenting’ for Jamey and I.  It’s awesome fun!

Markets and the economy have almost returned to previous highs and are not finding a lot of reasons to slow down.  In this newsletter we address a few concerns we are watching, and below we discuss how investing for social causes may in-fact not sacrifice performance.

Please feel free to modify your newsletter subscription with a simple email.  We have a paper and digital version, as well as a ‘no thank you Mike’ list we maintain and respect.  This is a 4-6 issue a year project.

Socially Responsible Investing showing encouraging performance

Recently when asked ‘What’s important about money to you?’, a few clients have expressed values other than only making money.  Socially responsible investing (SRI)—which seeks to effect positive social change while also potentially generating competitive financial returns—has emerged as a significant, grass-roots trend that we have been following from it’s inception.  Since the Forum for Sustainable and Responsible Investment (US SIF) began researching SRI in 1995, the assets in these types of investments have grown from $639 billion to nearly $12 trillion. That’s an 18-fold increase!

Examples of SRI Factors
Environmental Social Governance
Energy Consumption Child Labor Board Independence
Climate Change Human Rights Conflicts of Interest
Animal Welfare Relationships Shareholder Rights

It’s significant that SRI funds have tended to keep pace with non-SRI options. For example, the MSCI KLD 400 Social Index averaged an annual rate of return of 7.53% versus 7.77% for the S&P 500® Index over the 15-year period ending in December 2018.  Additional data from Morningstar shows that, on average, SRI mutual funds have slightly outperformed their non-SRI counterparts in the short, medium and long terms.  (Source: Charles Schwab and Co Inc.)

Let’s ensure that your investments are reflective of your values at our next meeting.


health has afforded many the ability to continue employment into their 60s & 70s

Inverted Yield Curve Puts Rates On Hold – Fixed Income Overview

The yield on the 10-year treasury fell to 2.41% at the end of March, down from its peak yield of 3.25% in October 2018. The Fed’s shift from a tightening mode to a hold mode is interpreted by some economists and analysts as a lack of confidence in economic growth.

Treasury yields inverted further as the 6-month treasury note yielded more than the 7-year treasury bond in March. Inverted yields mean that shorter term rates are higher than longer term rates, translated by markets as minimal economic expansion and inflation expectations.

A sustained inversion becomes more concerning should it linger for several quarters. Some are even expecting a rate cut later in the year, if not in 2020, should economic data shed dismal projections.

Negative yields on some European government bonds reflect minimal growth expectations with subdued inflation throughout the EU. An inverted yield curve in the U.S. may partially be the result of slowing economic expectations in Europe and internationally.

The yield curve has been fairly flat over the past few months, meaning that the yield on shorter term bonds have been similar to the yield on longer term bonds. This dynamic created some uncertainty for the Fed, making it difficult to determine whether to raise rates or keep them the same.

Many believe that a divergence between stock prices and bond yields has evolved, where bond prices have risen concurrently with stock prices. Stocks historically head lower when bonds prices head higher in anticipation of slowing economic activity or lingering uncertainty. (Sources: Eurostat, Treasury Dept., Federal Reserve)

Workforce Getting Older – Labor Demographics

Demographics drive the domestic labor force propelled by both young and unskilled workers to older more seasoned individuals. For decades, the baby boom generation commanded the nation’s workforce, representing the single largest age group to hold jobs across all industries and sectors. As those same workers have aged, a younger generation has assumed some of the gaps left by retiring boomers.

Over the years, Labor Department data found that those aged 16-24 have been making up a smaller portion of the workforce. The Department projects that by 2026, only 11.7% of the labor force will be comprised of 16-24 year olds, compared to 15.8% in 1996. Workers aged 25-54 are expected to make up the bulk of workers, representing over 
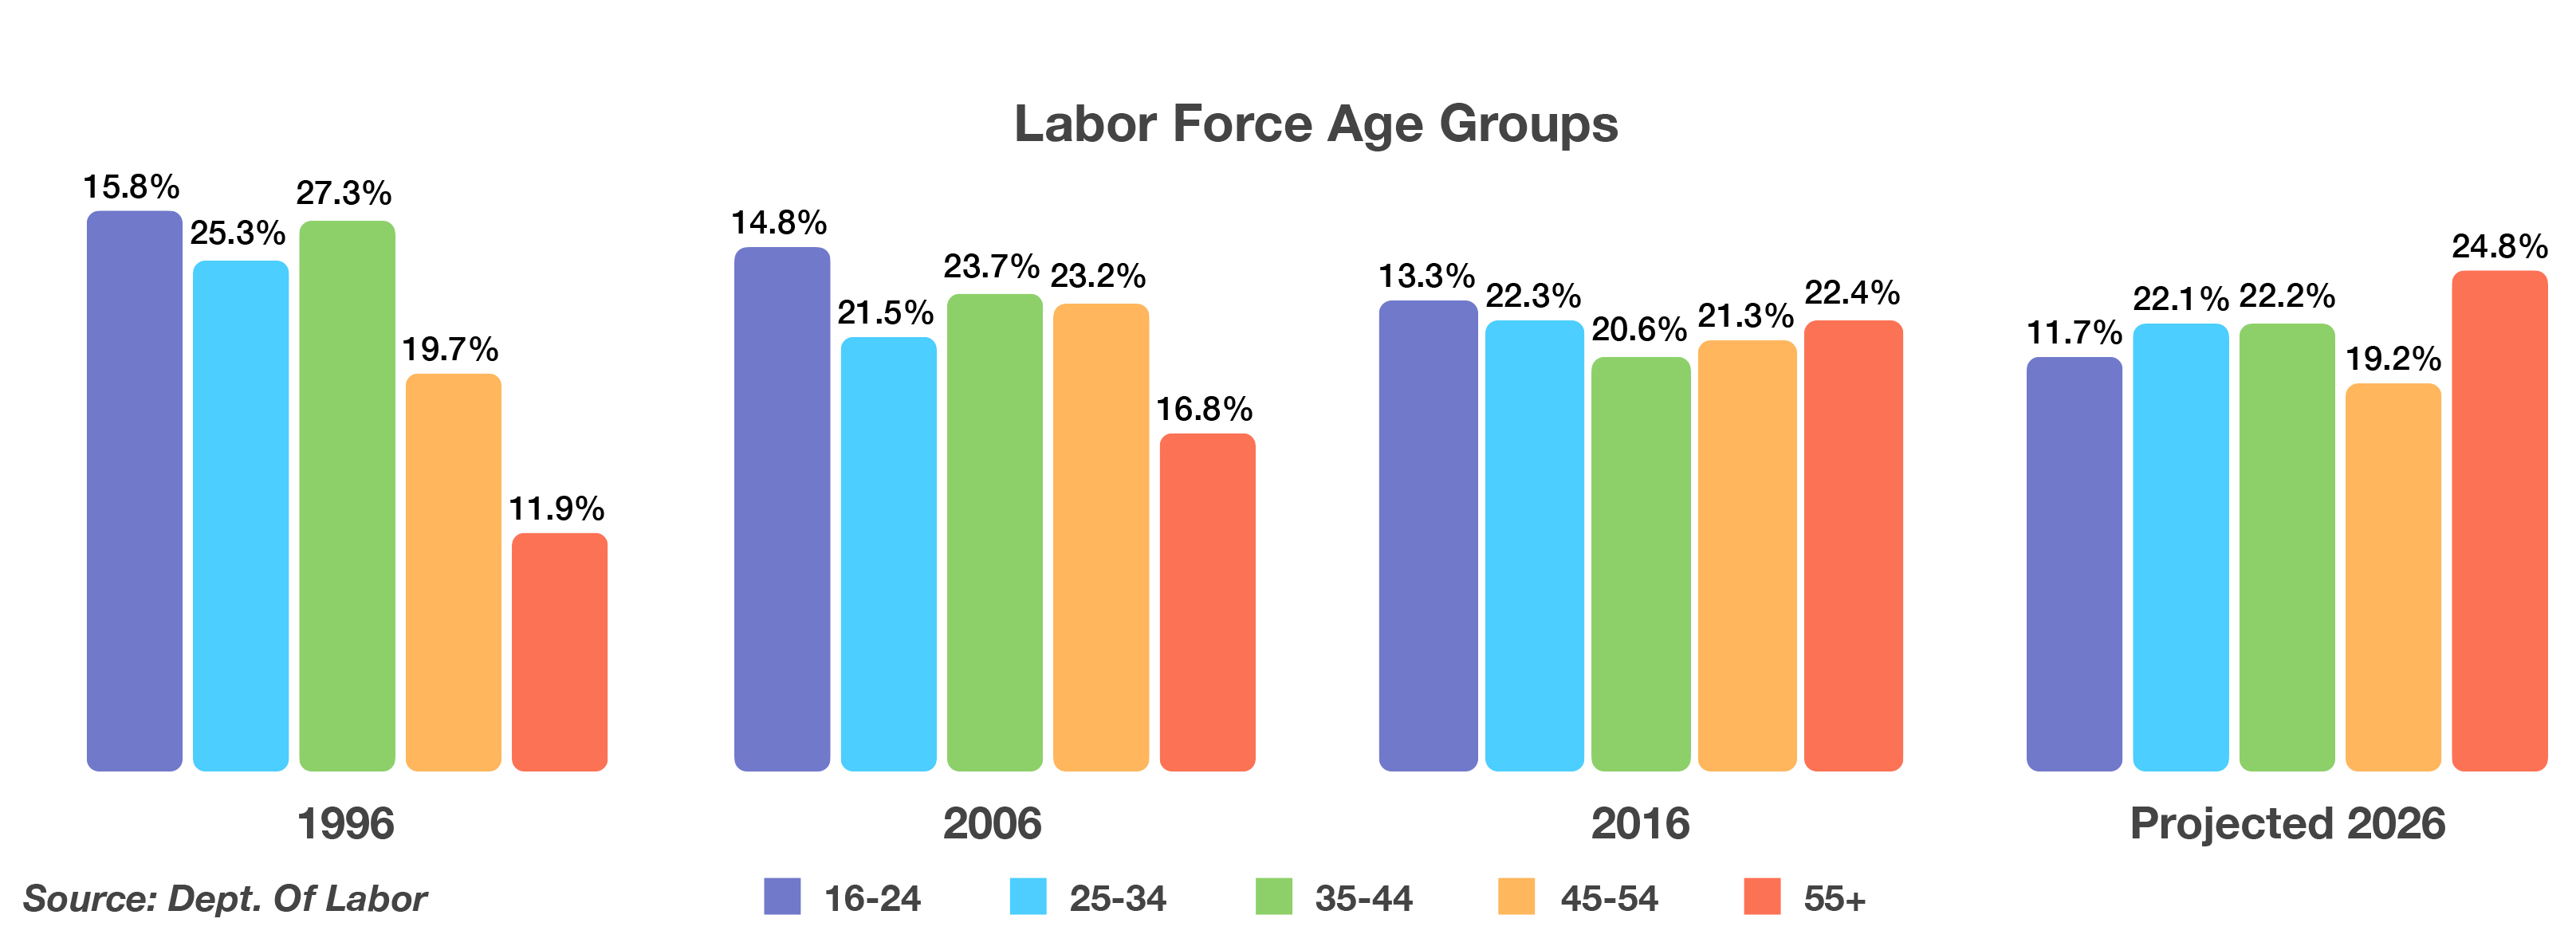
63% of the nation’s labor force, down from 72.3% in 1996. Department of Labor data revealed that over a thirty year period, those aged 55 and older will encompass 24.8% of the labor force in 2026, a stark increase from 11.9% in 1996. As American workers have aged over the decades, longer life expectancy and healthy lifestyles have afforded many the ability to continue employment well into their 60s and 70s. (Source: Department of Labor)


IRS is expected to reduce the number of taxpayers subject to penalties by 25% - 30%

How Student Debt Affects Credit Scores – College Planning

As the cost of education has risen over the years, so has the reliance on student debt in order to help finance such expenses. The concern is that more and more students are graduating from college with large amounts of student debt and with no job intact.

The Fair Credit Reporting Act (FCRA) recognizes student debt as any other type of debt, equal to mortgage debt, auto loans, and credit card balances. Student loans can affect credit both positively and negatively. Since student loans have long repayment periods, consistent and timely payments can assist in building and increasing credit scores. Having a mix of debt, such as a credit card, a car loan, and student loans can reflect positively as a broad mix of debt. Conversely, late payments and delinquencies on student debt can negatively impact credit scores and payment history.

Some parents and counselors are encouraging students to avoid excess student loans and to focus on applying for grants and scholarships instead. What is happening to much of student debt taken out is that parents and grandparents end up helping students make their debt payment. Data does show that some college graduates end up carrying student loans well into their 30s, 40s, and 50s, burdening already strained finances and household expenses.

Student loan debt is now the second highest consumer debt held after mortgage debt, and higher than both credit cards and auto loans as tracked by the Federal Reserve. There are over 44 million borrowers nationwide of student loans, with an average balance owed of roughly $37,000. Student loans are held across a broad spectrum of the public, including all demographics and age groups in every state.

Of growing concern are the amount of student loan delinquencies, which surpassed 10% of all student loans in 2018, with $31 billion in a serious delinquency status. Federal Reserve data reveals that the majority of borrowers have a loan balance of between $10,000 and $25,000, with 30-39 year olds holding most of the outstanding debt.

(Source: Federal Reserve Bank of St. Louis)


total student loans outstanding have exceeded $1.5 trillion


About Us

Our clients enjoy the feeling of having their financial lives kept in order.  Freedom from worry comes from working with an experienced advisor that understands your entire financial life and is accessible and attentive to your needs.  As a fiduciary, Mike is unable to receive commissions from financial products and free to make recommendations that are unbiased by Wall Street.  With over a decade of experience caring for a small family of clients, our specialties are preserving wealth and generating sustainable income.  Our average client net worth ranges from $2 to $10 Million.  Go outside, we’ve got this.

MFA Events Calendar
GVLT Summer Trails Sponsor June Summer Trails Challenge- Log you miles on Area Trails https://gvlt.org/summer-trails-challenge/
CPA Symposium 4 CPE for a CPA Continuing Education Event May 22nd.  Register via email. mike@mccormickfinancialadvisors.com
Radio Wednesdays 8am on 1450am KMMSam.com
Radio Fridays 1pm on 95.9fm KGVM.org
Fun and Run 5k Wed Night Brew Run Sponsor.  May 8th, 6pm start at Madison River Brewing Co.  Bozemanrunningcompany.com
www.mccormickfinancialadvisors.com | 406-522-3201