Ocean Park Capital Management

2503 Main Street

Santa Monica, CA 90405

Main: 310.392.7300

Daily Performance Line:  310.281.8577

March 2019
Market Update
(all values as of 06.28.2024)

Stock Indices:

Dow Jones 39,118
S&P 500 5,460
Nasdaq 17,732

Bond Sector Yields:

2 Yr Treasury 4.71%
10 Yr Treasury 4.36%
10 Yr Municipal 2.86%
High Yield 7.58%

YTD Market Returns:

Dow Jones 3.79%
S&P 500 14.48%
Nasdaq 18.13%
MSCI-EAFE 3.51%
MSCI-Europe 3.72%
MSCI-Pacific 3.05%
MSCI-Emg Mkt 6.11%
 
US Agg Bond -0.71%
US Corp Bond -0.49%
US Gov’t Bond -0.68%

Commodity Prices:

Gold 2,336
Silver 29.43
Oil (WTI) 81.46

Currencies:

Dollar / Euro 1.06
Dollar / Pound 1.26
Yen / Dollar 160.56
Canadian /Dollar 0.73

Fund Overview

The major indices posted modest gains in March, as did the Ocean Park funds.  Consumer and technology stocks were strong again.  While we trailed the S&P 500 slightly, we continue to outperform the HFRI Equity Hedge Index, which rose 0.65% for the month and is up 7.82% for the year to date.

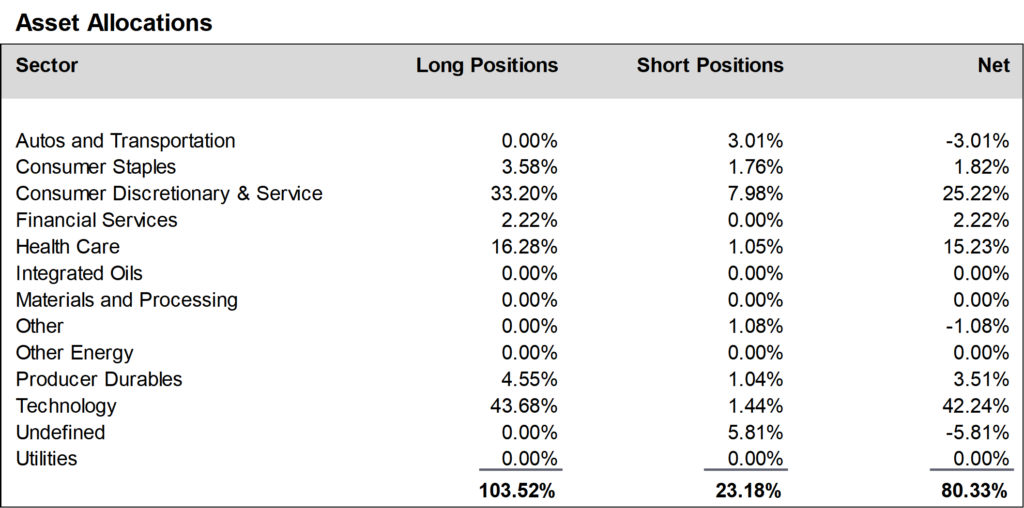
During March, we added to positions in the technology and the producer durables sectors and reduced positions in the consumer discretionary and service sector.  We also initiated short positions in the autos and transportation sector.  Heading into earnings season, we ended the month at about 80% net long, down from about 86% in February.

A schedule showing the performance of the Investors Fund is included below, along with our Asset Allocation Chart. Daily updates on our activity are available on our Results Line, at
310-281-8577, and current information is also maintained on our website at www.oceanparkcapital.com. To gain access to the site enter password opcap.


*These results are pro forma. Actual results for most investors will vary. See additional disclosures on page 4.

Past performance does not guarantee future results.


Equity Overview March 2019

Equity Overview

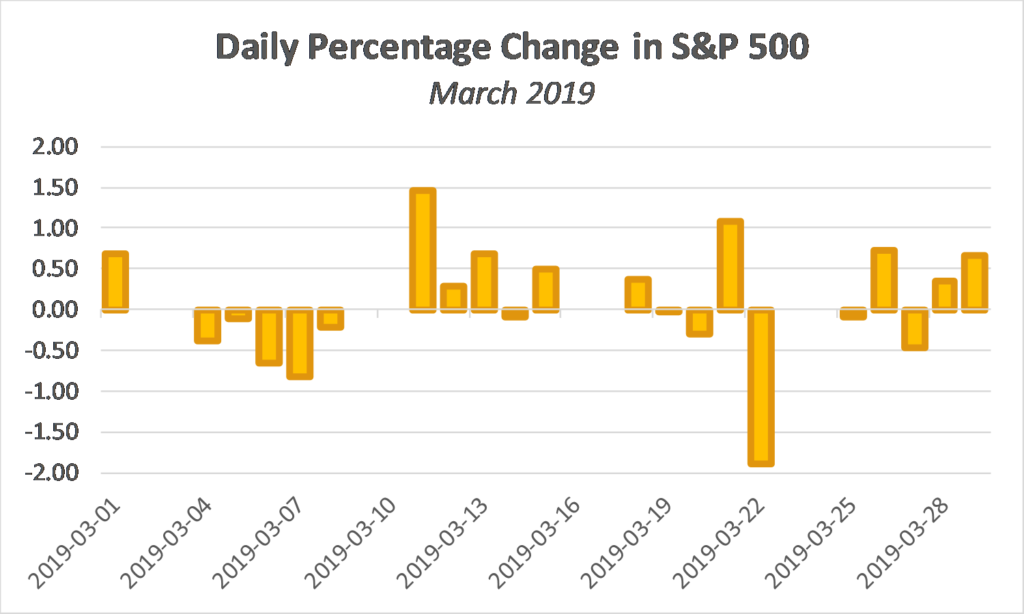
Volatility subsided in March.  Over 21 trading days, the S&P 500 saw only 3 days in which the index closed with a daily change greater than 1% (two up, one down).

Investors continued to favor growth stocks over value stocks.  And large cap stocks performed significantly better than mid and small cap stocks, as reflected in their S&P indices:  the S&P 500, which comprises large cap stocks, gained 1.79% while the mid-cap S&P 400 and the small-cap S&P 600 both lost ground.


Macro Overview March 2019

Macro Overview

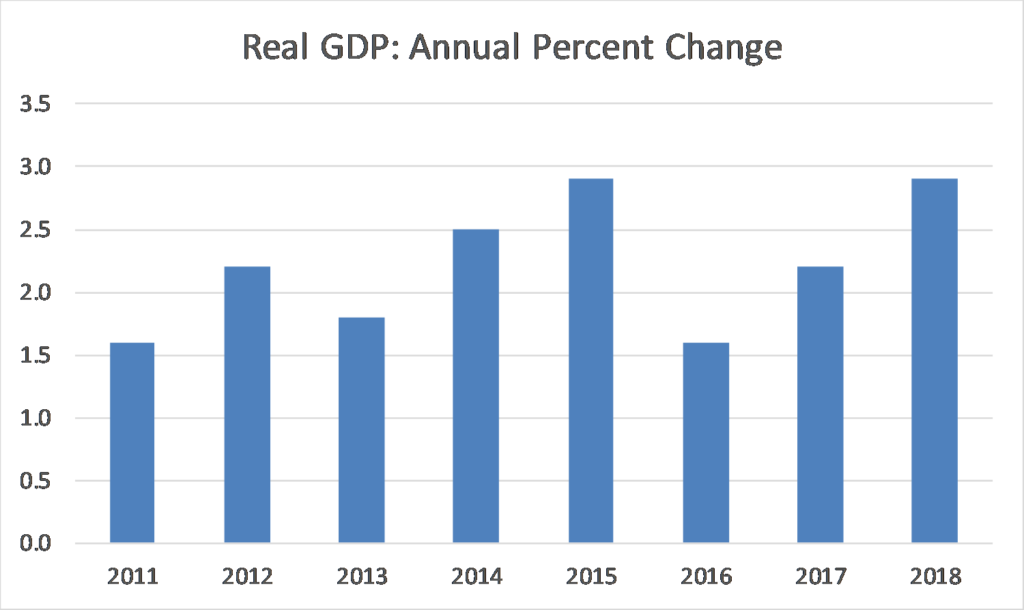
Economic data reported in March were mixed.  Manufacturing and job growth were weak.  However, housing strengthened, unemployment dropped to 3.8%, and average hourly wages rose 3.4% year over year, the highest rate in a decade.  The final reading from the Commerce Department of GDP growth for the fourth quarter of 2018 was 2.2%, down from its previous estimate of 2.6%.  This left full-year 2018 growth at 2.9%, just shy of the administration hope for 3%.

The Fed reduced its 2019 growth estimates for the U.S. economy and indicated that further interest rate increases this year were unlikely.  It cited trade disputes, slowing growth in China and Europe, and possible spillover from Brexit (if it actually happens given the current political uncertainty in Great Britain).

Short term bond yields rose above long term yields in March, creating an inverted yield curve.  This reflects investors’ belief that the economy will slow over time, demand will weaken, and interest rates will trend lower.  A persistent inverted yield curve has typically foreshadowed a recession, but we have not reached that point yet.


Additional Disclosures March 2019

Additional Disclosures

Performance data for OPI reflect the reinvestment of dividends and other earnings on the fund’s assets.  Performance data for the major indices reflect only changes in the value of those indices, and would be higher if dividends were included. However, the index data do not reflect fees that would be paid to index fund managers and transaction costs that would be incurred when their component stocks are bought or sold, while OPI’s data do reflect quarterly fees and expenses incurred by the fund.  The information provided is believed to be reliable, but its accuracy or completeness is not warranted. This material is not intended as an offer or solicitation for the purchase or sale of any stock, bond, mutual fund, or any other financial instrument. The views and strategies discussed herein may not be appropriate and/or suitable for all investors. This material is meant solely for informational purposes, and is not intended to suffice as any type of accounting, legal, tax, or estate planning advice. Any and all forecasts mentioned are for illustrative purposes only and should not be interpreted as investment recommendations.