March 2019 Market Update
Market Update
(all values as of 06.28.2024)

Stock Indices:

Dow Jones 39,118
S&P 500 5,460
Nasdaq 17,732

Bond Sector Yields:

2 Yr Treasury 4.71%
10 Yr Treasury 4.36%
10 Yr Municipal 2.86%
High Yield 7.58%

YTD Market Returns:

Dow Jones 3.79%
S&P 500 14.48%
Nasdaq 18.13%
MSCI-EAFE 3.51%
MSCI-Europe 3.72%
MSCI-Pacific 3.05%
MSCI-Emg Mkt 6.11%
 
US Agg Bond -0.71%
US Corp Bond -0.49%
US Gov’t Bond -0.68%

Commodity Prices:

Gold 2,336
Silver 29.43
Oil (WTI) 81.46

Currencies:

Dollar / Euro 1.06
Dollar / Pound 1.26
Yen / Dollar 160.56
Canadian /Dollar 0.73

Macro Overview

A change in the Federal Reserve’s stance on the direction of interest rates helped buoy equity and bond prices higher in March, allowing U.S. equity indices to post the strongest first quarter in nearly ten years.  The Federal Reserve scaled back its growth expectations for the U.S. economy and announced that it would hold rates steady with no additional rate increases this year. Economists interpreted the comments as a somber assessment of economic expansion, yet positively received by the equity and fixed income markets. The Fed mentioned trade disputes, slowing growth in China and Europe, and possible spillovers from Britain’s exit from the European Union were factors.

Short-term bond yields rose above longer term bond yields in March creating what is known in the fixed income sector as an inverted yield curve. Normally, short-term yields are lower than longer term yields, resulting in a normal yield curve. A persistent inverted yield curve would become more concerning should it linger for several quarters.

Concerns surrounding economic momentum in Europe became more prevalent as Europe’s central bank, the ECB, signaled that it would maintain interest rates below zero longer than anticipated. Slower growth in both exports and imports have been implying a slowdown throughout the EU, which is comprised of 28 European countries. The pending outcome on how and when Britain finally exits the EU is also adding duress to Britain’s trading and business partners all over Europe.

Chinese government data revealed that exports heading to other countries worldwide fell over 20% in the past year. Data also showed that imports had fallen into China, realizing that Chinese consumers were scaling back demand from prior months.

Congressional leaders are considering legislation that would repeal the current age cap of 70.5 for contributing to IRAs as well as increase the required minimum distribution age for retirement accounts from 70.5 to 72. Such legislation, if passed, would be the most significant change to retirement plans since 2006. (Sources: Federal Reserve, Dept. of Labor, IRS, Treasury Dept., ECB)

Lower Rate Outlook & Trade Talks Elevate Stocks In First Quarter – Equity Overview

Optimism over progress on U.S. trade discussions with China seemed to overshadow concerns about a slowing economic expansion helping to propel equity indices towards the end of the third quarter.

Gains were broad for the S&P 500 Index with all 11 sectors ending higher for the first quarter, which has not occurred since 2014. Technology and energy stocks were among the best performing sectors for the quarter, encompassing a broad scope of industries and companies. A counterintuitive environment has driven stocks higher while the bond market is signaling slower growth. Some analysts are expecting a slowdown in corporate earnings growth as global demand projections have been trimmed. (Sources: S&P, Bloomberg, Reuters)


health has afforded many the ability to continue employment into their 60s & 70s

Inverted Yield Curve Puts Rates On Hold – Fixed Income Overview

The yield on the 10-year treasury fell to 2.41% at the end of March, down from its peak yield of 3.25% in October 2018. The Fed’s shift from a tightening mode to a hold mode is interpreted by some economists and analysts as a lack of confidence in economic growth.

Treasury yields inverted further as the 6-month treasury note yielded more than the 7-year treasury bond in March. Inverted yields mean that shorter term rates are higher than longer term rates, translated by markets as minimal economic expansion and inflation expectations.  A sustained inversion becomes more concerning should it linger for several quarters. Some are even expecting a rate cut later in the year, if not in 2020, should economic data shed dismal projections.

Negative yields on some European government bonds reflect minimal growth expectations with subdued inflation throughout the EU. An inverted yield curve in the U.S. may partially be the result of slowing economic expectations in Europe and internationally.

Many believe that a divergence between stock prices and bond yields has evolved, where bond prices have risen concurrently with stock prices. Stocks historically head lower when bonds prices head higher in anticipation of slowing economic activity or lingering uncertainty. (Sources: Eurostat, Treasury Dept., Federal Reserve)

Workforce Getting Older – Labor Demographics

Demographics drive the domestic labor force propelled by both young and unskilled workers to older more seasoned individuals. For decades, the baby boom generation commanded the nation’s workforce, representing the single largest age group to hold jobs across all industries and sectors. As those same workers have aged, a younger generation has assumed some of the gaps left by retiring boomers.

Over the years, Labor Department data found that those aged 16-24 have been making up a smaller portion of the workforce. The Department projects that by 2026, only 11.7% of the labor force will be comprised of 16-24 year olds, compared to 15.8% in 1996. Workers aged 25-54 are expected to make up the bulk of workers, representing over 
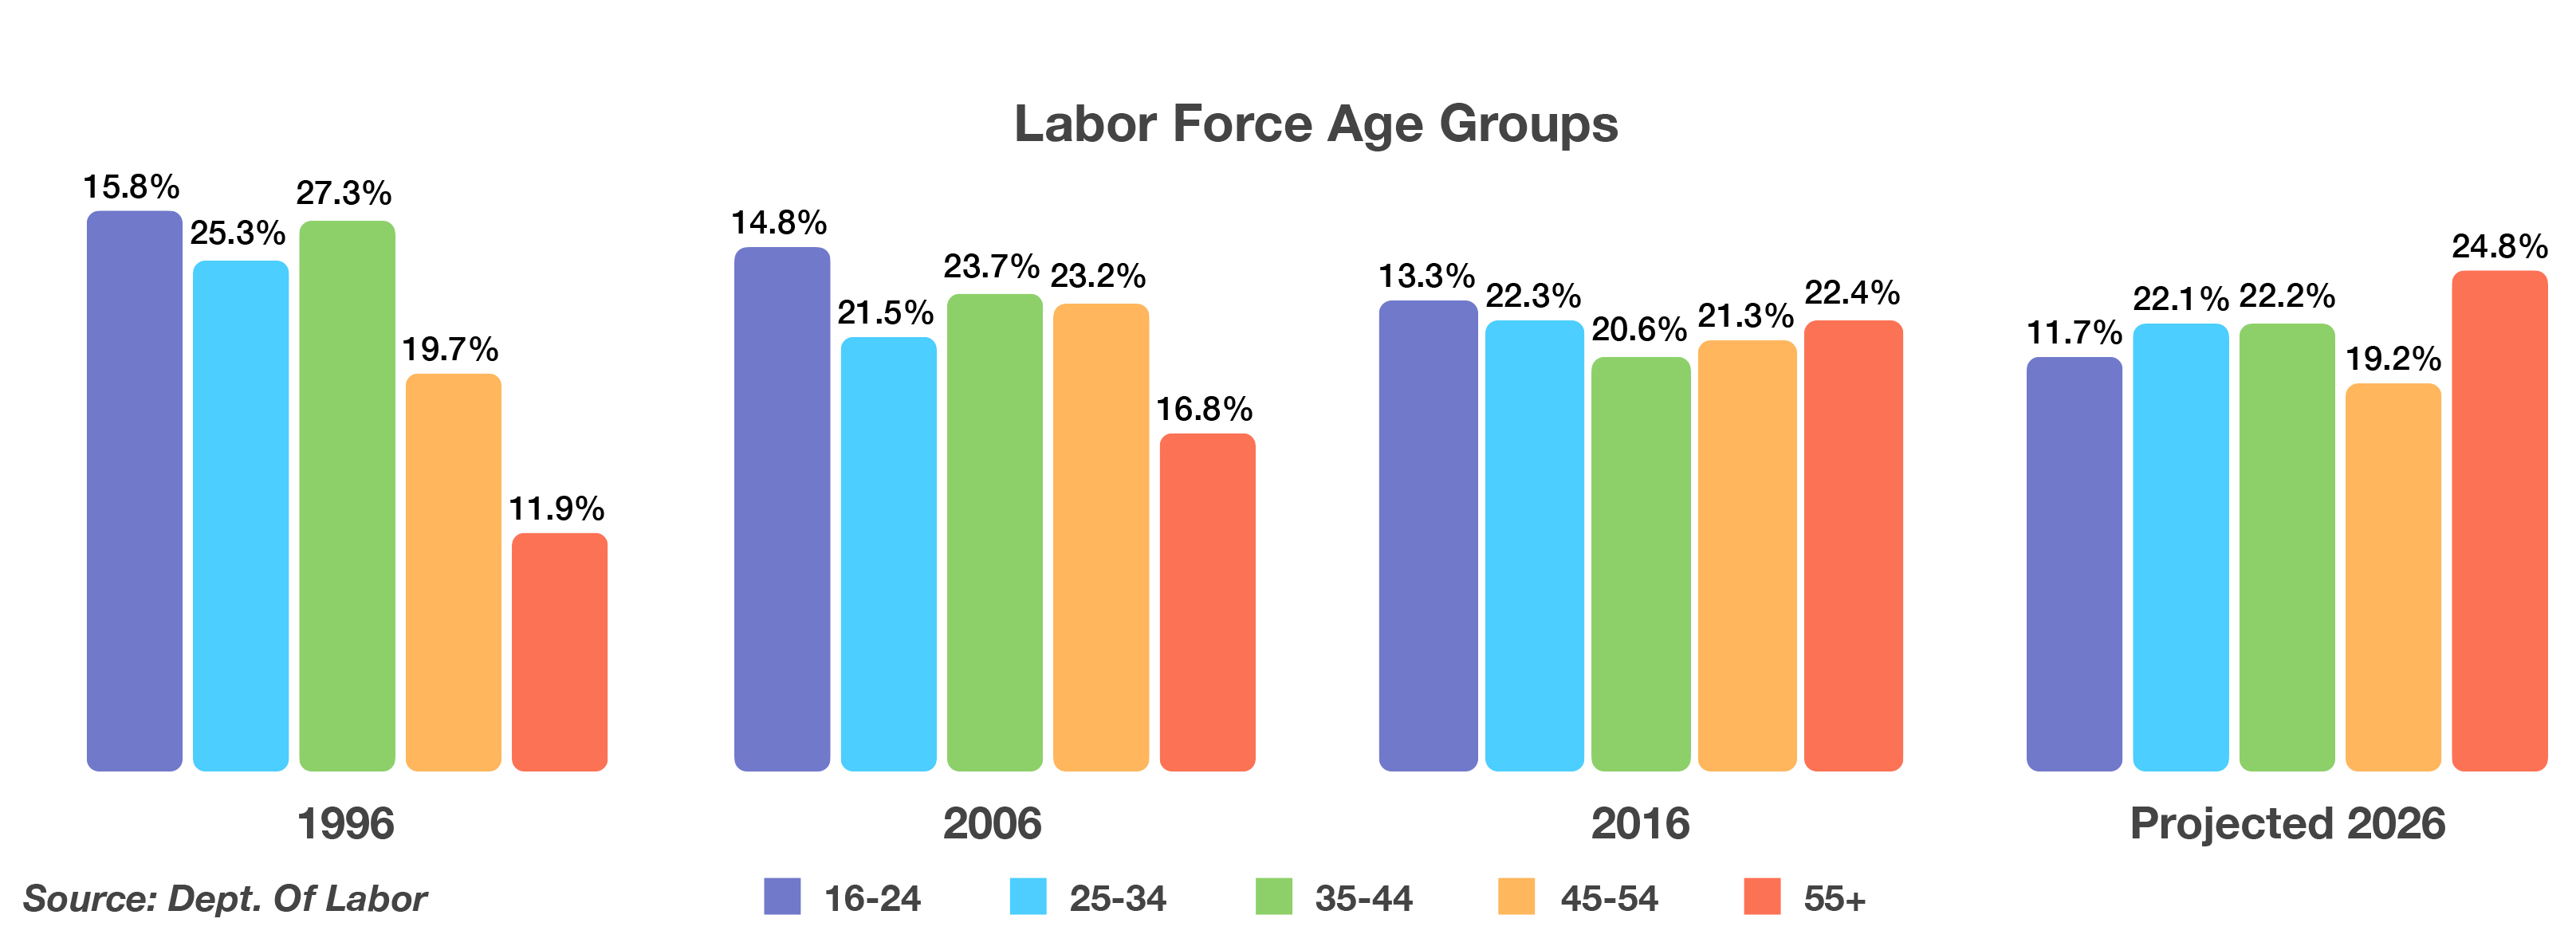
63% of the nation’s labor force, down from 72.3% in 1996. Department of Labor data revealed that over a thirty year period, those aged 55 and older will encompass 24.8% of the labor force in 2026, a stark increase from 11.9% in 1996. As American workers have aged over the decades, longer life expectancy and healthy lifestyles have afforded many the ability to continue employment well into their 60s and 70s. (Source: Department of Labor)


To Brexit or not to Brexit...


What Britain Leaving The EU Means – Brexit Overview

Turbulent and politically charged challenges between the British government and Parliament have resulted in numerous failures to finally execute Britain’s departure from the EU, known as  Brexit.  The significance of Britain exiting the EU may eventually be substantial as other countries may decide to cast similar votes whether or not to leave the EU. Several of the existing members are anxiously awaiting the outcome of Brexit to determine how challenging both politically and economically it may be. As of the end of 2018, Britain represented roughly 13% of the EU’s total GDP, ranking second in terms of GDP after Germany.

The EU (European Union) was established following the end of WWII in order to offer financial and structural stability for European countries. Since its establishment, the EU has grown to a membership of 28 countries abiding by various rules and policies set forth by the EU Council. One of the responsibilities of member EU countries is to accept and honor immigrants and citizens from other EU countries as part of the human rights initiatives recognized by the EU. Immigration has been a topic of contention among various EU countries for some time. This was a decisive factor for Britain leaving the EU since its economy and cities have been inundated by foreign-born immigrants seeking jobs and a better quality of life.

Since Britain has been part of the EU since 1973, it is expected that the unraveling of British ties from the EU could take years. Contracts, employees, and laws will all have to be revised, reshuffled, and rewritten in order to accommodate the divorce between the two.

Now that the British have decided on leaving the EU, many believe that another referendum could possibly be presented in France and other EU countries. The concern of a domino effect is very realistic, as several other EU members are experiencing similar frustrations as Britain. (Sources: EuroStat, EU Council)

EU Data Reveals European Slow Down – European Region Update

Industrial production among the 28 countries comprising the European Union (EU) has been steadily falling over the past year. Factors affecting the slowdown include the persistent Brexit dilemma, slowing demand from China, and weakening consumer demand throughout the EU.

Of the 28 member countries, Ireland, Portugal and Germany were among the countries with the largest decreases in industrial production. Smaller economies throughout the EU actually saw a slight increase in production, including Estonia, Greece and Malta.

The United Kingdom continued to experience a drop in production, as the country’s pending exit from the EU produced tremendous uncertainty among all sectors of the British economy.  (Sources: Eurostat; Industrial Production Release)

 
Corporate debt around the world is growing...

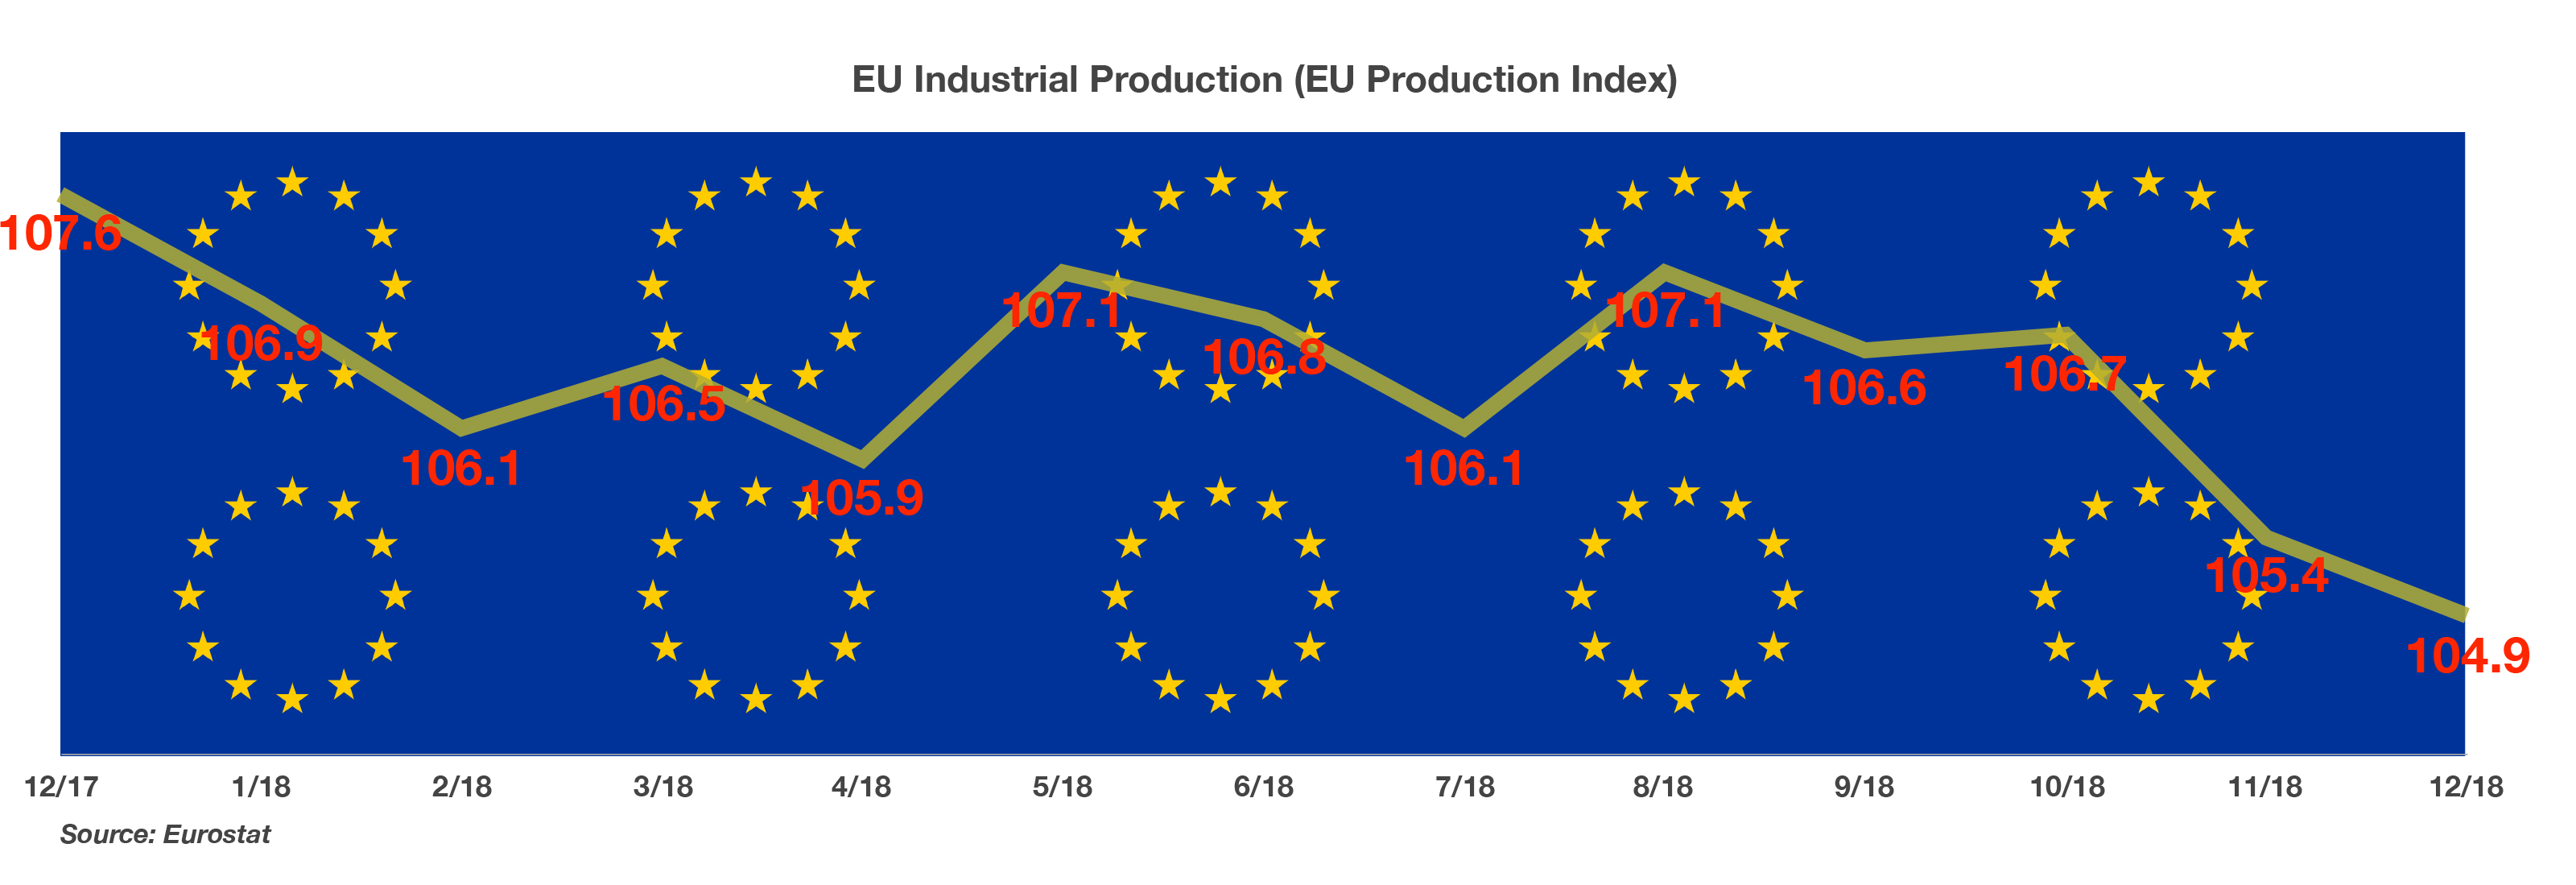
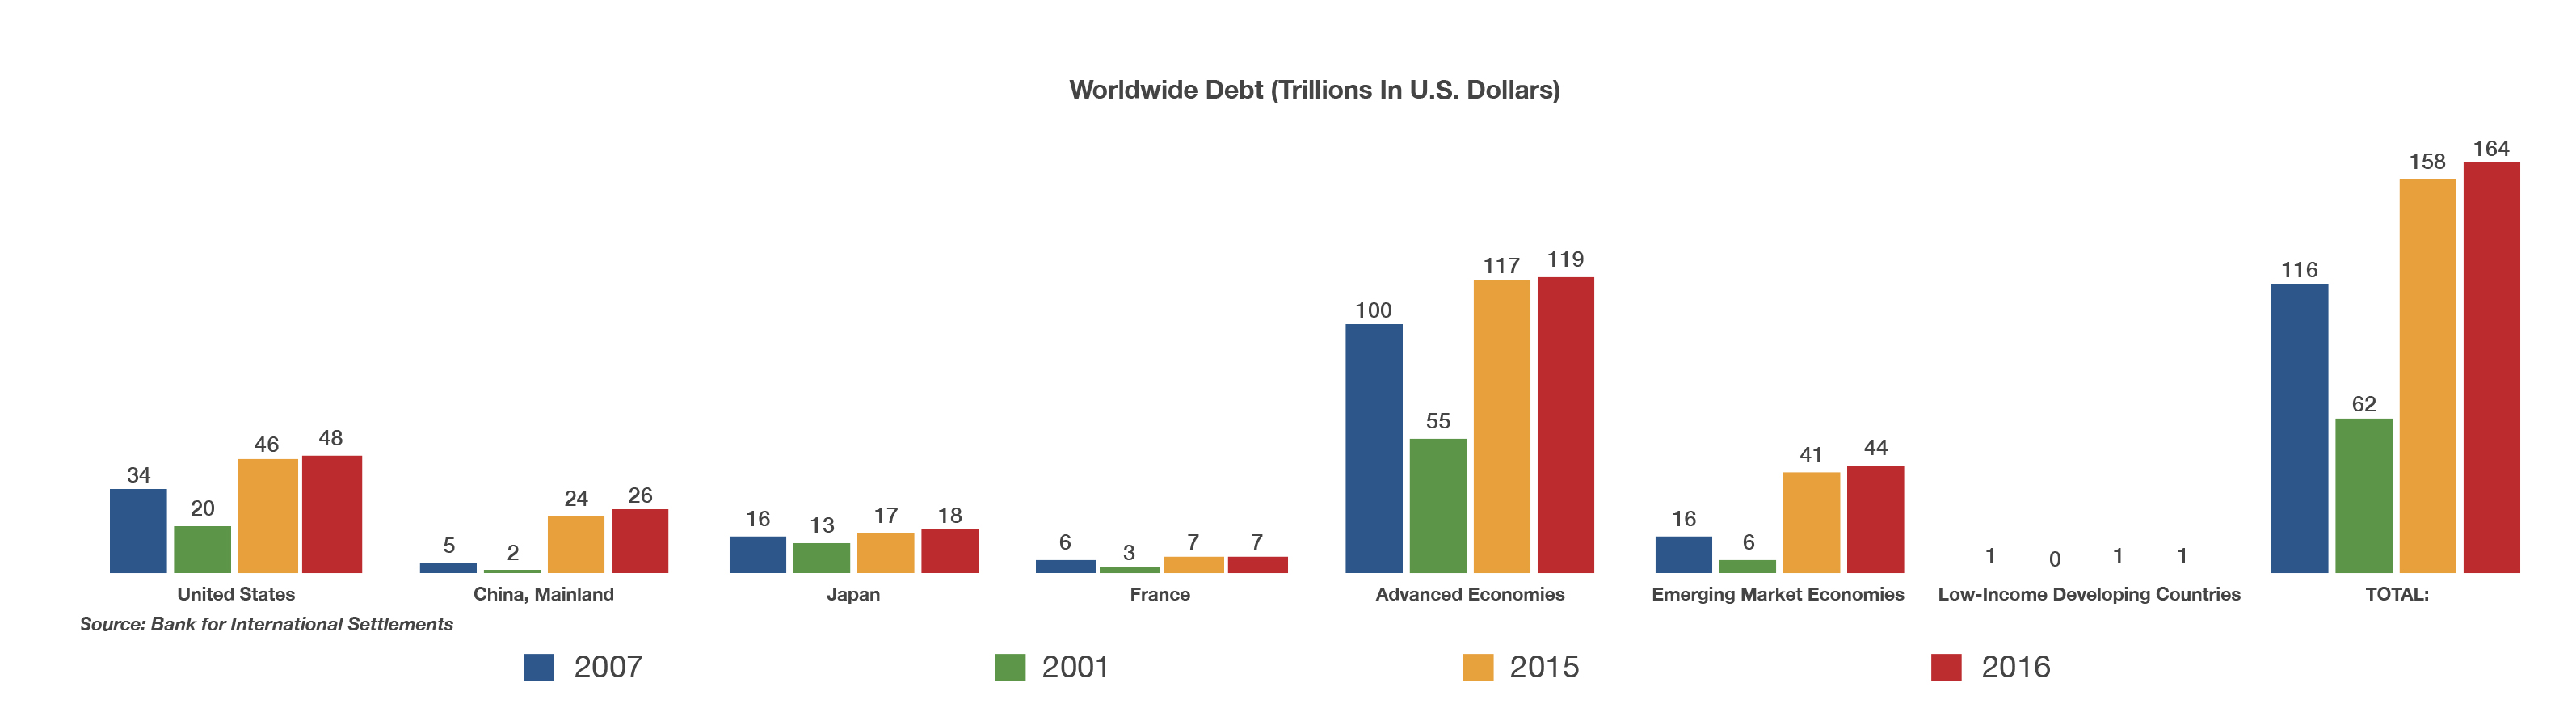
Worldwide Debt On The Rise – International Finance

Corporate debt worldwide has become a growing concern among central bankers and international finance managers. The extended period of ultra low interest rates following the monetary stimulus programs of central banks worldwide allowed companies from all over the globe to issue debt very inexpensively. Now with monetary policy on reversal from a decade of stimulus, the cost of debt will begin to increase.

Of the more than $164 trillion of debt worldwide, nearly three quarters of it is held by advanced economies such as the U.S., Britain, and Germany. A smaller proportion is maintained by emerging market economies, yet are seeing rapid growth in debt accumulation. The Bank for International Settlements identified three economies with the highest risk of a bank crisis, China, Canada, and Hong Kong, primarily due to excessive outstanding debt. Additionally, expansion of debt in the U.S. has slowed while it continues to expand in China.  (Sources: https://www.bis.org/statistics/secstats.htm;summary of debt securities outstanding)

Fertility Rates Around The World – International Demographics

Prosperity and growth of a country is contingent on the health and expansion of its population. A measure of growth which eventually leads to a population demanding food, clothing, medicine, and other necessary goods is the fertility rate.

Most of the highest fertility rates in the world are found in emerging regions of Africa and the Middle East, where mothers are giving birth to as many as seven children. Fertility rates are lower among developed countries such as Germany, Japan, and the United States, where average ages are above 35.

Many large multinational corporations employ economists and demographics specialists to better determine what products and services may be optimized in various regions and countries as dictated by population growth. Agricultural companies, for example, tend to cater more food products and farming equipment to emerging countries made up of a younger population. This is so because statistically, younger people within a growing population eat more than older people.

A shift in demographics also creates a shift in the financial and labor markets, as older more mature populations provide less growth as well as a limited workforce. The younger emerging populations not only provide future growth, but are also a source of workers for growing economies.  (Sources: CIA World Factbook)