Ocean Park Capital Management

2503 Main Street

Santa Monica, CA 90405

Main: 310.392.7300

Daily Performance Line:  310.281.8577

March 2020
Market Update
(all values as of 08.30.2024)

Stock Indices:

Dow Jones 41,563
S&P 500 5,648
Nasdaq 17,713

Bond Sector Yields:

2 Yr Treasury 3.91%
10 Yr Treasury 3.91%
10 Yr Municipal 2.70%
High Yield 6.92%

YTD Market Returns:

Dow Jones 10.28%
S&P 500 18.42%
Nasdaq 18.00%
MSCI-EAFE 9.72%
MSCI-Europe 9.81%
MSCI-Pacific 9.34%
MSCI-Emg Mkt 7.44%
 
US Agg Bond 3.07%
US Corp Bond 3.49%
US Gov’t Bond 2.95%

Commodity Prices:

Gold 2,535
Silver 29.24
Oil (WTI) 73.65

Currencies:

Dollar / Euro 1.10
Dollar / Pound 1.31
Yen / Dollar 144.79
Canadian /Dollar 0.74

Fund Overview

The downturn in equities which started in February gained momentum in March, exacerbated by the full-blown arrival of the Covid-19 pandemic.  As a result, all of the major indices sustained double-digit losses.  The Ocean Park funds also recorded a substantial decline, but remained ahead of the major indices for the year to date.  Companies in our portfolio that saw increased demand during the pandemic—such as Amazon and Crowdstrike—contributed meaningfully to our outperformance.

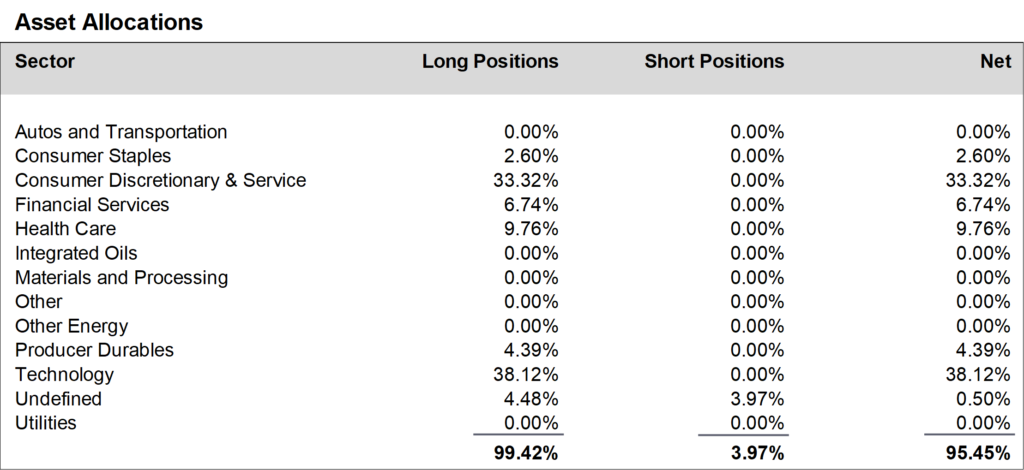
During March, we added to positions in the health care and the consumer discretionary and service sectors, and reduced positions in the technology sector.  We ended the month at about 95% net long, down from about 96% net long in February.


Daily updates on our activity are available on our Results Line, at 310-281-8577, and current information is also maintained on our website at www.oceanparkcapital.com. To gain access to the site enter password opcap.

*These results are pro forma. Actual results for most investors will vary. See additional disclosures on page 4. Past performance does not guarantee future results.

 
Equity Overview - March 2020

Equity Overview

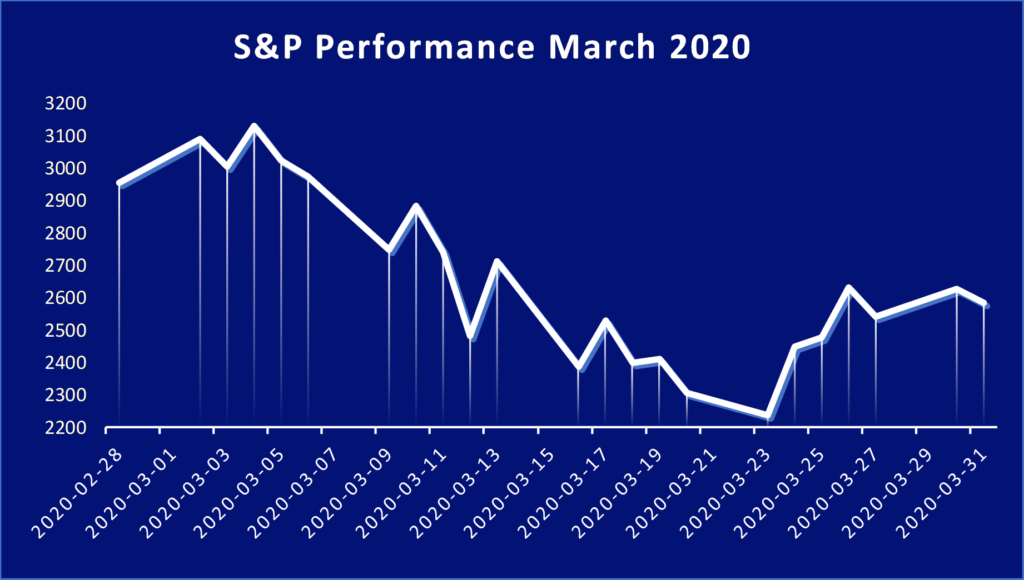
In the first 16 trading days of March, the S&P 500 fell over 24%.  But the index rallied strongly at month’s end and recovered almost half of those losses, finishing down 12.5%.  International markets had similar results, with Britain down 14%, Germany down 16%, and Japan down 11%.

U.S. stocks saw extraordinary volatility, with an average daily move of about 5% in the S&P 500.  This included three days above 9% and one day of 12%, and generated several trading halts.  At mid-month the CBOE Volatility Index, known as VIX, reached an all-time high.

Growth stocks outperformed value stocks, although both categories fell dramatically.  No market sector escaped the downturn, but health care stocks had the smallest loss (-4%).  Energy stocks were crushed, with the sector down 35%.


Macro Overview - March 2020

 Macro Overview

The Covid-19 pandemic shut down most of the U.S. economy in March and brought an end to the 11-year bull market.  Making matters worse, a dispute between Russia and OPEC on production cuts to reflect the reduced demand for oil led to a precipitous drop in oil prices and even more stress on the U.S. and world economy.

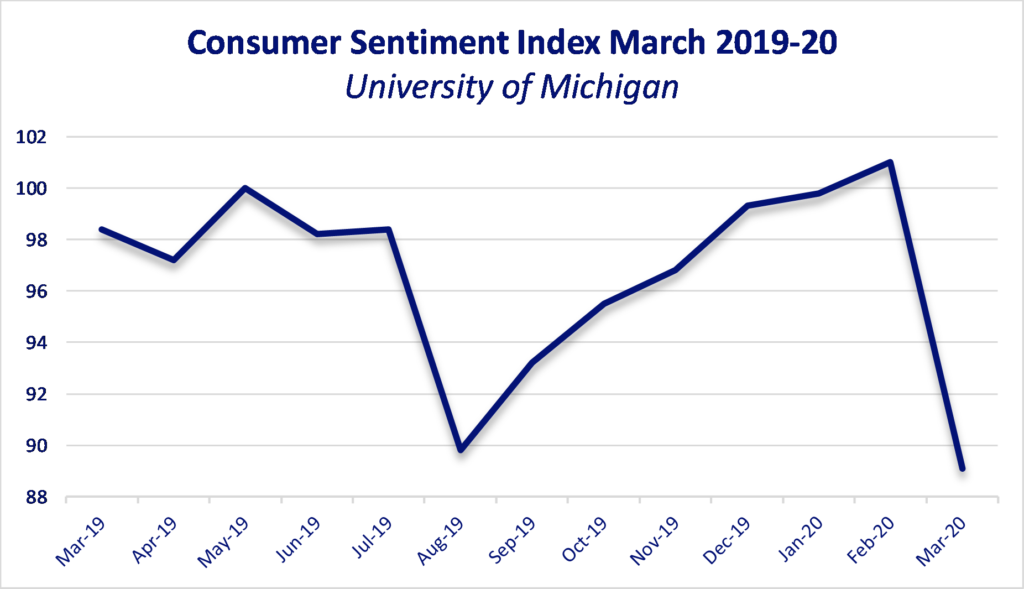
As businesses shuttered operations and laid off workers, unemployment claims spiked to 10-million with analysts predicting more millions to come.  Consumer sentiment as measured by the University of Michigan index fell from 101 to 89.1, its fourth largest decline in almost fifty years.

With recession almost certain and depression a possibility, the Fed took emergency action, ultimately slashing short-term interest rates to zero.  And, to keep credit markets functioning, it made an unprecedented commitment to spend nearly $1-trillion on Treasury, municipal, and corporate bonds.  In addition, Congress and the administration enacted a $2.2-trillion stimulus plan, providing support for business as well as cash payments and enhanced unemployment insurance for individuals.

The future remains unclear and will depend on the path of the current pandemic, and the possibility of a resurgence of the virus later this year or next.  But enormous resources are being devoted around the world to finding effective treatments and vaccines.  Eventually, and maybe sooner, they will be found.  And eventually, and maybe sooner, the shutdown will be relaxed, economic activity will resume, and the markets should return to a semblance of normalcy.


Additional Disclosures

Additional Disclosures

Performance data for OPI reflect the reinvestment of dividends and other earnings on the fund’s assets.  Performance data for the major indices reflect only changes in the value of those indices, and would be higher if dividends were included. However, the index data do not reflect fees that would be paid to index fund managers and transaction costs that would be incurred when their component stocks are bought or sold, while OPI’s data do reflect quarterly fees and expenses incurred by the fund.  The information provided is believed to be reliable, but its accuracy or completeness is not warranted. This material is not intended as an offer or solicitation for the purchase or sale of any stock, bond, mutual fund, or any other financial instrument. The views and strategies discussed herein may not be appropriate and/or suitable for all investors. This material is meant solely for informational purposes, and is not intended to suffice as any type of accounting, legal, tax, or estate planning advice. Any and all forecasts mentioned are for illustrative purposes only and should not be interpreted as investment recommendations.