2Q2022 Newsletter
Market Update
(all values as of 06.28.2024)

Stock Indices:

Dow Jones 39,118
S&P 500 5,460
Nasdaq 17,732

Bond Sector Yields:

2 Yr Treasury 4.71%
10 Yr Treasury 4.36%
10 Yr Municipal 2.86%
High Yield 7.58%

YTD Market Returns:

Dow Jones 3.79%
S&P 500 14.48%
Nasdaq 18.13%
MSCI-EAFE 3.51%
MSCI-Europe 3.72%
MSCI-Pacific 3.05%
MSCI-Emg Mkt 6.11%
 
US Agg Bond -0.71%
US Corp Bond -0.49%
US Gov’t Bond -0.68%

Commodity Prices:

Gold 2,336
Silver 29.43
Oil (WTI) 81.46

Currencies:

Dollar / Euro 1.06
Dollar / Pound 1.26
Yen / Dollar 160.56
Canadian /Dollar 0.73

Macro Overview

The Russia-Ukraine war has intensified inflation expectations due to the threat of global supply chains which are expected to be impaired for an extended period of time. Supply chain issues were already wreaking havoc on global manufacturing, production costs, and consumer availability before the Russian invasion started.

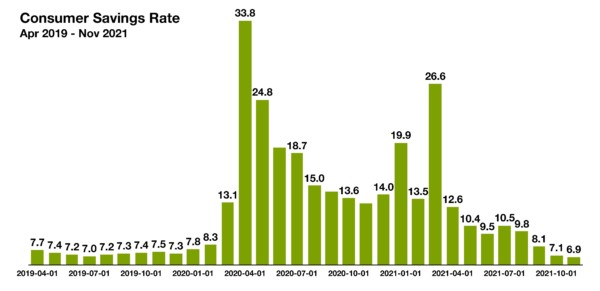
Consumers are rapidly losing purchasing power as rising rates and inflation have created higher borrowing costs for homebuyers and consumers overall. Quickly elevating mortgage rates have some borrowers being disqualified on mortgage loans that had previously been approved.

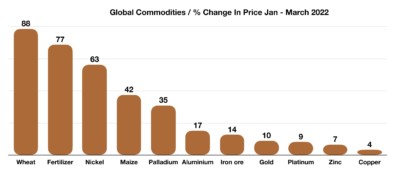
The Federal Reserve initiated its long awaited rate increase in March, making its first of several additional increases projected this year. Consumer loan rates, mortgage rates, and auto loan rates all increased. The Fed’s objective is to circumvent inflationary pressures by raising rates in order to ease consumer demand for products and services. Economists believe that the tremendous spike in global commodity prices is creating commodity-led inflation, which increases costs for production, manufacturing, and consumers globally.

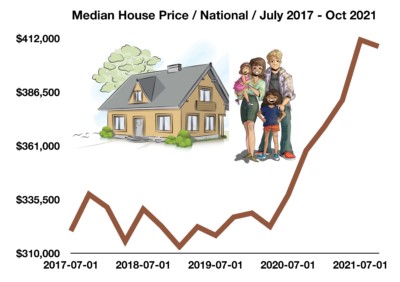
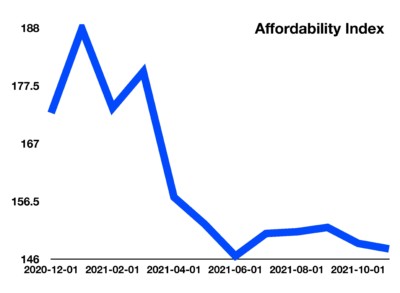
The pandemic-induced demand for homes nationwide may eventually subside as mortgage rates have reduced affordability for millions of homebuyers. The average 30-year conforming mortgage rate rose to 4.67% in March, up from a low of 2.66% in December 2020.

Short-term Treasury bond yields began to move higher than some long-term Treasury bond yields, viewed as an indication of a possible economic slowdown. Rising short-term rates may signal inflationary pressures, while lower long-term rates may suggest a recessionary environment sometime in the future.

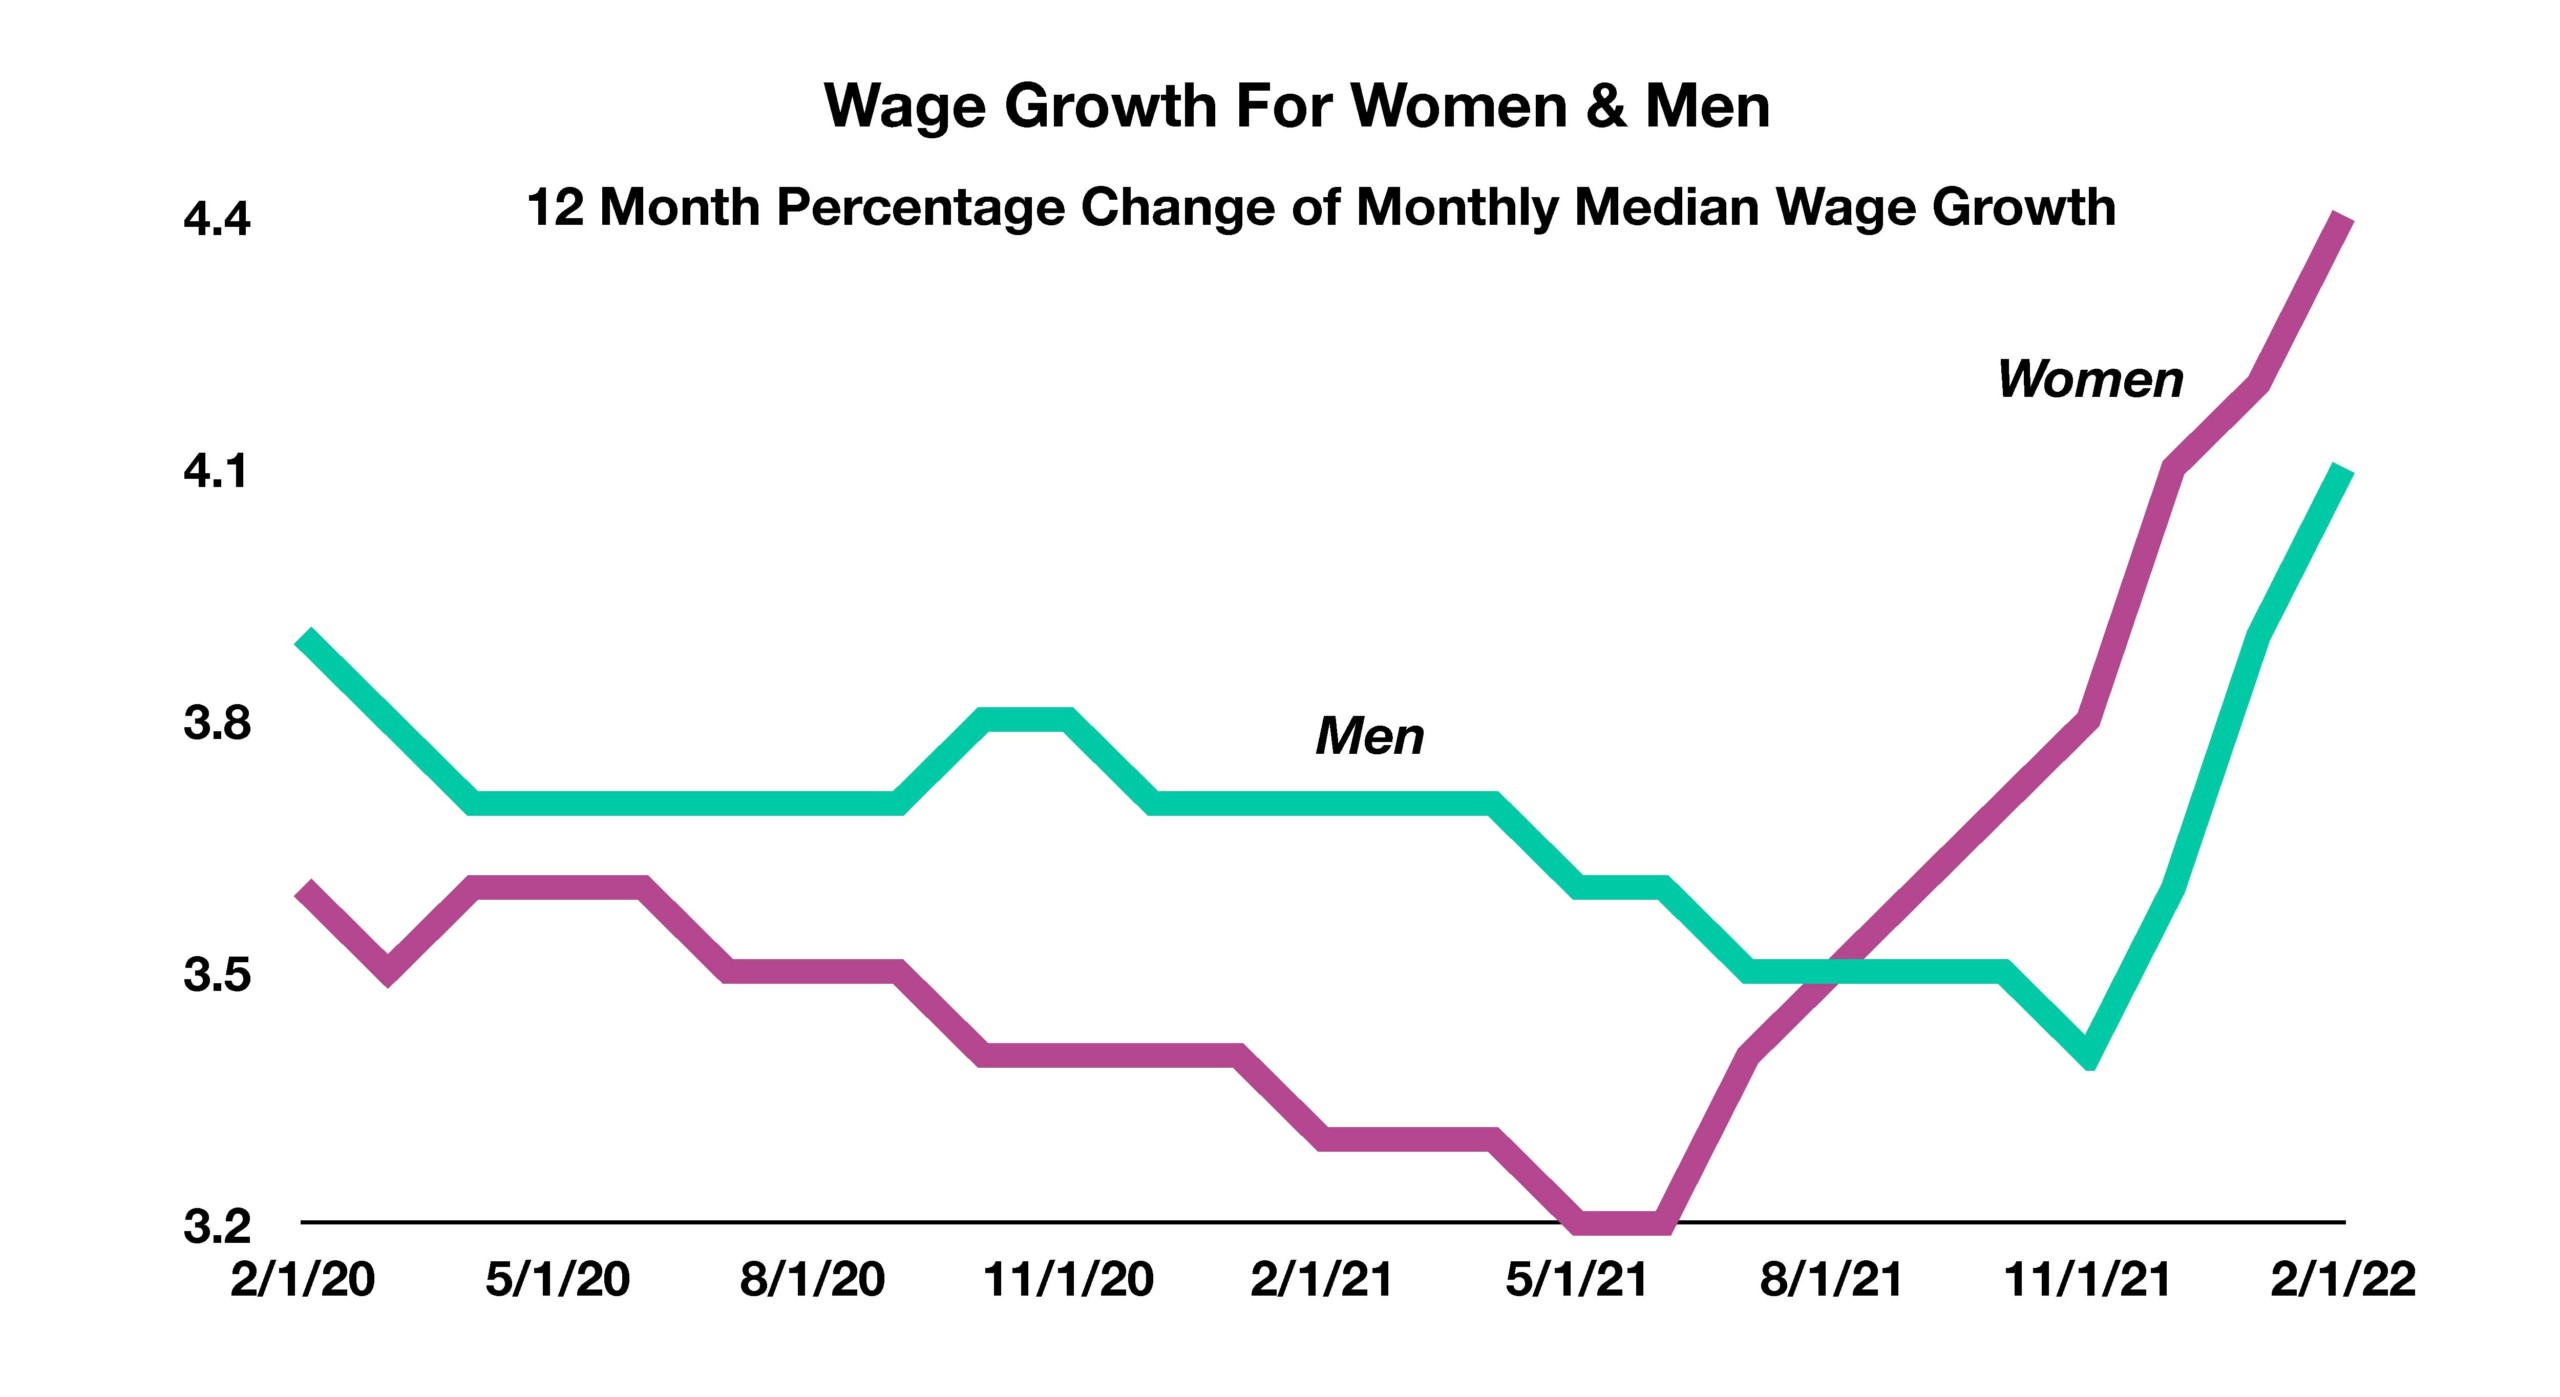
A strengthening U.S. dollar over the past few weeks has been the result of global investors seeking stability as the Russian invasion of Ukraine has progressed. Optimistically, a stronger dollar can help stem inflation as it can make imported products less costly for American consumers. The most recent inflation data revealed a 7.9% annual rate, the highest in 40 years, putting pressure on consumers as wages struggle to keep pace with heightened inflation.

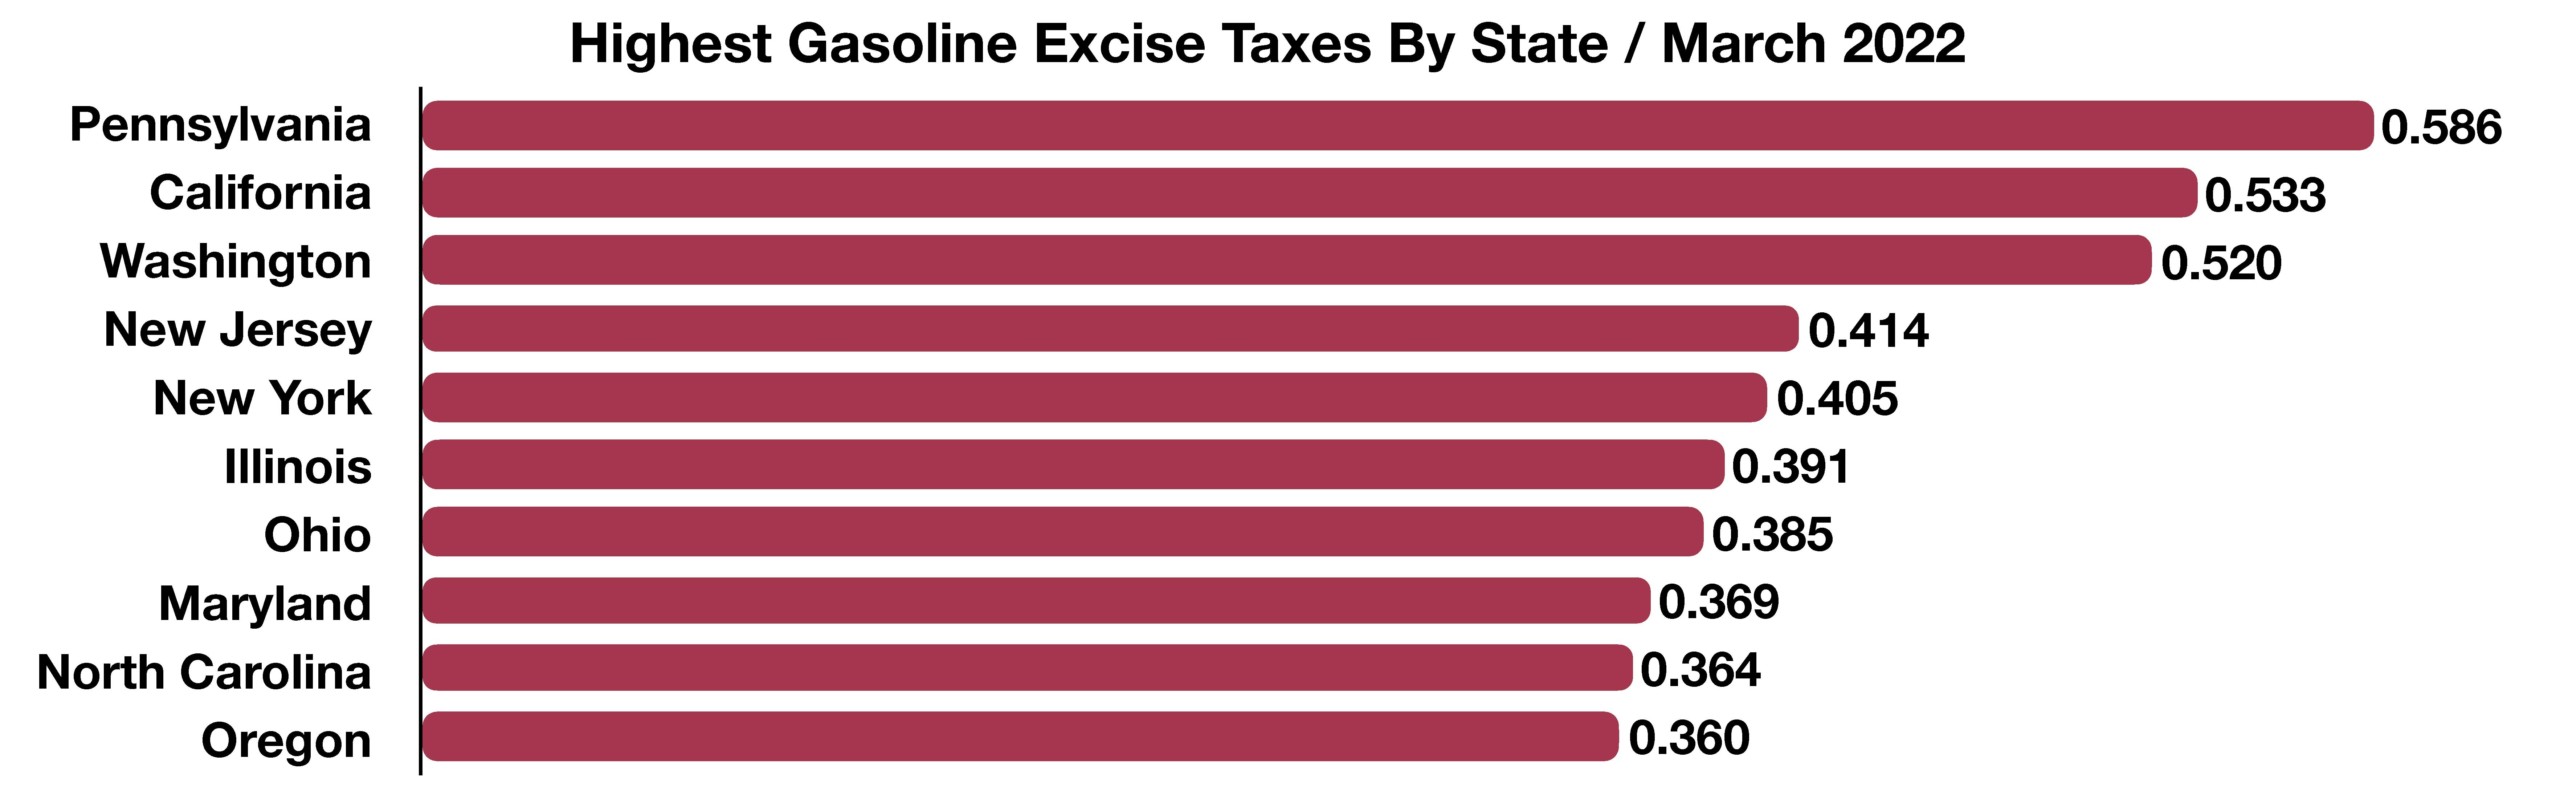
Gasoline prices have soared more in certain states than others, with excise gasoline taxes as a culprit. The federal government imposes a tax of 18.4 cents for each gallon sold nationally, yet some states impose an additional gas tax in order to raise funds for state infrastructure and highway projects. Even though the average cost of a gallon of regular gasoline nationally was $4.23 at the end of March, several states saw much higher prices due to additionally imposed excise taxes. (Sources: EIA, Federal Reserve, FreddieMac, U.S. Treasury)

 
Wages for females were up 4.4% from a year earlier versus a 4.1% increase for men

Stocks Have A Tough First Quarter – Equity Overview

The yield on the 10-year Treasury bond rose above the S&P 500 Index yield in March, meaning that the 2.32% yield on the 10 year Treasury bond is more than the 1.32% dividend yield for the S&P 500 Equity Index. Some analysts believe that current earnings estimates for the S&P 500 Index, which represents a wide swath of the equities market, may be distorted. Almost all of the growth in 2022 earnings for the index since the beginning of the year can be traced to the energy sector alone. The dramatic rise in oil and energy prices have propelled profits for oil and energy companies, which aren’t representative of other sectors.

Major equity indices recouped some ground in March, with the S&P 500 Index , Dow Jones Industrial Average and the Nasdaq all having a positive month. First quarter returns were not as generous, as all three indices saw negative performance with the worst quarter in two years. Some analysts are skeptical if an upward trajectory will continue, while others see fundamental optimism surrounding earnings and economic growth, both of which affect stock prices. (Sources: S&P, Treasury, Dow Jones, Nasdaq)

Rates On The Rise – Fixed Income Overview

Global bond yields rose in March as European and Asian central banks concurrently raised rates to help stifle global inflation. The Fed began to raise rates in March, with its first of perhaps six additional increases this year. Even though the increases are minimal, each increase affects the overall bond market. Treasury and corporate bond yields rose following the Fed’s move, with the anticipation of a continued higher rate environment towards the end of the year.

Shorter term Treasury bonds have begun to yield more than some longer term Treasury bond maturities. Known as an inversion, economists and bond analysts view such a dynamic as indicative of a recessionary environment sometime in the future. (Sources: Treasury, Federal Reserve)

Women Getting Bigger Pay Raises Than Men – Labor Market Update

The pandemic derailed many working families, keeping family members home with children as schools and daycares were shuttered. Many mothers stayed home to care for children and other family members, with many even leaving their jobs. Data from the Atlanta Federal Reserve found that women have been seeing higher wage increases than men over the past few months.

Wages for females were up 4.4% from a year earlier versus a 4.1% increase for men during the same period. The February data marks six consecutive months that female wages have outpaced male wages, a dramatic deviation from traditional trends. The data also found that women switching jobs are also seeing larger pay increases than men switching jobs. Women are also more likely to work part-time than men are, thus having more flexibility in planning for family and personal time. (Sources: Dept. of Labor, Atlanta Federal Reserve; Labor Report First Look)

 
21.5% of the Consumer Price Index is composed of food and energy expenditures

Food & Gasoline Making Up More Of Consumer Expenditures – Consumer Inflation

Food and energy have become the two fastest rising expenses for consumers nationwide, as well as representing a larger proportion of total living costs. Currently, 21.5% of the Consumer Price Index (CPI) is composed of food and energy expenditures, where the cost of groceries alone were 6.5% higher and the price of gasoline 50.8% higher than a year ago.

The concern that many economists have identified is that as millions of Americans are spending more on food and energy, they have less to spend on what they’d truly desire or want, also known as discretionary goods. As funds for discretionary items become scarce, economic growth suffers as sales of cars, furniture, clothing, and dining out become less affordable for millions of consumers.

Historically, food and energy prices have always been very volatile, making up more or less of consumer expenditures over time. Where consumers live and how old they are also dictates how influential components of the CPI are. Gasoline for example is less expensive in Oklahoma than in California, and seniors may not spend any funds on education but may spend more on medical expenses. (Sources: Dept. of Labor, BLS)

What Is Stagflation – Inflation Overview

Becoming more of a topic throughout the financial media is stagflation, characterized as an environment with minimal economic growth, inflation, and elevated unemployment. The last time the U.S. experienced stagflation was in the late 1970’s and early 1980’s, with only a small portion of consumers remembering what it was like.

Many economists believe that the inflation we are experiencing today is driven by supply constraints and not driven by heightened consumer demand. Traditional periods of inflation have always evolved from excessive consumer demand supported by expanding wages. Currently, wages are not keeping up with inflation, thus producing diminishing incomes and consumer purchasing power.

Should wages fail to keep up with inflation, and economic growth begin to falter, then the risk of stagflation increases. Unemployment may increase concurrently should companies decide to reduce staff and cut positions as an economic slowdown sets in. (Source: Federal Reserve Bank of Kansas City)

 
RMDs can affect taxes on social security benefits

Tax On Social Security In Retirement – Retirement Tax Planning

A prudent and effective tax strategy during your employment years will mostly likely need to be modified in retirement. Once earned income ceases and income from retirement plans, investments, and Social Security commences, tax liabilities change.

The impact of the changes is primarily driven by the assets that we have little tax control over once we reach 72 (70 ½ if you reach 70 ½ before January 1, 2020) which include IRAs, 401k plans, and pensions, which triggers RMDs (Required Minimum Distributions).

Distributions from tax deferred retirement accounts such as an IRA or a 401k are generally taxed at the ordinary tax rate. Distributions from a Roth IRA or Roth 401k are income tax free as long as the account has been opened for at least five years and the account holder is 59.5.

Investment income such as stock dividends and bond interest are taxed differently, especially when they are held outside of a retirement account. Realizing gains on stocks that have been held for one year or more can be taxed at a more favorable rate than the ordinary rate. Interest on bonds and gains realized on short-term positions less than one year are taxed at the ordinary rate.

Retirement also introduces us to Social Security which, contrary to popular belief, can be taxed. Eligibility for Social Security benefit payments begins at age 62, but can be postponed until age 70. A key determinant as to when to start receiving Social Security may be contingent on the amount of retirement assets in retirement accounts subject to RMDs. This is where tax strategies can vary dramatically.

Retirees with excessive assets in retirement accounts subject to RMDs and with non-retirement investment income may want to confer with a tax professional to help determine when to take Social Security. Conversely, retirees with minimal assets in retirement accounts and investments may have little concern about paying taxes on their Social Security benefits. The IRS determines if and how taxes are owed on Social Security by the “provisional income” measure. Provisional income includes gross income, tax-free interest, and 50% of Social Security benefits. If the provisional income is above a certain amount, then a portion of the Social Security income becomes taxable.

One way to potentially lower taxes in retirement is to start taking distributions from tax-deferred accounts before it’s required.  Again, once you reach age 59½, you can withdraw funds from those accounts without paying the 10% early withdrawal penalty.  The withdrawals are still taxed as ordinary income, but over time they reduce the size of tax deferred accounts, and thus the size of your RMDs.  Another reason to access those funds before 72 is that it could help you delay taking your Social Security benefit, which increases in size the later you take it, up to age 70.

Another strategy for reducing the potential tax consequences of RMDs is converting a traditional IRA or 401(k) plan into a Roth IRA before the age of 72. A Roth conversion may make sense when you’re certain you’ll be in a higher bracket when you eventually withdraw the money, which is often the case once RMDs and Social Security are factored in. (Sources: Social Security Admin., IRS, Tax Policy Center)


What Commodities Have Been Most Affected – Global Dynamics

Global commodity prices have experienced extreme volatility since the inception of the Russian invasion of Ukraine. Of concern is that many of the affected commodities are essential to food production and industrial manufacturing worldwide. As exports of some of these commodities from Russia and Ukraine have cratered since the war began, supply issues have become critical and prices have rapidly risen.

Food related commodities such as wheat and fertilizer have risen substantially, raising food production costs to developed and poorer, emerging economies already struggling with food shortages. Metals such as nickel, palladium, aluminum and copper are widely used in manufacturing and industrial production, affecting the technology and automotive sectors. (Sources: World Bank; International Energy Agency; and OECD Agricultural Outlook database)


Top Oil Producing & Oil Exporting Countries – Global Oil Market

Global geopolitical events have historically affected oil and gasoline prices worldwide, as production and supply issues evolve. As the largest oil producer in the world, the Unites States accounts for roughly 20% of total world production. Saudi Arabia accounts for 12% and Russia accounts for 11% of total world production. Even though Russia only produces 11% of total production, it accounts for over 10% of total world oil exports, making it one of the largest exporters of oil.

With oil production at nearly 19 million barrels per day, the United States produces nearly double what Saudi Arabia and Russia produce each day. Countries producing much less demand larger imports of oil in order to satisfy consumption, such as China.

Over the past twenty years, the U.S. has become nearly non-reliant on foreign oil, essentially producing what it consumes. Some analysts believe that the U.S. may be more immune from the Russian conflict than other countries, whose reliance on Russian oil exports is critical.

The United States does import oil from Russia as well as other countries in order to meet the country’s average daily consumption of roughly 20 million barrels. Imports from Russia have averaged about 22 million barrels per month, about the same amount the U.S. produces in a single day. (Sources: IEA, Dept. of Energy)


Why Such A Drop in Consumer Savings – Consumer Behavior

Consumers are saving the lowest amount in four years as stimulus assistance funds and generous unemployment benefits have gradually evaporated, encouraging consumers to tap their savings at an accelerating pace.

The drop in savings has also been prolific for those nearing retirement. As markets have pulled back, so have retirement fund values, elongating the retirement threshold for many.

Savings rates rose dramatically in 2020 as billions of dollars in stimulus relief payments made their way into consumer accounts. Federal Reserve data found that households spent only 40 percent of their payments, used 30 percent to pay down debt, and saved about 30 percent on the initial round of stimulus payments. The spectacular rise in the savings rate to nearly 34 percent in April 2020, was a validation of how much of the payments went towards savings.

As additional relief programs along with generous unemployment benefits became effective, the savings rate remained elevated through the end of 2021. The most recent data show that the savings rate dropped to 6.9 percent in November 2021, lower than where it stood at roughly 7.5 percent before the pandemic began. (Source: U.S. Bureau of Economic Analysis, St. Louis Federal Reserve Bank)


Where Are Home Prices Headed – Housing Market Update

After rising consecutively every quarter since the middle of 2020, housing prices have started to pullback. Limited inventory, migration to rural areas, extended low mortgage rates, and material supply issues have all contributed to elevated home prices over the past two years. The most recent data available by the St. Louis Federal Reserve show a decrease in the median sales price of houses nationwide to $408,100 in October 2021, a drop from $411,200 the previous quarter.

Affordability has become a grave issue for younger homebuyers, even with record low mortgage rates, as inflated prices have forced many to rent until prices retract.

As the Fed readies for a rate increase in March, it will also be selling millions of dollars in mortgage bonds from its balance sheet in order to help mitigate inflationary pressures. Many analysts believe that the Fed’s actions will directly influence mortgage rates to rise, possibly enough to stifle rising housing prices. A growing consensus seems to believe that housing prices will be pressured lower as additional inventory becomes available and as rates rise with the Fed’s actions. (Source: St. Louis Federal Reserve Bank)


College Expense Planning

Important Age Limits When Parents Send Kids Off To School – College Expense Planning

Auto insurance

Kids can stay on their parents’ auto insurance even if they have moved out and they’re away at school and still listing the parent’s home address as their primary residence. In addition, children not enrolled in school, considered an eligible dependent (insurers have different definitions), still drive a vehicle owned and insured by a parent, are eligible to stay on their parent’s insurance.

If an adult child has a driver’s license and is living in at home, then normally your auto insurance company may require that she or he is listed on your policy, regardless of their age.

People living in the same household have access to the insured vehicles, so insurance providers want all licensed household members placed on your car insurance policy. This allows your auto insurance company to look at all drivers’ risk factors and calculate car insurance rates accurately.

Health Insurance

Per federal law, a child can remain on their parents’ health insurance until their 26th birthday in most states. There are no restrictions before then, so the child is eligible for coverage under their parent’s plan even if married, and/or not in school.

Claim As Dependent For Taxes

The Federal Government allows you to claim dependent children until they are 19. This age limit is extended to 24 if they attend college. If your child is over 24 but not earning much income, they can be claimed as a qualifying relative if they meet the income limits and/or if they are permanently disabled. In order to be claimed as a dependent, a child cannot have a gross income of more than $4,300 in tax year 2021 or 2022. (Source: IRS)