August 2016

Macro Overview

Macro risks are still prevalent throughout the world as the effects of Brexit and terrorism continue to be ongoing concerns. U.S. markets have been resilient to the uncertainties, as major U.S. stock indices reached new highs in July.

Some believe that the outcome of the EU vote, as well as the sentiment in Britain shortly before the vote to leave the EU, has many similarities to the U.S. presidential race. Key election issues and how they may affect the economy include: NAFTA, immigration, terrorism, and banking regulations such as Glass-Steagall and Dodd-Frank.

The presidential campaign has brought about the suggestion of reforming existing regulations affecting the banking and financial services industry. Some candidates argue for the repeal of Dodd-Frank, regulations put in place during the current administration to regulate banking activity. The problem has been that the costs of the new regulations have inhibited smaller banks and credit unions. Some candidates lobbied to bring back legislation known as Glass-Steagall, put in place during the depression in order to prevent banks from combining financial services, investment banking, and loans simultaneously.

Economic growth, measured as GDP, was reported by the U.S. Department of Commerce to have increased at an annual rate of 1.2 % in the second quarter of 2016, below analysts expectations of 2.5%. The dismal GDP report was accompanied by a drop in oil prices of over 15% in July and a record low for the 10-year Treasury yield hitting 1.37%.

Upcoming economic data for the U.S. may influence the Federal Reserve to act on raising rates rather than waiting any longer. Analysts believe that a rate increase by the Fed before the end of 2016 based on U.S. economic data may be a mistake. Rates in Europe and Japan remain in negative territory due to the uncertainty of growth within the EU and the expected derogatory effects of Brexit on global business transactions. Fed members decided to leave interest rates unchanged during their July meeting, stating that it was prudent to wait for more data following the consequences of Britain leaving the EU.

Banks in Italy have become the latest of concerns in Europe as souring loans are being recognized throughout the Italian banking sector. As the third largest economy in the EU, Italy’s banking sector is prone to a crisis that could have dire consequences for the country and neighboring trading partners. (Sources: EuroStat, Dept. of Commerce, Federal Reserve, European Central Bank)

 
The UK Has Financing Needs Nearly Twice The Level of the U.S. and France

Effects of Brexit On The British Pound – Currency Update

The pound has plunged 14% against the U.S. dollar since the UK voted to leave the European Union on June 23. Since the start of the year, the pound is down about 12% and trading at its lowest levels since 1985. The possibility of the UK experiencing negative consequences with EU relationships, as well as a lingering recession being triggered by an exit from the EU, has dampened consumer confidence throughout Britain and held back any further expansion plans for companies. Conversely, the depressed pound has made Britain a tourist destination for travelers whose currencies have risen versus the pound, such as for Americans and Canadians.British Pound

The rating agencies have all made revisions to Britain’s debt since the EU vote, including downgrades, making it more expensive for the country to borrow money. Standard & Poor’s lowered its rating and warned that Brexit will weaken the predictability, stability and effectiveness of British policymaking and deter foreign investment in the UK. S&P said that the country’s banking system, which is a vital component of the economy, is very susceptible to EU fallout leading to more possible downgrades. The UK now has a more unfavorable rating from S&P than the U.S. S&P famously lowered the U.S. rating by one notch to AA+ in 2011, setting off financial and political disarray. The UK has the highest financing needs among all 131 countries that Fitch rates, at nearly twice the level of the U.S. and France. (Sources: S&P, Fitch, Moody’s, Reuters)

Richest Person Ever In the World – Historical Note

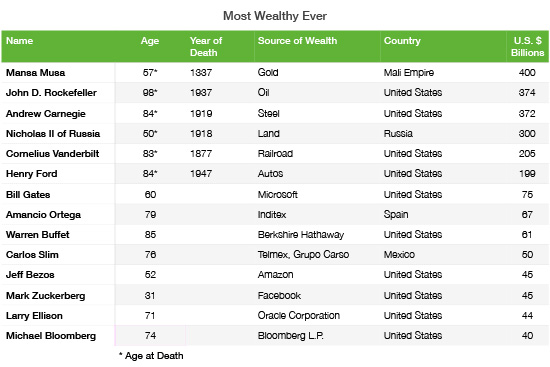
Over the centuries, industrial leaders evolved who were able to generate tremendous wealth and in some instances popularity. Yet even with the onset of technology over recent decades, it has been difficult for any modern day billionaire to become as rich as Mansa Musa, the 14th century emperor of the Mali Empire. The value of Mansa Musa’s fortune calculated in today’s value is estimated to have been in excess of $400 billion. Mansa Musa was the African ruler of an empire that once covered Western Africa. In the 14th century, Mali produced about half of the world’s gold from three highly productive mining regions. Bags of gold dust functioned as money in the kingdom, while nuggets were stored in the treasury as the property of the emperor. Wealth in the modern age is primarily stored in stocks, bonds, metals, and real estate.Billionaire Rankings

In the 19th & 20th centuries, the free market allowed entrepreneurs born to no wealth the ability to build and accumulate wealth. The free market and capital structure of the United States helped foster the establishment and wealth of industrialists at the turn of the century. Vanderbilt, Carnegie, Ford, and J.P. Morgan all developed enormous industries and wealth that became a backbone for the country’s economic and industrial infrastructure.


The Yield on the 10-Year U.S. Treasury Hit A Record Low of 1.318 % In July

Equity Update – Domestic Stock Markets

Major U.S. stock indices reached new highs in July as earnings reported for companies in a host of industries were better than expected, leading to upward pricing pressures.

The S&P 500 Index staged a powerful rally following the June 27 referendum vote in Britain, sending the index to new highs. Since the run, equity markets have been idle, as though it was taking a break. Analysts view such a “break” optimistically, since the health and sentiment of the market might very well be positive. Also of note is the lack of volume equity markets have seen this summer, with volume off about 15% compared to July 2015. Again, analysts see this dynamic optimistically since pending activity may be sitting idle until later in the year.

The Institute for Supply Management export data improved this past month, which has been a positive indicator for U.S. equity markets leading to re-acceleration of earnings growth rates.

Small-cap stocks have outperformed larger-cap stocks since the beginning of the year, as earnings have exceeded expectations and low interest rates have made debt payments affordable. As of the end of July, 64% of the companies that have reported earnings had beaten estimates, a positive note heading into the second half of the year. (Sources: S&P, Bloomberg)

Yields Head Lower In July – Global Fixed Income Review

The yield on the 10-year U.S. Treasury fell to a record low of 1.318 percent in early July, sending bond prices higher throughout the fixed income markets. Bonds have continued their rally since the beginning of the year as the Fed has held off on raising rates, while central banks in Japan and Europe have maintained unprecedented low rates.

Repercussions from Brexit channeled money towards the perceived safety of German government bonds in July, as Germany became the first country in the EU to sell 10-year government bonds with a negative yield at auction. A negative yield means that investors are willing to essentially pay Germany in exchange for holding funds in German bonds. Germany sold €4.8 billion ($5.3 billion) of 10-year notes at an auction, with a yield of -0.05 %.10 Year Tsy Bond Yield

As of this past month there has been a continuous decline in long-term interest rates for 35 years, spanning from 8.3% in 1991 to 1.36% in July for the 10-year U.S. Treasury. Some bond analysts estimate that any continued decline in yields has become much less probable.

With the Fed and its monetary stimulus efforts at capacity, many economists believe that this leaves ample room for fiscal stimulus in the form of lower tax rates. The presidential campaign has brought about the topic of lowering taxes and perhaps at a timely juncture that would help stimulate economic growth where the Fed may not be able to any longer. (Sources: Federal Reserve, Bloomberg)

 
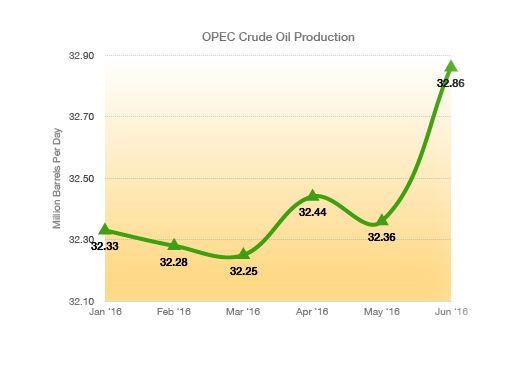
OPEC Currently Pumps Over 32 Million Barrels Per Day

OPEC Pumps Up Oil Production – Oil Industry Update

As oil prices rebounded throughout May and June, drillers restarted idle rigs in hopes of catching higher prices as they evolved. Unfortunately, the upswing in production and drilling was accompanied by growing supplies and less consumption, thus resulting in a supply glut.

As a group, OPEC represents the world’s largest producer of oil, with Saudi Arabia being the single largest producer at over 10 million barrels per day, roughly a third of total OPEC production.OPEC Production

The dramatic decline in prices in July alone are a testament to the commodity’s volatility, subject to supply and demand dynamics worldwide. Yet even with such an efficient market, as claimed by Saudi Arabia, producers tend to get it wrong as to what the actual demand might be. Some oil analysts believe that OPEC leaders, specifically Saudi Arabia, may have increased production knowing that additional demand was not yet there.

Crude oil prices traded as high as $107 per barrel as recently as June 2014, and now pulling back to near $40 as of the end of July. (Sources: OPEC Monthly Production Report, OPEC Secretariat)

Stagflation On The Horizon – Monetary Policy

Former Fed Chairman Alan Greenspan said that the U.S. may be heading toward stagflation, a slow-growth economy coupled with rising inflationary pressures. Greenspan also said that there seems to be pockets of inflation even though low productivity is prevalent in the economy.

Stagflation is an economic phenomenon when there is slow or stagnant economic growth at the same time as rising inflationary pressures. The 70’s were a period when rapidly rising fuel prices coupled with dismal economic growth, led to stagflation. This same scenario occurred in the first two years of the 80’s, until both monetary and fiscal policies were enacted that halted destructive inflationary pressures and curtailed taxes to boost economic activity.CPI-GDP 1970-2016

Inflation is measured by the CPI (Consumer Price Index) and economic growth is gauged by GDP (Gross Domestic Product), which are both released by the Department of Commerce each month. As a barometer of general prices throughout the country as well as current economic activity, both indices help identify any possible stagflation scenarios. (Sources: Depart of Commerce, BEA)