August 2017
Market Update
(all values as of 03.31.2023)

Stock Indices:

Dow Jones 33,274
S&P 500 4,109
Nasdaq 12,221

Bond Sector Yields:

2 Yr Treasury 4.06%
10 Yr Treasury 3.48%
10 Yr Municipal 2.11%
High Yield 8.31%

YTD Market Returns:

Dow Jones 0.38%
S&P 500 7.03%
Nasdaq 16.77%
MSCI-EAFE 7.65%
MSCI-Europe 9.89%
MSCI-Pacific 3.61%
MSCI-Emg Mkt 3.55%
 
US Agg Bond 2.95%
US Corp Bond 3.50%
US Gov’t Bond 3.16%

Commodity Prices:

Gold 1,977
Silver 24.01
Oil (WTI) 80.60

Currencies:

Dollar / Euro 1.08
Dollar / Pound 1.23
Yen / Dollar 132.60
Canadian /Dollar 0.73

Macro Overview

Markets seemed undeterred by political indecisiveness in Washington surrounding healthcare reform, which could affect upcoming tax reform in the fall that is hinged on the ability of passage by Congress. Even though lawmakers are coming under escalating pressure to demonstrate legislative progress, the inability of the House to pass healthcare legislation didn’t hold equity markets back from achieving higher levels.

 A political debate has begun behind mundane media noise, the debate to raise the federal debt ceiling in order to continue funding government expenses and operations. The debt ceiling, formally known as the statutory debt limit, is the country’s credit limit, which is a legislative restriction on the amount of national debt that can be issued by the Treasury.

The Fed said that it would start paring its $4.4 trillion balance sheet “relatively soon”, language interpreted by Fed watchers to mean possibly beginning in September. This continues to be a critical focal point for government bond traders gauging how markets will absorb the vast amounts of debt efficiently and without disturbing volatility. The Fed also reiterated that future rate hikes would be gradual, thus stemming the probability of erratic rate increases.

Global central bank chiefs and various market analysts believe that current low volatility may be hiding risk in the form of asset inflation engulfed within a low inflation environment. The concern is that investors and central bankers may be viewing circumstances from different perspectives. Low interest rates and international central bank asset purchases have greatly reduced volatility in the global markets.

The synchronized global increase in interest rates is elevating from unprecedented low levels, meaning that it may take some time before rates reach so-called normalized levels.

Oil prices rose after Saudi Arabia cut oil exports and OPEC said it would enforce production cuts among OPEC members. Higher oil prices, as tracked by the West Texas Intermediate Index (WTI), enhance economic activity in various oil related regions of the United States.

The Department of Labor reported that there were 222,000 new jobs in June, but more people were actually looking for work in June, lifting the unemployment rate to 4.4%. (Sources: Federal Reserve, OPEC, DOL, house.gov)

 
The IMF Estimates That The U.S. Dollar Is 15% Overvalued

Lower Dollar Helps Earnings Increase – Domestic Equity Overview

A weakening dollar is expected to boost corporate earnings for U.S. multi-national companies as products sold overseas become less expensive and more competitive due to a cheaper dollar.

Earnings for the banking sector reported in July came in better than expected as banks benefited from a rising rate environment. Profitability for banks tend to increase as rising rates allow them to charge higher interest rates on loans.

It is expected that large technology companies may face regulatory scrutiny involving taxes, data privacy, and competition following a multi-billion dollar fine imposed by European regulators on Alphabet (Google).

Industrial sector stocks saw stronger earnings in their most recent release, leading analysts to conclude that economic growth is expanding slowly throughout the U.S. Industrial companies provide the infrastructure and materials essential for physical expansion.

Data from the NYSE shows that current margin debt levels, $540 billion at May end, are nearly double of what they were at the market peak in 2000. (Sources: Bloomberg, Reuters, S&P, NYSE)

IMF Agrees With Trump On Dollar Valuation – Currency Overview

The International Monetary Fund (IMF) releases a report each year detailing its assessment of monetary policies globally and identifying imbalances affecting global growth.

Discrepancies as to how currencies are valued has been a focal point for President Trump, as various countries have been tagged as currency manipulators by the administration. The IMF has concurred with such complaints and has drafted policies to strictly enforce currency valuation policies. China, Germany, and Japan have been accused by the administration of devaluing their currencies in order to boost their exports at the disadvantage of U.S. companies.

The most significant misalignments have been found in emerging market currencies whose countries benefit when their currencies devalue, making their exports more competitive worldwide.

In line with President Trump’s suggestion that the U.S. dollar is overvalued, the IMF estimates that the dollar is 15% overvalued relative to other currencies, meaning that U.S. products are less competitive globally. Saudi Arabia’s currency is also estimated to be overvalued by 20%, partly because it is pegged to the U.S. dollar.

South Korea, Singapore, and Mexico currently have the most undervalued currencies, giving them a direct trade advantage over other countries. (Source: IMF External Sector Report 2017)


19% Of 70-74 Year Olds Are Still Working

Fed Says It Is Ready To Sell Its Bonds – Fixed Income Overview

Global bond yields rose on the expectation that central banks around the world have agreed to start removing accommodative measures. The yield on Germany’s 10-year government bund (bond) has risen from a negative yield last year to 0.58% in mid-July.

The U.S. corporate bond market continues to provide funding for the mega merger deals in the equity markets. The issuance of such corporate debt at low rates is supported by the unparalleled demand for U.S. dollar denominated debt. Even at ultra low rates, institutional buyers such as pension plans and mutual funds have an ongoing voracious appetite for fixed income assets that offer consistent income and return of principal.

As the Fed prepares to start unloading portions of its massive $4.4 trillion inventory of government bonds, traders are eager to see how well markets will absorb the extra supply and what disruptions might occur. (Sources: IMF, Federal Reserve, Bloomberg)

More Americans Working Past 70 – Demographics

Workers who were either poor savers or who perhaps experienced a dramatic life crisis are finding themselves short on funds in their retirement years. Some workers who did plan accordingly, didn’t plan to live as long and be as healthy as they are, thus creating revisions to retirement plans late in their careers. As health and medical science have advanced over the past few decades, so has the lifespan of American workers.

Many Americans that retired with the notion that Social Security would suffice in their elder years, came to the realization that Social Security benefits alone weren’t enough. A part-time job and even full-time menial jobs at minimum wage levels have become supplemental income for many retired Social Security recipients.

Almost 19% of people 65 and older were working at least part-time in the second quarter of 2017, the highest in 55 years. The share of older people in the workforce is higher than any point since before the creation of Medicare.

Baby boomers are increasingly ignoring the traditional retirement age of 65, with 32% of Americans age 65 to 69 still employed. The Bureau of Labor Statistics also found that a growing number of seniors are unable to retire even past 70 years of age. The most recent data shows that 19% of 70 to74-year olds were still working, up from 11% in 1994.

The irony of the data released shows that seniors who find it easier to continue working are the ones that are healthy, well educated, and highly skilled, tend to be the ones that are least likely to need the money. (Sources: Bureau of Labor Statistics, Social Security Administration)


The UN Projects That The World Population Will Exceed 11 Billion by 2100

U.S. Beef Exports To Japan Get Hit With Higher Tax – Trade Policy Update

The single largest purchaser of U.S. beef, Japan, announced in July that it would impose a temporary 50% tariff on frozen beef coming from the United States and several other countries. The imposed 50% tariff would be an increase from the current 38.5% tariff on beef imports into the country. Japan accounted for nearly 24% of all U.S. beef exports in 2016. In response, the U.S. agricultural secretary noted that the higher tariff would likely reduce American beef exports in addition to boosting the U.S. trade deficit with Japan. 
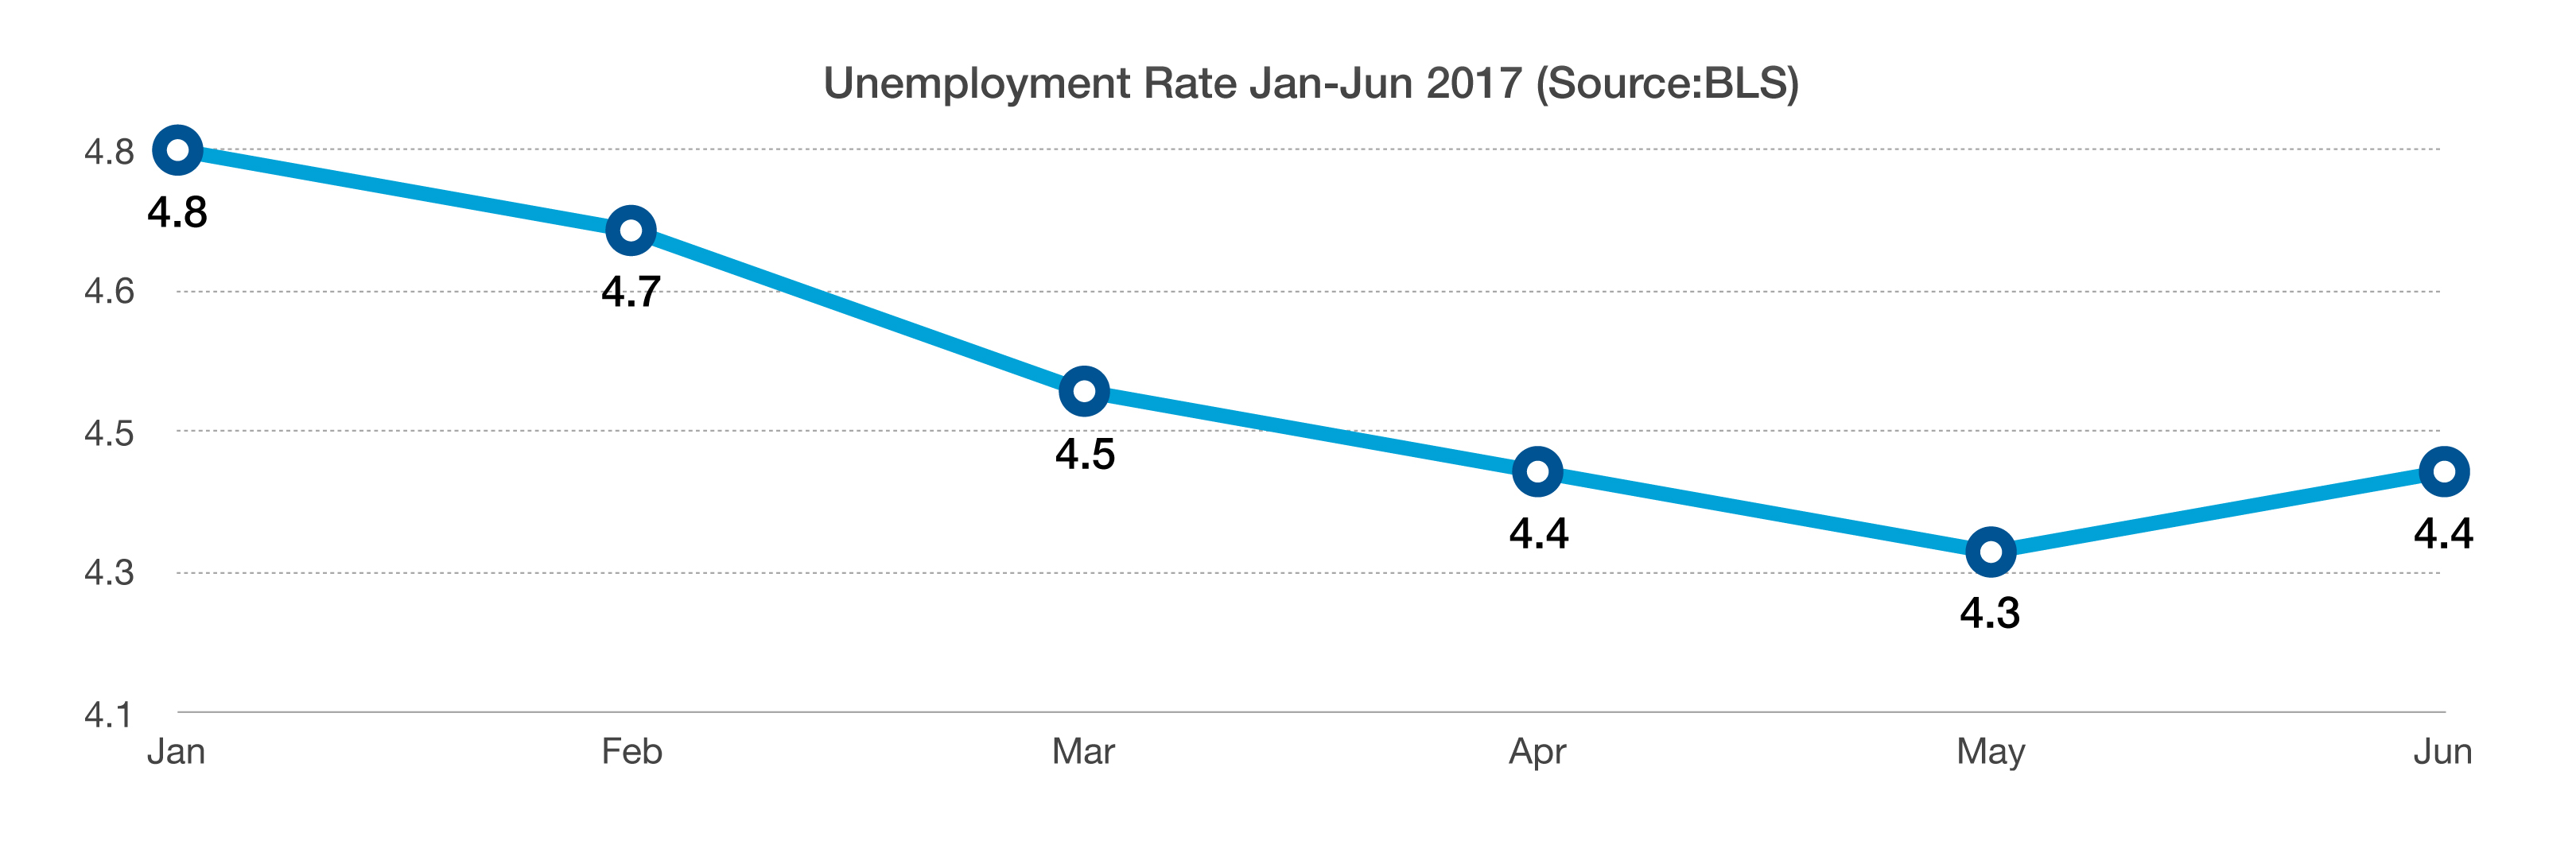
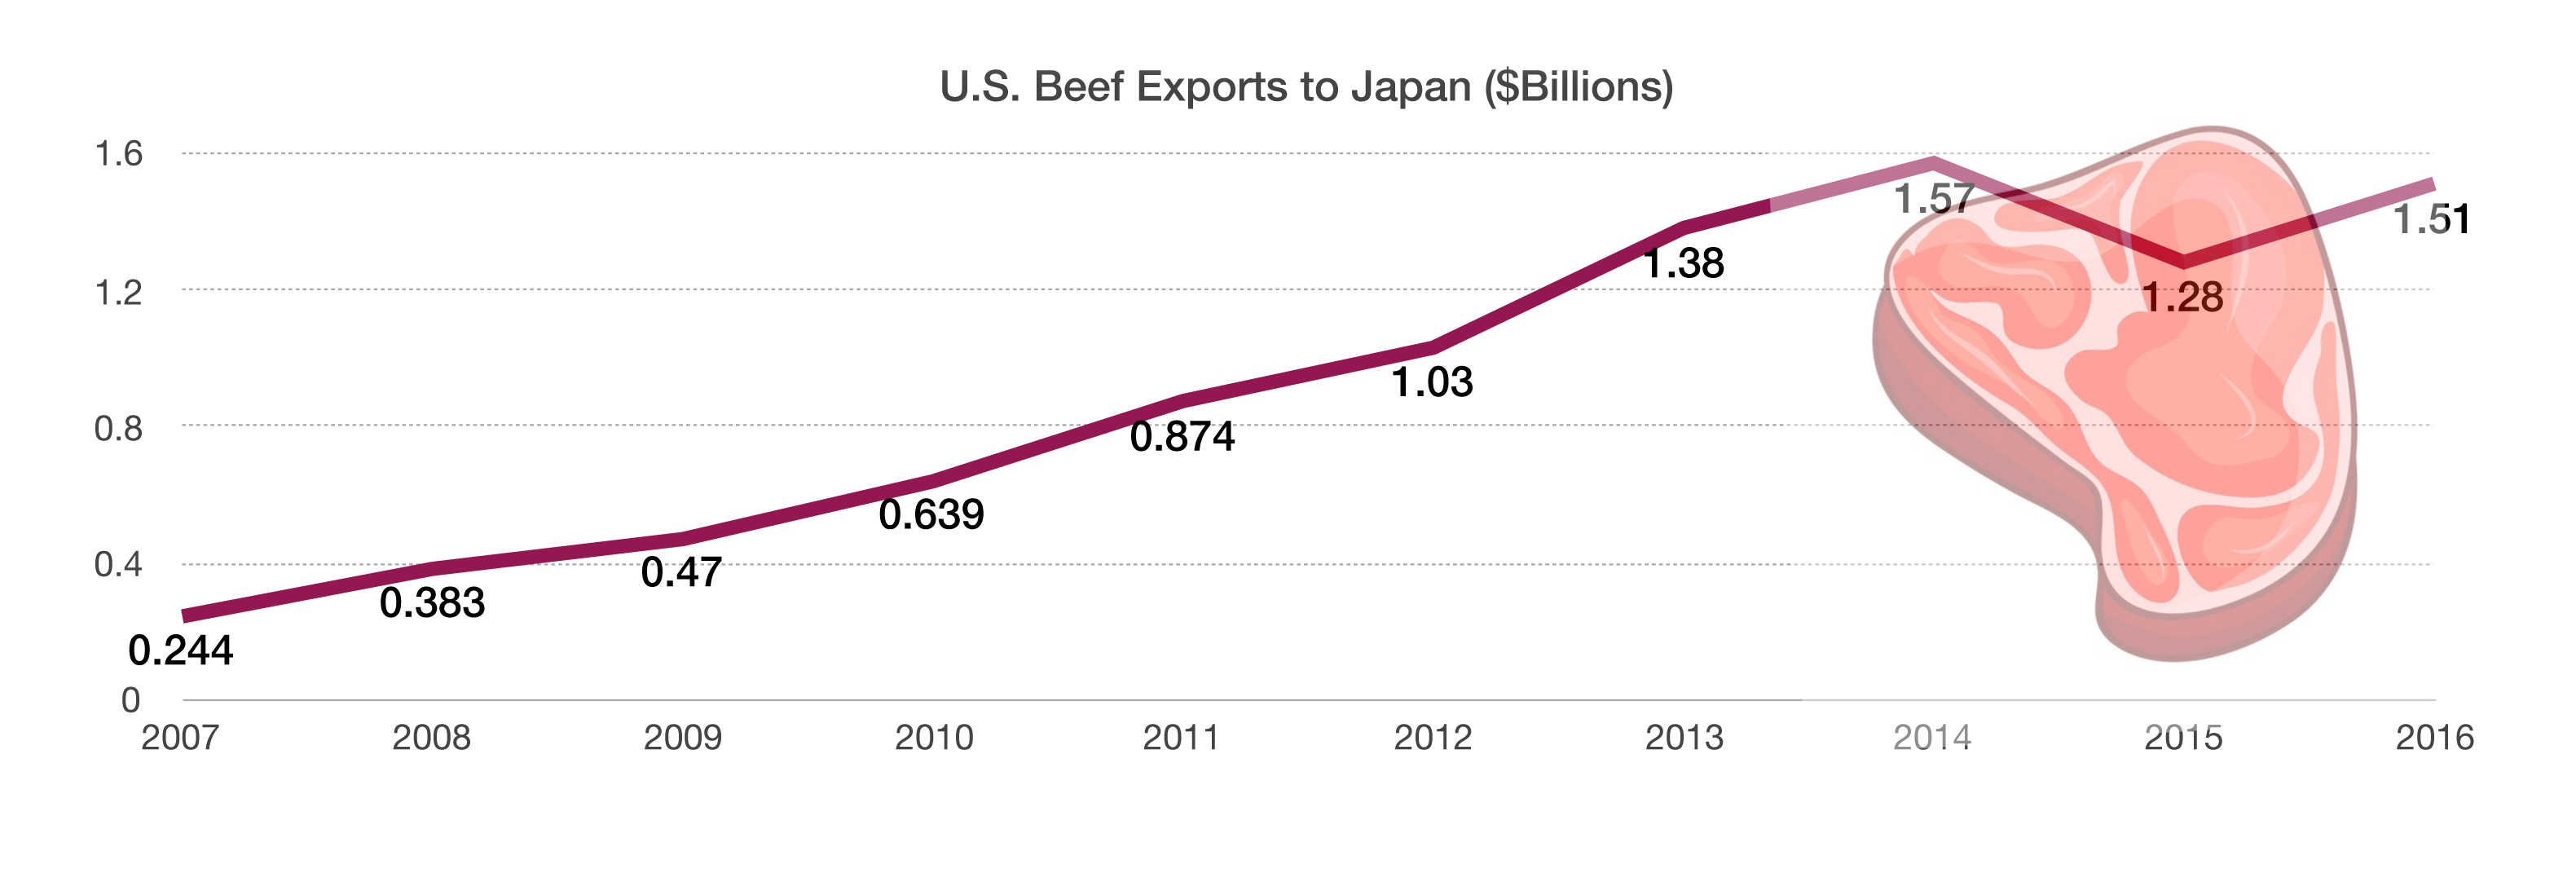
As discreet as it may seem to many, a tariff increase to 50% from 38.5%, based on 2016 export figures, amounts to a $755 million tax on beef exports to Japan. Such tariffs can stifle demand in Japan and hinder beef producers in the U.S. The Trump Administration has been quite vocal about foreign trade practices deemed unfair by the United States. (Source: U.S. Meat Export Federation)

UN World Population Forecasts – Global Demographics

Currently, the global population is roughly 7.6 billion, with the United Nations (UN) estimating it to grow to over 11 billion by 2100. In its report, UN World Population Prospects, the UN details where the growth will occur and which regions will prosper. The UN has found that world population growth is actually growing less slowly than it has in the past, thus hindering accurate population projections. Yet, the UN has historically been fairly good with its estimates and projections, taking regional characteristics into account.

The UN anticipates that over half of all global growth between 2017 and 2050 will occur in Africa alone. It also projects that growth in Asia will continue, but at a slower pace heading towards 2100. A primary factor affecting projections is fertility rates, which have been the highest in Africa, and are projected to remain the highest of any of the regions worldwide. Europe and Japan will see dwindling populations as average ages rise and population growth slows down over the next few decades. Japan, which has the oldest average age of any of the developed counties, will lose a third of its population by 2100.

The U.S. will have minimal population growth, yet is estimated to have over 447 million inhabitants by 2100, a 37% increase from its current population of 324 million. (Source: United Nations; UN World Population Prospects, 2017 Revision)


Aging Without Support (by Bob Veres)

Aging Without Support (by Bob Veres)

Probably the most forgotten minority in America is the “elder orphans”—aging retirees who no longer have a spouse (if they ever had one), no kids and no caregiver. 

According to The Gerontologist magazine, about one-third of 45 to 63-year-olds are single, and most of them never married or are divorced.  Meanwhile, about 15% of 40-44-year-old women have no children.  These statistics don’t tell the full story of a small but significant aging population who are growing older without a support network—the American Geriatric Society thinks that nearly one-quarter of Americans over age 65 lack someone to care for them if they become physically incapacitated or experience cognitive decline.  And many will; statistics show that 69% of Americans will need long-term care at some point in their lives—usually later in life.

How are these people coping?  An article in a recent issue of U.S. News & World Report says that the best advice is to plan for long-term care needs with an LTC policy and/or a home that is retrofitted for an elderly occupant.  It’s also important to make social connections and avoid being lonely.  A 2012 study found that the loneliest older adults were nearly twice as likely to die within six years as the least lonely, regardless of health behaviors or social status.  The post powerful finding was that human connection helps ward off depression.

One way to raise the connection level is to retire in a college town, where the elder orphan is surrounded by young people and can stay engaged with activities like mentoring.  At the same time, it is recommended that these people find like-minded retirees who can look out for each other.  Some have actually gone so far as to create communities that act like surrogate families.

The elder orphans need someone to speak up for them if they’re incapacitated, which means finding a friend who knows their Social Security number, keeps their insurance card, knows which medications they take, and can be designated as the durable power of attorney for health care against the day when they start losing cognitive capacity.  As a last resort, this person could be hired; an attorney who specializes in elder care law might either serve in that capacity or find a professional who is willing to do so.

Source: http://health.usnews.com/health-news/health-wellness/articles/2015/10/26/no-spouse-no-kids-no-caregiver-how-to-prepare-to-age-alone?src=usn_tw

 
Banking Retreat (by Bob Veres)

Banking Retreat (by Bob Veres)

Low interest rates and added regulation designed to head off another global financial crisis has made it more expensive and complicated to run a banking operation these days.  Gone are the heady days when banks were building 200 new brick and mortar locations a month in the U.S. market, leading up to the market top in 2008, when there were 100,000 bank branches in the U.S.—35 for every 100,000 adults, twice as many, per capita, as Germany.

Today, lenders are cutting back.  Since the financial crisis, banks have closed an average of three branch offices a day, and the pace has picked up.  In the first half of 2017, a net of 869 brick-and-mortar bank branches shut their doors.

Community organizations have noted that much of the cutback has occurred in areas where less-wealthy people live, and in rural areas there are now more than 1,100 “banking deserts” in the U.S.—defined as places where consumers have to drive at least ten miles to the nearest bank branch.  At the other end of the spectrum, half of Americans, chiefly from wealthier neighborhoods, live within one mile of their nearest bank.

The lack of banking locations hits small businesses and homeowners the hardest, since many of their lines of credit are dependent on relationships.  The local banker knows them and their character, even if their balance sheets might not be spotless.  A study in 2014 found that when branches close, new small business lending falls by 13% in the surrounding area.  In low-income areas, the impact comes in at something closer to 40%. 

Source: http://www.economist.com/news/finance-and-economics/21725596-banks-have-shuttered-over-10000-financial-crisis-closing-american?fsrc=scn/tw/te/rfd/pe

Custom Insurance (by Bob Veres)

When you think of insurance, chances are what first comes to mind is life insurance, which protects against premature death and therefore the loss of a lifetime of income.  You might also think of car insurance, which helps pay the costs of an accident, and disability insurance, long-term care insurance and homeowners’ insurance.  The underlying mathematics of these contracts, used by actuaries, involves risk pooling, where many people contribute to a large pool of assets, and then the pool of assets will pay out to a relative few people who experience a car accident, or suffer a temporary or permanent disability, or die young.  People pay a relatively small amount to be protected from relatively large catastrophes.

 
Custom Insurance (by Bob Veres)

Custom Insurance – continued (by Bob Veres)

The outlier in the insurance world is health insurance, which was theoretically designed to pool peoples’ assets so that individuals who suffered a catastrophic illness would be able to pay their hospital bills out of the common pool.  But health insurance today is basically a flat monthly fee for all of a person’s medical care, with most people receiving “benefits” every time they visit the doctor or hospital.

Recently, a number of startup insurance firms, backed by more than $700 million of venture capital, are looking for ways to apply risk pooling to other aspects of your life.  Several of them are creating on-demand insurance.  A company called Trov, recently launched in the U.S. after operating in Australia and the U.K., now features an app for quickly insuring personal and work items like laptops, smartphones and high-end cameras.

A similar system, called Cover, lets you take a snapshot of an item you want to insure, and Cover will write a policy on the spot.  New York-based Sure, another entrant, is building out a mobile app offering quick insurance quotes for things like weddings, lost baggage, flight cancellations and pet health.

Even traditional insurance markets are being disrupted.  A startup insurance company called Metromile will give you an auto insurance policy that is priced based on how many miles you drive.  If you rack up more miles than the base rate, the rate will automatically go up.  In the homeowners’ insurance space, a two-year-old company called Lemonade provides homeowners and renters insurance priced using artificial intelligence algorithms.  Hippo, based in Silicon Valley, is an online seller of homeowners’ policies with stronger protections for common valuables like home electronics.

In the life insurance field, where most policies are still sold face-to-face, a company called Ladder has raised $16 million to build a platform that will offer direct-to-consumer term insurance online.

This is almost certainly on the beginning of a revolution in one of the stodgiest areas of the global economy.  There is no questioning the benefits of risk pooling: it smooths out the potentially catastrophic bumps in the road of life.  What the startups are realizing is that there are many more kinds of bumps than the traditional insurance world is currently covering, and there are ways to gain more efficiency than the by-hand sales of traditional insurance.  It will be interesting to see where this goes. 

Source: https://techcrunch.com/2017/07/29/startups-want-to-change-what-you-insure-and-how-you-insure-it/amp/

 
Pictures That Tell a Story (by Bob Veres)

Pictures That Tell a Story (by Bob Veres)

They say a picture speaks a thousand words, and that means, to an economist, that sometimes it’s easier to communicate something complicated with a chart or a graph rather than a lot of explanatory text.

So it is with three charts and a picture, selected for the eye-opening perspective they offer.  The first, in the black outlines favored by a Bloomberg Terminal, shows the fluctuating value of an ETF that is invested entirely in the largest stocks on the Mexican stock market (blue line) vs. the American S&P 500 (green line) since the beginning of this year.

You may remember that when President Donald Trump took office, with his tough talk about trade and his promise to scuttle the North American Free Trade Agreement for something more beneficial to U.S. interests, the conventional wisdom was that the Mexican economy would hit a rough patch and the tougher trade agreements would benefit the American economy.

The month of January, when the new President took office, saw Mexican shares drop on the dire expectation that NAFTA would be ripped up and the Mexican economy would groan under the weight of tariffs.  But look what happened.  When it became clear that the campaign “promise” was nothing more than empty boasting, the Mexican market has not only recovered; it has roared ahead of the U.S. over the first six months of the year.

So much for the conventional wisdom you were hearing from pundits and Wall Street stock touts.

The second chart, in pale blue, illustrates another interesting point.  You remember the great trauma that Americans experienced in the Great Recession of 2008-9, and you might be tempted to think that even in the depths of the Great Depression, people didn’t have it any worse.

 
Pictures That Tell a Story - continued (by Bob Veres)

Pictures That Tell a Story – continued (by Bob Veres)

Au contraire!  Take a look at the left side of the chart, where the darker line represents the remarkably steep decline in total economic output across the U.S. business sector over the 11 years from 1929 to 1940.  You can see that the economy declined by a full 30%, and it took seven years before America had regained its former economic strength.

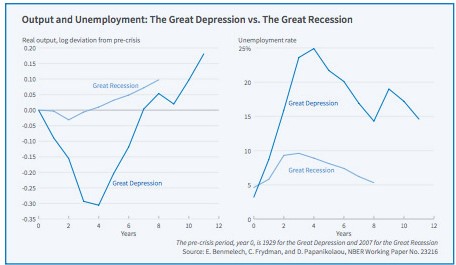
Still on the left side, notice the less bold line.  That represents the decline in GDP experienced by American citizens in the Great Recession—and you can see that the decline never even reached 5%.  Not only was the dip less traumatic, but the recovery was much faster, and the growth that is sometimes derided as “anemic” is at least steady. 

The right side of the graph portrays the unemployment rate, again with the bolder line showing the experience of the Great Depression, and the pale line showing unemployment rates during the 2008-9 Great Recession.  Once again, the people in the 1930s experienced a much tougher economy than anything more recent participants of our recession had to face.

So if you hear a grandfather say that people had it a lot tougher in the 1930s than they did in that mild rainstorm we call the Great Recession, believe them.

Pictures That Tell a Story (by Bob Veres) – continued on page 10


Join Wayne and the Radio Crew (including Dr. P) at our first Coffee Klatch.

More details to follow on Firebaugh on Finance which airs from 5 to 6pm weekdays on WFJX Fox Radio 910 AM.

Visit www.waynefirebaugh.com to let us know how you like your coffee and your conversation.


Pictures That Tell a Story - continued (by Bob Veres)

Pictures That Tell a Story – continued (by Bob Veres)

Now let’s look at the map of the U.S., which shows, in color contrast, the average weekly wages in each American state.  The darker the color, the higher the wages; the highest are found in New York, New Hampshire, Massachusetts, New Jersey, Maryland, Illinois, Washington and California. In contrast, people in South Carolina, West Virginia, Kentucky, Mississippi, Oklahoma, Arkansas, New Mexico, South Dakota, Montana and Idaho have the lowest per capita income.  What is interesting about the map is that except for Texas and Kansas, the color codings tend to look a lot like the political divide in the U.S. between red states (generally lighter colors on this map) and blue states (darker and tending to be toward the coasts.  Can politics really be that simple?

Finally, take a look at the one-hundred-trillion dollar banknote issued by the troubled African nation of Zimbabwe.  This is an example of what happens when a nation simply prints its currency in unlimited amounts in order to pay for its government activities.  This bill was actually a replacement for pre-2006 Zimbabwean dollars, and was equal to a number of the previous currency so large that there isn’t a name for it—a one with 27 zeros after it.  Yet this new bill was soon worth a fraction of a U.S. penny.

You already know the lesson here: bad, inattentive or corrupt governments produce bad outcomes.