LifeMark Securities Corp.

400 West Metro Park

Rochester, NY 14623

800.291.7570

www.lifemark.com

Market Update
(all values as of 06.28.2024)

Stock Indices:

Dow Jones 39,118
S&P 500 5,460
Nasdaq 17,732

Bond Sector Yields:

2 Yr Treasury 4.71%
10 Yr Treasury 4.36%
10 Yr Municipal 2.86%
High Yield 7.58%

YTD Market Returns:

Dow Jones 3.79%
S&P 500 14.48%
Nasdaq 18.13%
MSCI-EAFE 3.51%
MSCI-Europe 3.72%
MSCI-Pacific 3.05%
MSCI-Emg Mkt 6.11%
 
US Agg Bond -0.71%
US Corp Bond -0.49%
US Gov’t Bond -0.68%

Commodity Prices:

Gold 2,336
Silver 29.43
Oil (WTI) 81.46

Currencies:

Dollar / Euro 1.06
Dollar / Pound 1.26
Yen / Dollar 160.56
Canadian /Dollar 0.73
Please welcome the newest members of the LifeMark team
Patrick Durst – Centennial, CO Greg Atencio – Albuquerque, NM
Upcoming sales teleconference
August 16, 23, 30 @ 4PM EST Resource Credit Income Fund

Congratulations to all who have already qualified for the 2019 Leaders Cruise to Great Stirrup Cay, Bahamas and Cozumel, Mexico.

We are looking forward to seeing everyone aboard the
Norwegian Epic in March 2019.

It will be here before you know it. You have until December 31st to qualify.

Qualifications are:

$250,000 in GDC
Balcony stateroom for you and a guest

$100,000 in GDC
Studio stateroom (or ½ of balcony stateroom if traveling with a guest)

$75,000 in GDC
$750 credit towards the cruise

$50,000 in GDC
$500 credit toward cruise

For more information, please contact Tammy Mason at tmason@lifemark.com.


LifeMark is partnering with a new technology provider to help you engage in effective one-on-one financial planning and grow the retirement plan side of your business!

Do you want more engaged participants? How about being able to objectively show the plan sponsor that their employees are better off with you as their advisor? Would you like to differentiate yourself and command higher fees by providing unique and effective plan education? If so, then it’s time to take control of participant education!

The Retirement Analysis Kit (TRAK) can quickly create personalized retirement projections for each participant. Before your meeting is done, your participants will know if they are on track for retirement and, if they’re not, exactly what they need to contribute to get on track.

Advisors using TRAK have doubled and tripled their business, found unmanaged assets and increased deferrals. With TRAK, you’re in the driver’s seat, bringing retirement education directly to participants and motivating them to take action.

What do other advisors say about TRAK?

Gerald W., from Farmington Hills, Michigan says, “with TRAK, our client satisfaction has gone through the roof, participation and contribution rates are up, and we have consistent opportunities for one-on-one financial planning. Our average participation rate is now between 80-95%! It’s played a role in our growth as a firm and now we use TRAK with every plan. We even started using it with our own 850 employees and the response was phenomenal. We have never received such positive feedback and found an additional $10 million to help advise on.”

TRAK has many unique and innovative features such as solutions for educating federal and state employees about their pensions.

Stand out from other advisors, engage participants, and delight plan sponsors and see the difference it will make on your business!

For more information contact Tammy Mason at tmason@lifemark.com or visit RetireReady.com!


Macro Overview

Equities rebounded in July and remained resilient to tariff and trade tensions. Markets are realizing that the U.S. has been somewhat insulated from lingering trade disputes. Various analysts and market strategists are expecting trade tensions to ease as ongoing negotiations alleviate some of the uncertainty.

China’s ability to retaliate against U.S. imposed tariffs is proving to be difficult for China since the country imports far less from the U.S. than the U.S. imports from China. To China’s benefit, the country’s currency, the yuan, has fallen steadily since the onslaught of the new tariffs, ironically making Chinese products less expensive and more competitive internationally. Should the yuan continue to depreciate versus the U.S. dollar, the imposed tariffs may then be offset by the weakening yuan, creating even more trade tension between the two countries.

Because of a more developed and diverse financial market, the United States has numerous sectors for investors to shield themselves from trade politics and tariff disputes. International markets remain exposed and vulnerable to the trending tariff impositions and trade issues. Trade disputes with various countries have also enhanced volatility throughout the international markets. Emerging market countries, such as Russia, are losing financial ground against the U.S. dollar’s rise. The presence of Russian companies within emerging market indices has fallen from 10% in 2007 to 3% this year, as growth prospects and existing debt has become less favorable.

Short-term and long-term rates rose in July as improving economic data drove rates across all maturities higher. The 10-year Treasury yield ended July at 2.96%, extremely close to the yield on the 30-year Treasury at 3.08%.

The U.S. economy grew at a 4.1% annual rate per GDP (Gross Domestic Product) data released by the Commerce Department. The growth rate is the strongest in four years, validating improved business and consumer expansion. Strong consumer spending, increasing business investment, growing exports and additional government expenditures all contributed to an increase in GDP, the value of all goods and services produced across the economy.

A substantial shift with how corporate earnings are achieved occurred this quarter, as expanding earnings are coming primarily from revenue growth rather than from reducing expenses. Economists optimistically view this as an improvement in overall economic expansion due to higher sales and increased demand for products and services nationwide. (Sources: Commerce Dept., U.S. Treasury, Dept. of Labor, Bloomberg)


Equities Remain Resilient – Domestic Stock Market

Trade concerns affecting equities were overshadowed by rising corporate earnings and improving economic data. U.S. equities ended with gains across all size companies, small to large caps. Small caps have advanced the most year to date, yet large caps outperformed in July. Optimistically, all sectors posted gains in July, with industrials leading. As a reversal from the second quarter, value stocks outperformed growth stocks in July, signaling a rotation to less growth orientated companies.

Half of the largest ten U.S. companies ranked by market value are technology companies, representing over $4 trillion in market value. The other top ten companies include financials, banking and energy.

The telecom sector will be renamed the communications services sector, a better representation of the evolvement of the industry and technology driving it. Traditionally known as a steady sector with a few companies, the sector will now include many more companies and with ample growth orientation, accounting for over 10% of the S&P 500 Index.

Rising input costs are starting to impact certain sectors, as import tariffs are adding to various metal and commodity components. It is too soon to tell which companies may be passing along the higher material costs to consumers. (Sources: S&P, Dow Jones, Bloomberg, https://fred.stlouisfed.org/categories/32255)

Good News, More Workers Are Quitting Their Jobs – Employment Market Review

For the first time since 2000, there are more job openings than unemployed persons to fill them. Job openings rose to 6.7 million positions in April, more than the 6.3 million that were unemployed in April, the most recent data. A shrinking workforce is becoming a rising factor, due to retiring baby boomers and students deciding to stay in school longer before joining the workforce. The tighter labor market is also leading to a growing number of workers quitting their current job. Each month the U.S. Department of Labor releases employment data which includes how many workers are actually quitting their jobs. The data is considered a critical barometer of the labor market’s health and an indicator of economic growth.

The “quits rate” essentially measures how many workers quit their jobs voluntarily as opposed to being fired or laid off. Many economists and ana
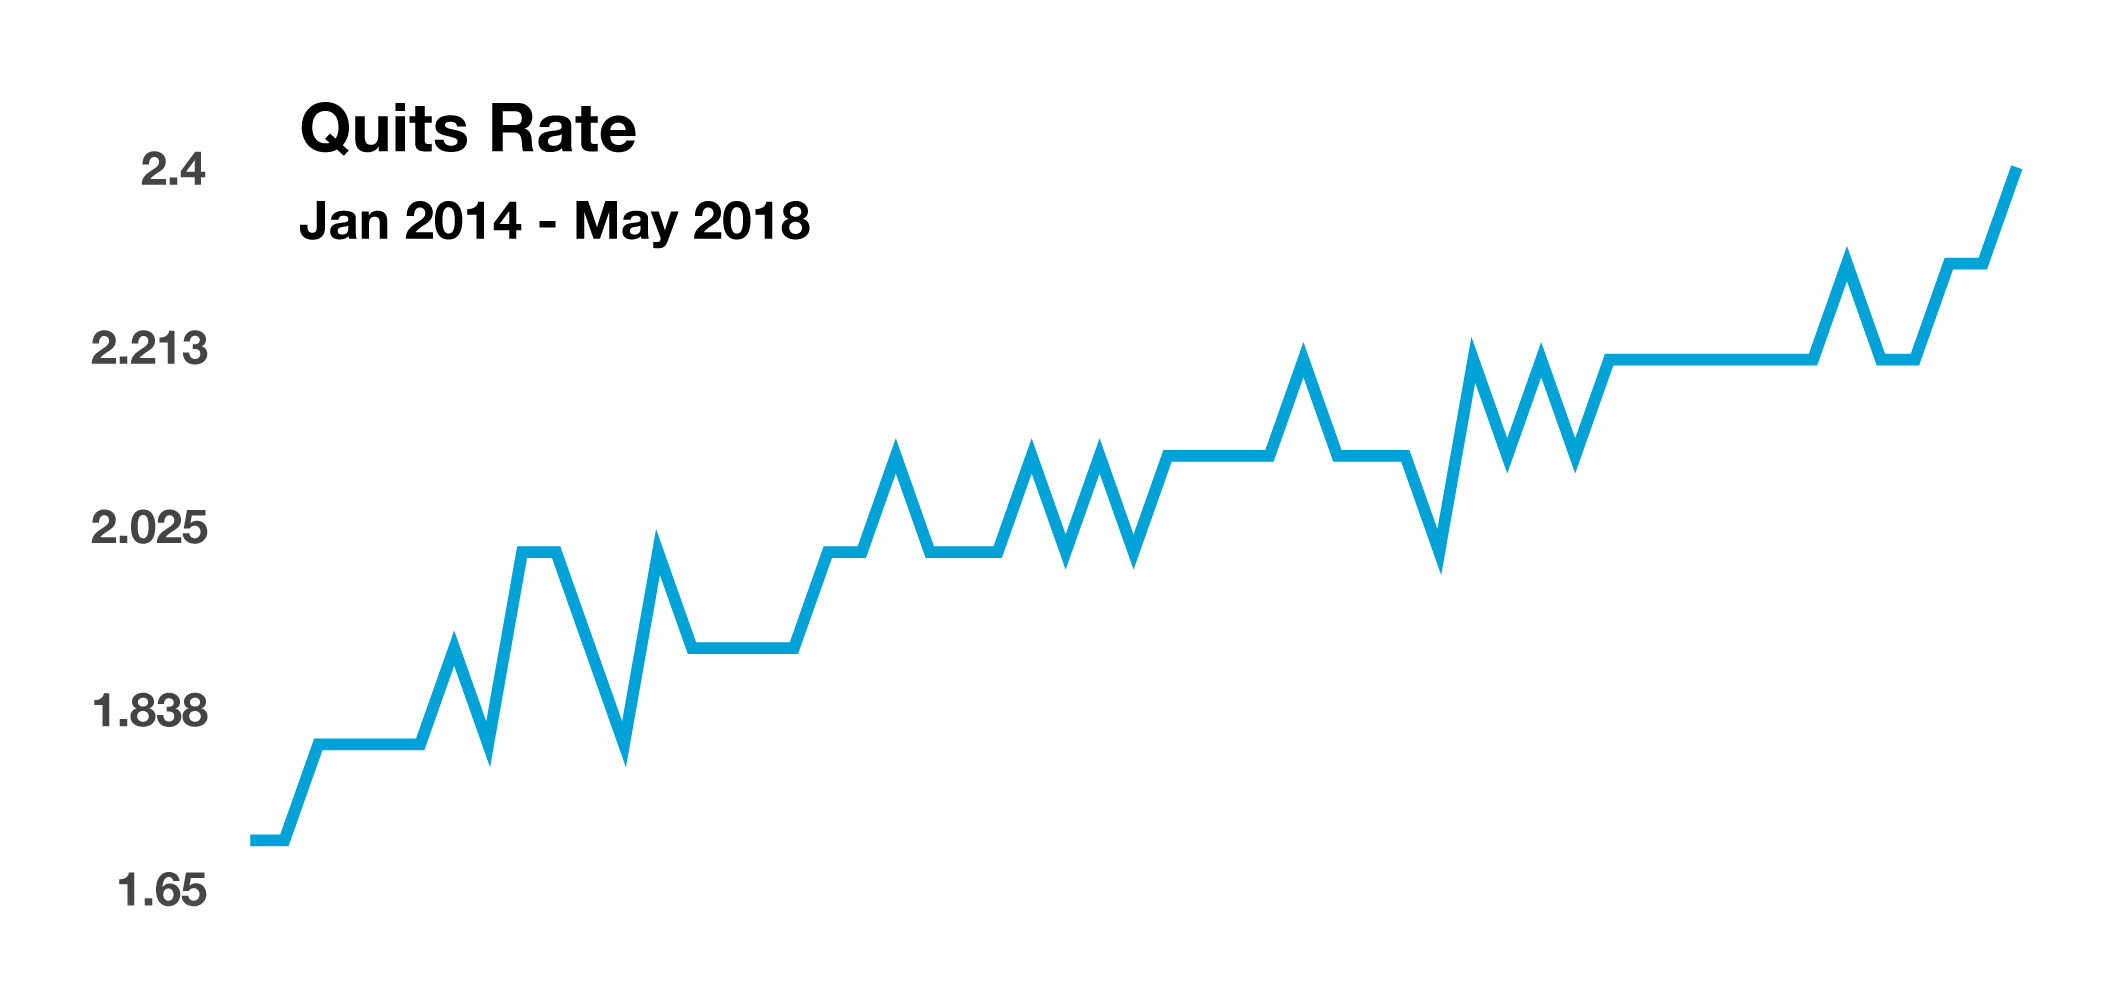
lysts follow the quits rate closely because it reveals how confident workers are. These same workers are also the consumers that the Fed monitors to determine if their confidence is allowing them to spend more, thus lifting economic growth. The most current quits rate rose to 2.4 in May, the highest monthly reading in over 10 years. Following the financial crisis in 2008, the quits rate dropped as workers were less confident in leaving a job they had rather than look for another job opportunity. (Sources: U.S. Labor Department)


Rates Gradually Rise – Global Debt Markets

It is a possibility that additional Federal Reserve rate increases this year may reduce the difference, also known as the spread, to nearly zero between short-term and long-term rates. The similarity of short-term and long-term rates is a barometer for economists and analysts in determining economic growth expectations.

The broad retraction of fiscal stimulus by global central banks in the U.S., Europe, and Asia have led to less liquidity for bonds among some of the emerging market countries. Debt owed in U.S. dollars by foreign countries makes it more expensive to pay back as the U.S. dollar rises. Trade tensions are affecting the Chinese debt market, as corporate bonds are defaulting at a rising rate. Overextended Chinese companies ladened with debt are also seeing the effects of a weaker Chinese currency, the yuan, which makes repayment of debt more costly in the global markets.

U.S. Treasury bond yields rose in late July propelled by strong economic growth data and expected continued rate rises signaled by the Federal Reserve. The yield on the 10-year Treasury rose to 2.96% at July’s end, close to piercing the 3% point as it did in May. (Sources: Fed, Dept. of Commerce)

New Home Sales Are Dropping – Housing Market Update

Data from the Department of Housing and Urban Development revealed that new home sales have been falling. Sales for new homes have been affected as mortgage rates have risen and a lack of supply is still an issue. Labor shortages of qualified workers throughout the housing industry have placed a strain on the construction of new homes, an issue th
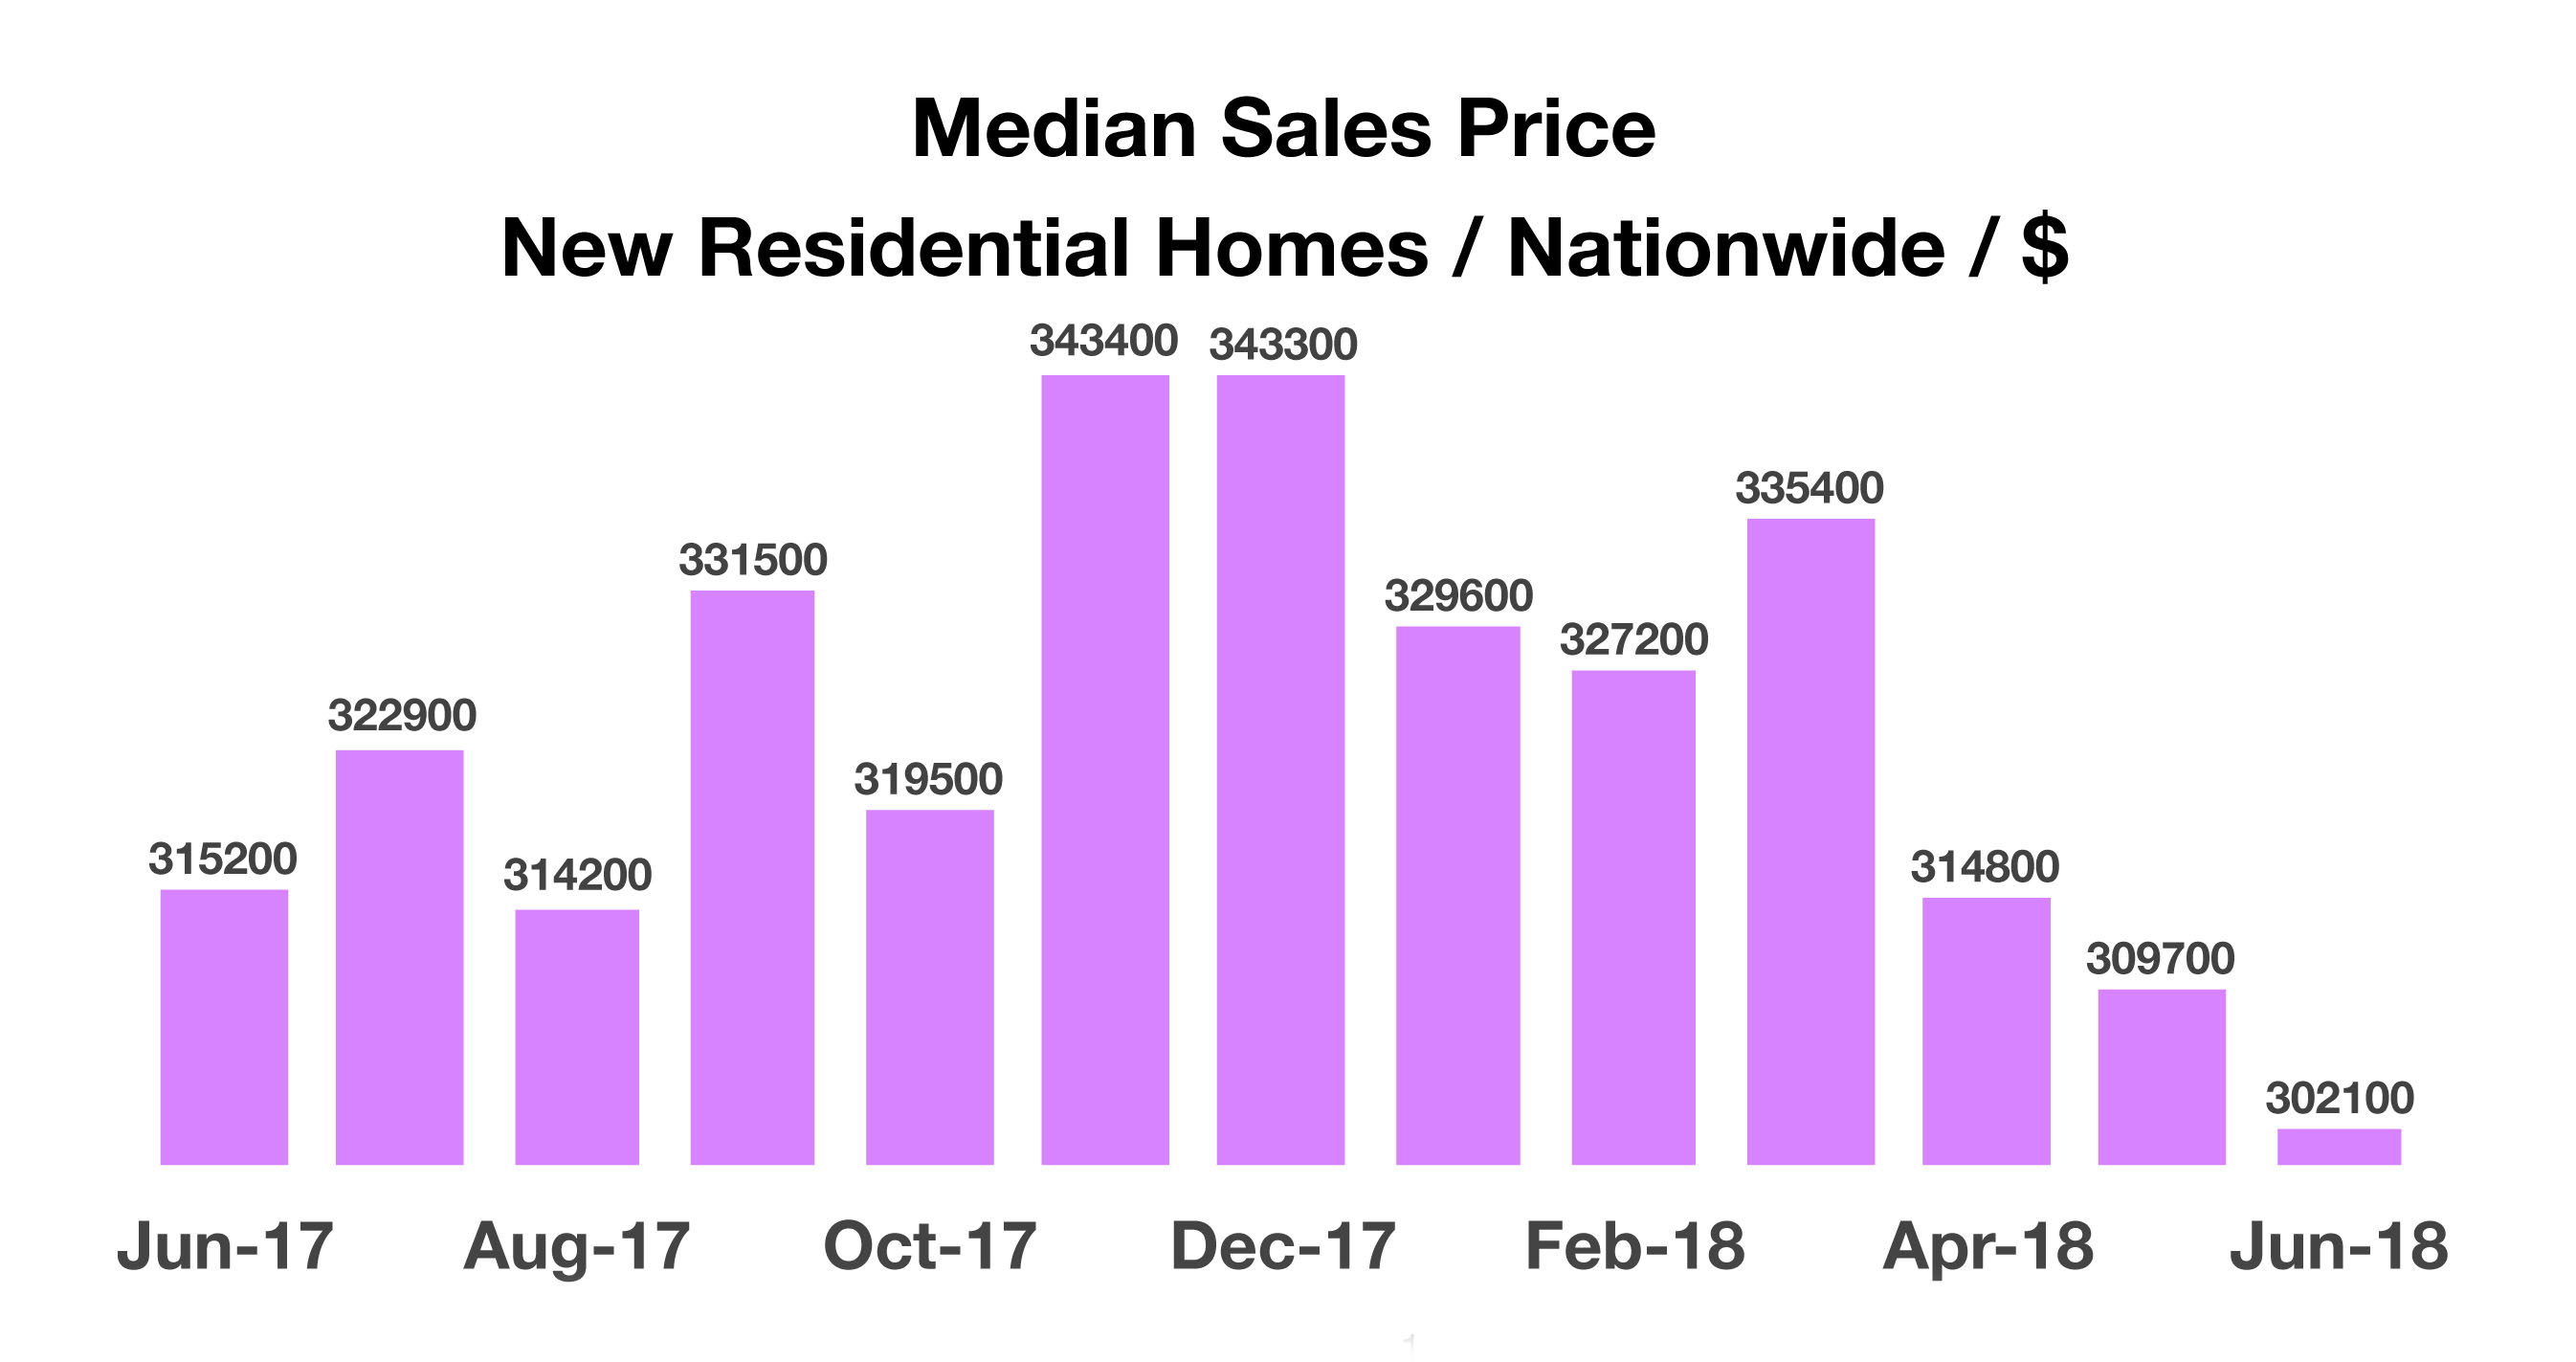
at is not prevalent with existing home sales.

Affordability is becoming an issue as rates have risen, driving up mortgage payments. Even though prices have fallen with the median priced home at $302,100 this past month down from $322,900 a year ago, the current 30-year fixed conforming rate has risen to 4.54% from 3.92% in the same period. Lower home prices are offsetting some higher mortgage rates in certain parts of the country.

Home prices are becoming out of reach for many first time buyers, especially younger singles and couples that are an essential catalyst for an expanding housing market. According to Freddie Mac, higher home prices on lower priced homes have reduced affordability for younger home buyers. New home sales, not existing home sales, is the housing sales component measured into GDP. Existing home sales have also dropped in the past year, by over 2%. Government data includes new home sales because of the new expenses created, such as property tax, first time mortgage, and utilities. (Sources: U.S. Census Bureau, U.S. Department of Housing, Freddie Mac)


Tax On Social Security In Retirement – Retirement Tax Planning

A prudent and effective tax strategy during your employment years will mostly likely need to be modified in retirement. Once earned income ceases and income from retirement plans, investments, and Social Security commences, tax liabilities change.

The impact of the changes is primarily driven by the assets that we have little tax control over once we reach 70.5, which include IRAs, 401ks, and pensions. Reaching age 70.5 triggers RMDs (Required Minimum Distributions). Distributions from tax deferred retirement accounts such as an IRA or a 401k are generally taxed at the ordinary tax rate. Distributions from a Roth IRA or Roth 401k are income tax free as long as the account has been opened for at least five years and the account holder is 59.5.

Investment income such as stock dividends and bond interest are taxed differently, especially when they are held outside of a retirement account. Realizing gains on stocks that have been held for one year or more can be taxed at a more favorable rate than the ordinary rate. Interest on bonds and gains realized on short-term positions less than one year, are taxed at the ordinary rate.

Retirement also introduces us to Social Security which, contrary to popular belief, can be taxed. Eligibility for Social Security benefit payments begins at age 62, but can be postponed until age 70. A key determinant as to when to start receiving Social Security may be contingent on the amount of retirement assets in retirement accounts subject to RMDs. This is where tax strategies can vary dramatically.

Retirees with excessive assets in retirement accounts subject to RMDs and with non-retirement investment income may want to confer with a tax professional to help determine when to take Social Security. Conversely, retirees with minimal assets in retirement accounts and investments may have less concern about paying taxes on their Social Security benefits.

The IRS determines if and how taxes are owed on Social Security by the “provisional income” measure. Provisional income includes gross income, tax-free interest, and 50% of Social Security benefits. If the provisional income is above a certain amount, then a portion of the Social Security income becomes taxable.

One way to potentially lower taxes in retirement is to start taking distributions from tax-deferred accounts before it’s required. Again, once you reach age 59.5, you can withdraw funds from those accounts without paying the 10% early withdrawal penalty. The withdrawals are still taxed as ordinary income, but over time they reduce the size of tax deferred accounts, and thus the size of your RMDs. Another reason to access those funds before 70.5 is that it could help you delay taking your social Security benefit, which increases in size the later you take it, up to age 70.

Another strategy for reducing the potential tax consequences of RMDs is converting a traditional IRA or 401(k) plan into a Roth IRA before the age of 70.5. A Roth conversion may make sense when you’re certain you’ll be in a higher bracket when you eventually withdraw the money, which is often the case once RMDs and Social Security are factored in.

(Sources: Social Security Admin., IRS, Tax Policy Center)