AIS August 2019 Newsletter
Market Update
(all values as of 06.28.2024)

Stock Indices:

Dow Jones 39,118
S&P 500 5,460
Nasdaq 17,732

Bond Sector Yields:

2 Yr Treasury 4.71%
10 Yr Treasury 4.36%
10 Yr Municipal 2.86%
High Yield 7.58%

YTD Market Returns:

Dow Jones 3.79%
S&P 500 14.48%
Nasdaq 18.13%
MSCI-EAFE 3.51%
MSCI-Europe 3.72%
MSCI-Pacific 3.05%
MSCI-Emg Mkt 6.11%
 
US Agg Bond -0.71%
US Corp Bond -0.49%
US Gov’t Bond -0.68%

Commodity Prices:

Gold 2,336
Silver 29.43
Oil (WTI) 81.46

Currencies:

Dollar / Euro 1.06
Dollar / Pound 1.26
Yen / Dollar 160.56
Canadian /Dollar 0.73

Macro Overview

Trade tensions escalated as the U.S. announced a 10% tariff commencing September 1st on $300 billion of Chinese imports that haven’t yet been subject to any tariffs. The additional tariffs would essentially apply to nearly all imports from China. Another $250 billion in Chinese imports have already been subject to a 25% tariff for the past few months.

Trade data from the Commerce Department shows imports from China have declined 12.6% over the past year, yet imports from South Korea, Taiwan, and Vietnam rose 9.2% during the same period. Other Asian countries are becoming substitute exporters of goods to the U.S. as Chinese exports to the U.S. have been subject to increasing tariffs.

Analysts and economists believe that a continuing low interest rate environment will help to offset the impact of escalating tariffs, as the low cost to borrow for consumers minimizes some of the tariff costs passed along to consumers.

Stock indices climbed in July to reach new record levels, driven by indications that the Federal Reserve was on track for an imminent rate cut. Equity and bond markets continued to move higher following a strong June, propelled by improved earnings and gradual economic expansion.

The newly elected Prime Minister of the United Kingdom is positioning the country for departure from the EU, also known as Brexit, on October 31st. Britain’s exit from the EU has several other European countries closely monitoring how the exit will be orchestrated. The British currency, the pound, has fallen to its lowest levels against the euro since September 2017.

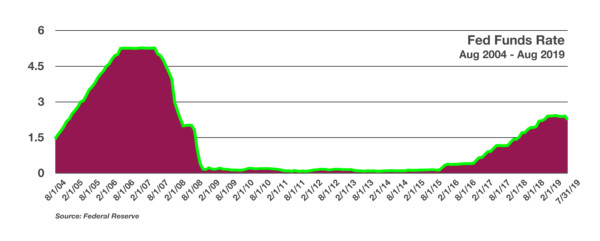
The Federal Reserve cut the Fed Funds rate on July 31st, making it the first rate cut since 2008. Markets pulled back as the Fed Chairman signaled that additional rate cuts were not expected to be ongoing. The rate reduction follows a series of gradual rate increases that began in 2015. The Fed Funds rate is a monetary policy tool used by the Federal Reserve to control the interest rate charged by banks for funds loaned amongst each other. It eventually affects consumer loans and mortgage rates as banks adjust to the modified Fed Funds environment.

Even as the 10-year Treasury yield fell below 2.00% in July, it is still offering a more attractive yield than most other developed country government bonds. Yields for 10-year government bonds in Germany and Japan yielded -0.44% and -0.16% respectively. Such negative yields mean that investors are basically paying the governments of Germany and Japan to hold on to their funds. The U.S. economy has thus far not participated in the international slowdown prevalent in other countries. Stimulus efforts by the central banks around the world have lowered rates to where $14 trillion of global bonds are generating negative yields.

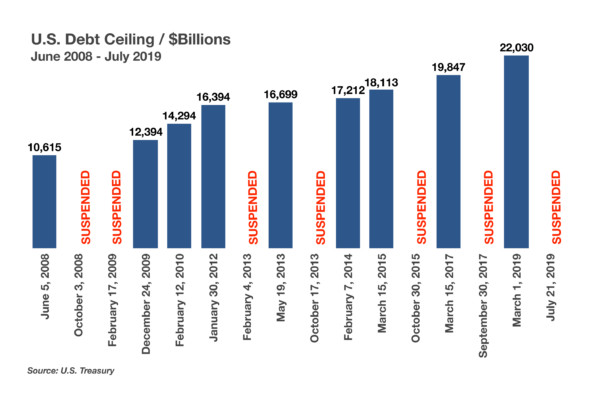
The Senate passed legislation to suspend the debt limit for two years through July 31, 2021, eliminating the risk of default until the Senate votes on increasing it again in 2021. The existing limit as of the suspension currently exceeds $22 trillion, nearly double from where it was 10 years ago. (Sources: Commerce Department, Federal Reserve, Bloomberg, U.S. Treasury Department, TreasuryDirect.gov)

 
Equity Update

Low Rates & Improved Earnings Send Stocks To Highs In July – Volatility Returns in August

While stocks were driven by a Fed rate cut expectation in July, earnings also became a focal point as economic weakness abroad and a strong dollar have created a challenge for earnings of U.S. multinational firms.  U.S. corporate earnings have proven to be more resilient than expected as earnings beat expectations for a swath of companies in the equity indices. The ability for companies to continue earnings increases in a slow growth environment is optimistic for the equity markets.  Sectors leading the equity markets in July included Information Technology, Communication Services, and Financials. Driven by better than expected earnings and revenue growth, the sectors were also influenced by the low rate environment and continuing consumer demand.

Unfortunately, the party ended in August as volatility returned with a vengeance.  All the major averages suffered multiple daily losses of ~3% which sent volatility spiking from 12.16 on July 26th to 24.59 on August 5th due mostly to renewed trade war and recession fears.  Interest rates and the yield curve are telling one story while earnings and economic activity are seemingly painting a rosier picture.    As of July, we are now in the longest expansion in history which is now in it’s 122nd month it is however, also one of the weakest expansions in history as measured in GDP growth.  We would argue that it has been weak because it has been a “fake” expansion and has only been made possible by the extreme, unprecedented central bank interference as opposed to real changes in aggregate supply and demand.  We have simply printed our way into prosperity and at some point we will have to pay the piper and equity investors would be wise to exercise caution.

 
Fixed Income Update - Interest Rates

Interest Rate Overview

Fed Chair Jerome Powell communicated that the reduction in the Fed Funds rate was not going to be a series of reductions, but rather a wait and see approach contingent on economic progress over the next few months.
The Fed’s reduction to the Fed Funds rate was the first since 2008 when the financial crisis had begun. The Fed Funds rate was essential zero from the end of 2008 to the beginning of 2016 when the Fed started raising the target rate again.


The 10-year Treasury yield dropped in July to its lowest level since 2016 as markets assessed the Fed Chairman’s comments surrounding any possible rate cuts over the next few months.  The 10-year Treasury opened August at 2.06% and has fallen 50 basis points to 1.55% in the first two weeks of the month. To put this move in dollar terms, 51 basis points equates to a price move of nearly $4.75 or a gain of nearly 5% in 2 weeks.  The Fed Funds futures market is pricing in a near certain possibility of another rate reduction in September 2019.

Negative interest rates outside the U.S., combined with expectations of weaker economic growth and minimal inflation, have weighed on long-term Treasury bond yields. CNBC reported on August 6th that worldwide negative debt is now a whopping $15 trillion.  This is not how bond markets are supposed to work – owners of capital (investors) are supposed to get paid for loaning their money to governments (and corporations) but today investors are actually giving their hard earned capital away knowing they will receive less at maturity.  There are actually junk rated European bonds that are trading at negative yields!  Imagine loaning a risky corporation money knowing that if everything goes perfectly you will lose money?  Germany is looking to bring a 30-year bond at -0.14% yield this week but there are concerns about a possible investor revolt.  It will be interesting to see how this turns out and if investors are willing to take 30 years of inflation risk knowing they will lose money every single year for 3o years!  There is much debate about whether negative interest rates will ultimately find their way to the U.S. and if U.S. investors will trade sanity for safety.  Of course, with over $20 trillion in debt and hundreds of trillions in unfunded liabilities safety is an illusion and paying an insolvent entity to hold your money knowing they will have to print their way back into solvency would be insane.  (Sources: Federal Reserve, U.S. Treasury, CNBC)

 
Fixed Income Update - Credit Spreads

Credit Spreads

As volatility increased in August credit spreads began to widen.  Investment grade (IG) spreads widened 16 basis points from 113 to 129 basis points.  High yield (HY) spreads widened 56 basis points from 393 to 449.  This puts the spread differential between IG and HY at 320 basis points (449 – 129 = 320) which means HY investors are receiving a “risk premium” of 3.2% over IG investors.  We wrote extensively last year about the relationship between IG and HY spreads and it was our opinion that investors were not being rewarded for the risk they were taking – In September of 2018 the spread between IG and HY was only 209 basis points and we pounded the table warning investors to sell HY bonds.  The current spread of 320 means HY investors have lost 111 basis points since that September low (320 – 209 = 111).  When this expansion ends and we finally enter the inevitable recession, the record breaking amount quantity and low quality of debt that has been accumulated in this current expansion will almost guarantee that bond spreads will widen far past their historical averages and we believe it is possible that we will see 2008 type spreads when HY bond spreads were over 2000 (20%) basis points and the spread between IG and HY was over 1500 basis points (HY bonds were yielding 15% more than IG bonds).  This would push long maturity HY bond prices down 50% or more.

In past newsletters we used TSLA 5.3% of 8/15/25 as the poster child for everything wrong with debt markets.  We warned investors to stay away from the bonds and they subsequently fell to as low as $81 in May 2019 and are currently trading at ~$88 which is a yield of 7.79% or a spread over the treasury of 634 basis points.  If, as we believe, a credit event is on the horizon and we went back to 2008 spreads of 2100 basis points this bond would drop to $45.  That is a tremendous amount of principal to risk to earn 7.79%.  And the TSLA is only a 7 year bond – If you took a 10-year bond and widened it 1500 basis points that would equate to a dollar price loss of approximately 72%!

The yield curve has flattened with many areas inverted. The 1-2 year curve is now inverted by 24 basis points and the 2-5 year curve is inverted by 15 basis points. This means an investor can earn 0.24% more investing in a 1yr bond than a 2yr and 0.15% more in a 2yr than a 5yr. The most widely quoted curve – the 2-10yr curve has gone from +21 bps to -6.67 bps which again means you can get a higher yield in a 2yr than a 10yr.  This relationship has traditionally signaled an impending recession.

Clearly, at this point when you consider that we are almost certainly near the end of the economic expansion cycle and have piled on unprecedented amounts of low quality debt there is a tremendous amount of price risk in owning long-term, low quality bonds and the historically low spreads mean investors are not getting paid near enough to compensate them for the risk.  As we have stated previously, investors should take advantage of the flat yield curve and shorten their maturities and stick with higher quality debt.  It is simply not worth owning long-term, lower rated debt at these levels.  The yield pick up is negligible but the risk is massive.

 
Housing Market Review

Falling interest rates have prompted an increase in mortgage activity as the cost to borrow for home buyers has become less expensive. Mortgage rates fell in late July to the lowest levels since late 2016, with the average on a 30-year fixed rate conforming loan falling to 3.75%, down from 4.94% in November 2018.

The challenge for many homebuyers has been rising home prices and affordability throughout the country. Slow rising wages and stagnant incomes have, for the most part, not kept up with rising home prices. Even though mortgage rates have dropped, housing prices are still elevated to the levels that force many to wait or rent until housing prices drop.

Data tracked by the Federal Reserve Bank of St. Louis and Freddie Mac reveal that even as mortgage rates fell since the beginning of the year, affordability still declined. Affordability is the ability of a homebuyer to purchase a home and pay for all related expenses with an existing income.

Mortgages accounted for two-thirds of the $13.67 trillion in U.S. household debt in the first quarter. Because they are typically paid off over decades, mortgage rates tend to be correlated with 10-year Treasury bond yields rather than with the short-term rates controlled by the Federal Reserve.

Sources: Federal Reserve Bank of St. Louis, Freddie Mac

 
Domestic Economy

Some States Growing Faster Than Rest of the Country – Domestic Economy

Economic growth across the country varies by several factors, including demographics, education, weather, and industry. The first quarter of 2019 saw an increase in GDP of 3.2% nationwide, yet certain states realized a much stronger growth than others. West Virginia topped every other state in the first quarter, with a 5.2% growth rate. Texas, New Mexico and Utah also saw greater than average growth over the same period.

Some states, such as Texas, continue to experience a large influx of new residents from other states such as California. Texas offers more affordable housing, ample jobs, and no state income tax relative to California. Skilled and qualified workers are essential to fill various job openings, where certain industries seek particular skillsets from workers. Texas has also seen a tremendous demand for oil industry workers as the oil sector in the state has expanded because of shale drilling.

States with older populations and less qualified workers are seeing less growth and even an exodus of people. New Jersey, Maryland, Mississippi and Hawaii were among the slowest growth states in the first quarter, where demographics and cost of living influence the local economies more than other states.

Sources: U.S. Bureau of Economic Analysis

 
Fiscal Policy Overview

Debt Limit Gets Put On Suspension – Fiscal Policy Overview

Formally known as the statutory debt limit, the United States debt ceiling or debt limit is a legislative restriction on the amount of national debt that can be issued by the Treasury. The debt limit has been raised 79 times since its creation in 1917, with 17 of these increases occurring over the past 20 years.

The debt ceiling may also be suspended, meaning that spending can continue without a Congressional vote until a specific date. On July 21st, Congress voted to suspend the debt limit until July 21, 2021, thus allowing for an increase in borrowing to meet expected expenses over the next two years.

The United States has maintained legislative restriction on debt since 1917. To control the amount of total debt outstanding, Congress has placed restrictions on Federal debt issuance since the passing of the Second Liberty Bond Act of 1917, which eventually evolved into a general debt limit in 1939. The Second Liberty Bond Act of 1917 helped finance the United States’ entry into World War I, which allowed the Treasury to issue long-term Liberty Bonds.

Periodically, a political dispute arises over legislation to raise the debt ceiling. Until the debt ceiling is raised, the Treasury undertakes what is termed as “extraordinary measures”, which essentially buys more time for the ceiling to be raised.

The United States has never reached the point of default, where the Treasury is unable to pay its obligations. In 2011 the United States reached a point of near default, which in turn triggered the first downgrade of U.S. debt by credit rating agencies. Congress raised the debt limit with the Budget Control Act of 2011, which led to the fiscal cliff and set a new debt ceiling that was reached on December 31, 2012.

Source: Congressional Research Service

 
AIS Performance and Fixed Income Review/Conclusions

As we stated in previous newsletters, our strategy has been to keep our maturities weighted toward the short-end and have been heavily invested in MBS/ABS that are short and cash-flow heavy.  The pricing inefficiencies are especially pronounced in the these markets when trading odd-lots (under 100k current face) and we have been able to find a steady stream of odd-lot MBS/ABS paper at prices well below round-lot prices (actual market value).  This has resulted in a massive outperformance for our clients which have beat the Bloomberg Barclays Global Bond Index by over 6%. In 2018, the Index was essentially flat and our average account was up over 5% and in 2019 the out-performance has continued as our cumulative return is now over 12% vs. the index at ~6%.

Our performance got a boost from the yield curve steepening trade we recommended last summer (see newsletter archives for the special report).  We took a 10-15% position in this trade and the bonds have rallied 20+%.  We lightened up in that position several months ago but with the massive treasury rally have recently begun to re-visit the trade as the many of the bonds are once again trading at significant spread picks to treasuries.  For instance, last week we saw a 14 year LLOYDS issue with a spread of +150 to the 10-year as a zero coupon for life.  That is a significant pick for an A rated bond trading with a $60’s handle and tremendous upside should the yield curve steepen (which one would expect if we enter a recession).

We continue to keep the bulk of our portfolios in current pay ABS/MBS with short to intermediate average life profiles.  The inefficiencies create such a large odd-lot arbitrage and these bonds will offer some protection if we enter a credit event (spread widening) due to their monthly principal pay down profile and shorter average life.

For non-client bond investors, we would suggest that you keep an eye on credit quality and take advantage of the inverted yield curve by keeping maturities short.  This will give you some protection should things go south in the economy and allow you to take advantage of any credit event.