Ocean Park Capital Management
2503 Main Street
Santa Monica, CA 90405
Main: 310.392.7300
Daily Performance Line: 310.281.8577
Dow Jones | 41,763 |
S&P 500 | 5,705 |
Nasdaq | 18,095 |
2 Yr Treasury | 4.16% |
10 Yr Treasury | 4.28% |
10 Yr Municipal | 3.03% |
High Yield | 7.06% |
Dow Jones | 10.81% |
S&P 500 | 19.62% |
Nasdaq | 20.54% |
MSCI-EAFE | 7.30% |
MSCI-Europe | 6.40% |
MSCI-Pacific | 7.60% |
MSCI-Emg Mkt | 11.60% |
US Agg Bond | 1.86% |
US Corp Bond | 2.77% |
US Gov’t Bond | 1.90% |
Gold | 2,755 |
Silver | 32.81 |
Oil (WTI) | 70.50 |
Dollar / Euro | 1.08 |
Dollar / Pound | 1.29 |
Yen / Dollar | 153.21 |
Canadian /Dollar | 0.71 |
Portfolio Overview
Ocean Park Investors Fund rose 6.74%* in July and outperformed most of the major indices, including the S&P 500 which gained 5.51%. In addition, the fund outperformed the HFRI Equity Hedge Index, which rose 3.68%. For the year to date through July, the fund was up 16.81%* while the S&P 500 was up 1.25% and the Dow was down 7.39%. Several portfolio stocks generated outsized gains, including Advanced Micro Devices (up over 45% for the month) and Docusign (up over 25%).
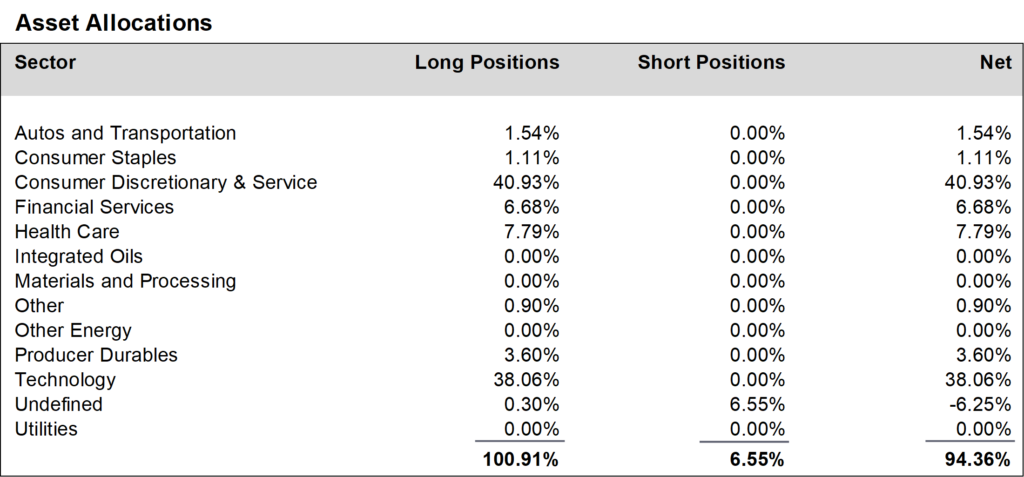
During July, we increased positions in the consumer discretionary and service sector and reduced positions in the healthcare sector. We finished the month at about 94% net long, up from about 91% in June.
Daily updates on our activity are available on our Results Line, at 310-281-8577, and current information is also maintained on our website at www.oceanparkcapital.com. To gain access to the site enter password opcap.
*These results are pro forma. Actual results for most investors will vary. See additional disclosures on page 4. Past performance does not guarantee future results.
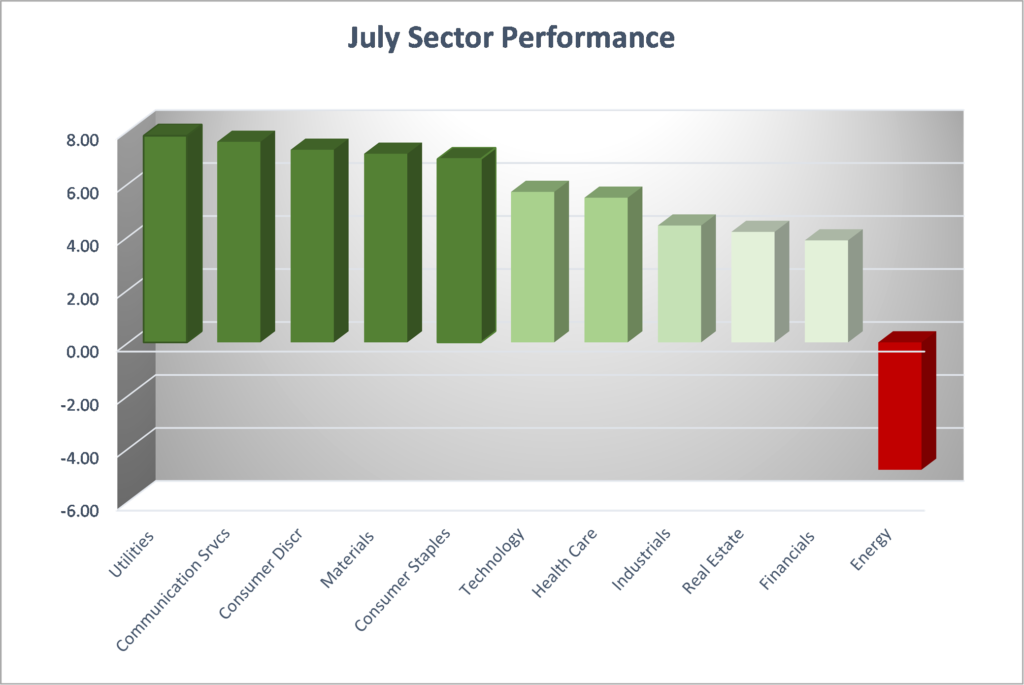
Stocks posted broad gains in July, with all the major indices up for the month. All sectors rose, except energy. Utilities led the way, with consumer discretionary and technology close behind. Growth stocks continued to outpace value stocks across all capitalization levels. Volatility was modest.
In response to the decline in economic activity caused by the pandemic, analysts had substantially lowered many companies’ earnings and revenue estimates for the second quarter, as well as the overall blended growth rate for the S&P 500. This set the stage for potential positive surprises, which is exactly what happened. With 63% of S&P 500 companies reporting, 84% beat consensus earnings estimates and 69% beat consensus revenue estimates, in both cases meaningfully above the one-year and five-year averages. And the blended earnings growth rate came in at negative -35.7%, significantly better than the consensus of negative -45%. Thus, results defied expectations significantly, and the market reacted accordingly.
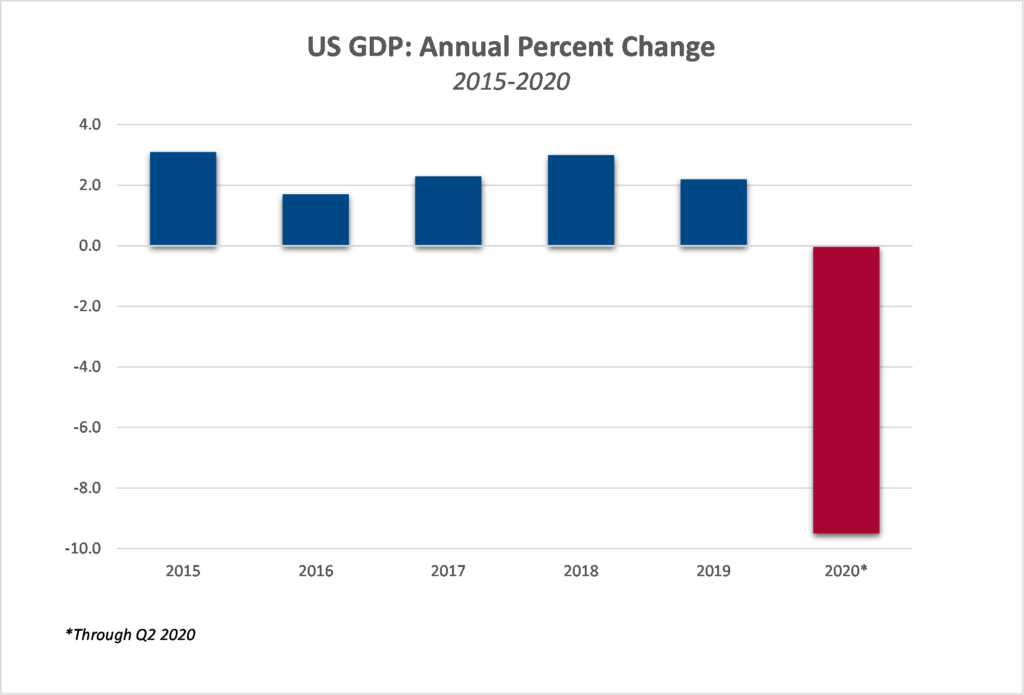
Economic data reported in July showed positive results for retail sales, housing, and durable goods orders. But at month’s end, this was overshadowed by the Commerce Department estimate of second quarter GDP, which declined by 9.5%. (As an annualized change, which is the normal way that GDP is reported, this translates to a decline in excess of 30%.) This was the largest drop on record and in one calendar quarter effectively wiped out almost all of the last 5 years of growth. In addition, tens of millions of workers remained unemployed, approximating 20% of the work force. Notwithstanding these circumstances, Congress and the president were unable to agree on the extension of proactive measures such as enhanced unemployment insurance, financial assistance to businesses, aid to state and local governments, and a moratorium on evictions.
At the moment there appear to be several possible paths to economic stabilization. In the short term, it would require significant additional stimulus from the federal government. Recent developments in Washington suggest that may be unlikely. In the medium term, it would require widespread adoption of common-sense efforts to combat the pandemic, like universal adoption of mask-wearing. But common-sense efforts have become unfortunately politicized, and their adoption rate varies from state to state, and even within states. In the long term it would require development of a reliable vaccine. There has been some progress in that regard and at this point it looks like the best hope.
Performance data for OPI reflect the reinvestment of dividends and other earnings on the fund’s assets. Performance data for the major indices reflect only changes in the value of those indices, and would be higher if dividends were included. However, the index data do not reflect fees that would be paid to index fund managers and transaction costs that would be incurred when their component stocks are bought or sold, while OPI’s data do reflect quarterly fees and expenses incurred by the fund. The information provided is believed to be reliable, but its accuracy or completeness is not warranted. This material is not intended as an offer or solicitation for the purchase or sale of any stock, bond, mutual fund, or any other financial instrument. The views and strategies discussed herein may not be appropriate and/or suitable for all investors. This material is meant solely for informational purposes, and is not intended to suffice as any type of accounting, legal, tax, or estate planning advice. Any and all forecasts mentioned are for illustrative purposes only and should not be interpreted as investment recommendations.