
Stock Indices:
| Dow Jones | 44,094 |
| S&P 500 | 6,204 |
| Nasdaq | 20,369 |
Bond Sector Yields:
| 2 Yr Treasury | 3.72% |
| 10 Yr Treasury | 4.24% |
| 10 Yr Municipal | 3.21% |
| High Yield | 6.80% |
YTD Market Returns:
| Dow Jones | 3.64% |
| S&P 500 | 5.50% |
| Nasdaq | 5.48% |
| MSCI-EAFE | 17.37% |
| MSCI-Europe | 20.67% |
| MSCI-Pacific | 11.15% |
| MSCI-Emg Mkt | 13.70% |
| US Agg Bond | 4.02% |
| US Corp Bond | 4.17% |
| US Gov’t Bond | 3.95% |
Commodity Prices:
| Gold | 3,319 |
| Silver | 36.32 |
| Oil (WTI) | 64.98 |
Currencies:
| Dollar / Euro | 1.17 |
| Dollar / Pound | 1.37 |
| Yen / Dollar | 144.61 |
| Canadian /Dollar | 0.73 |
Macro Overview
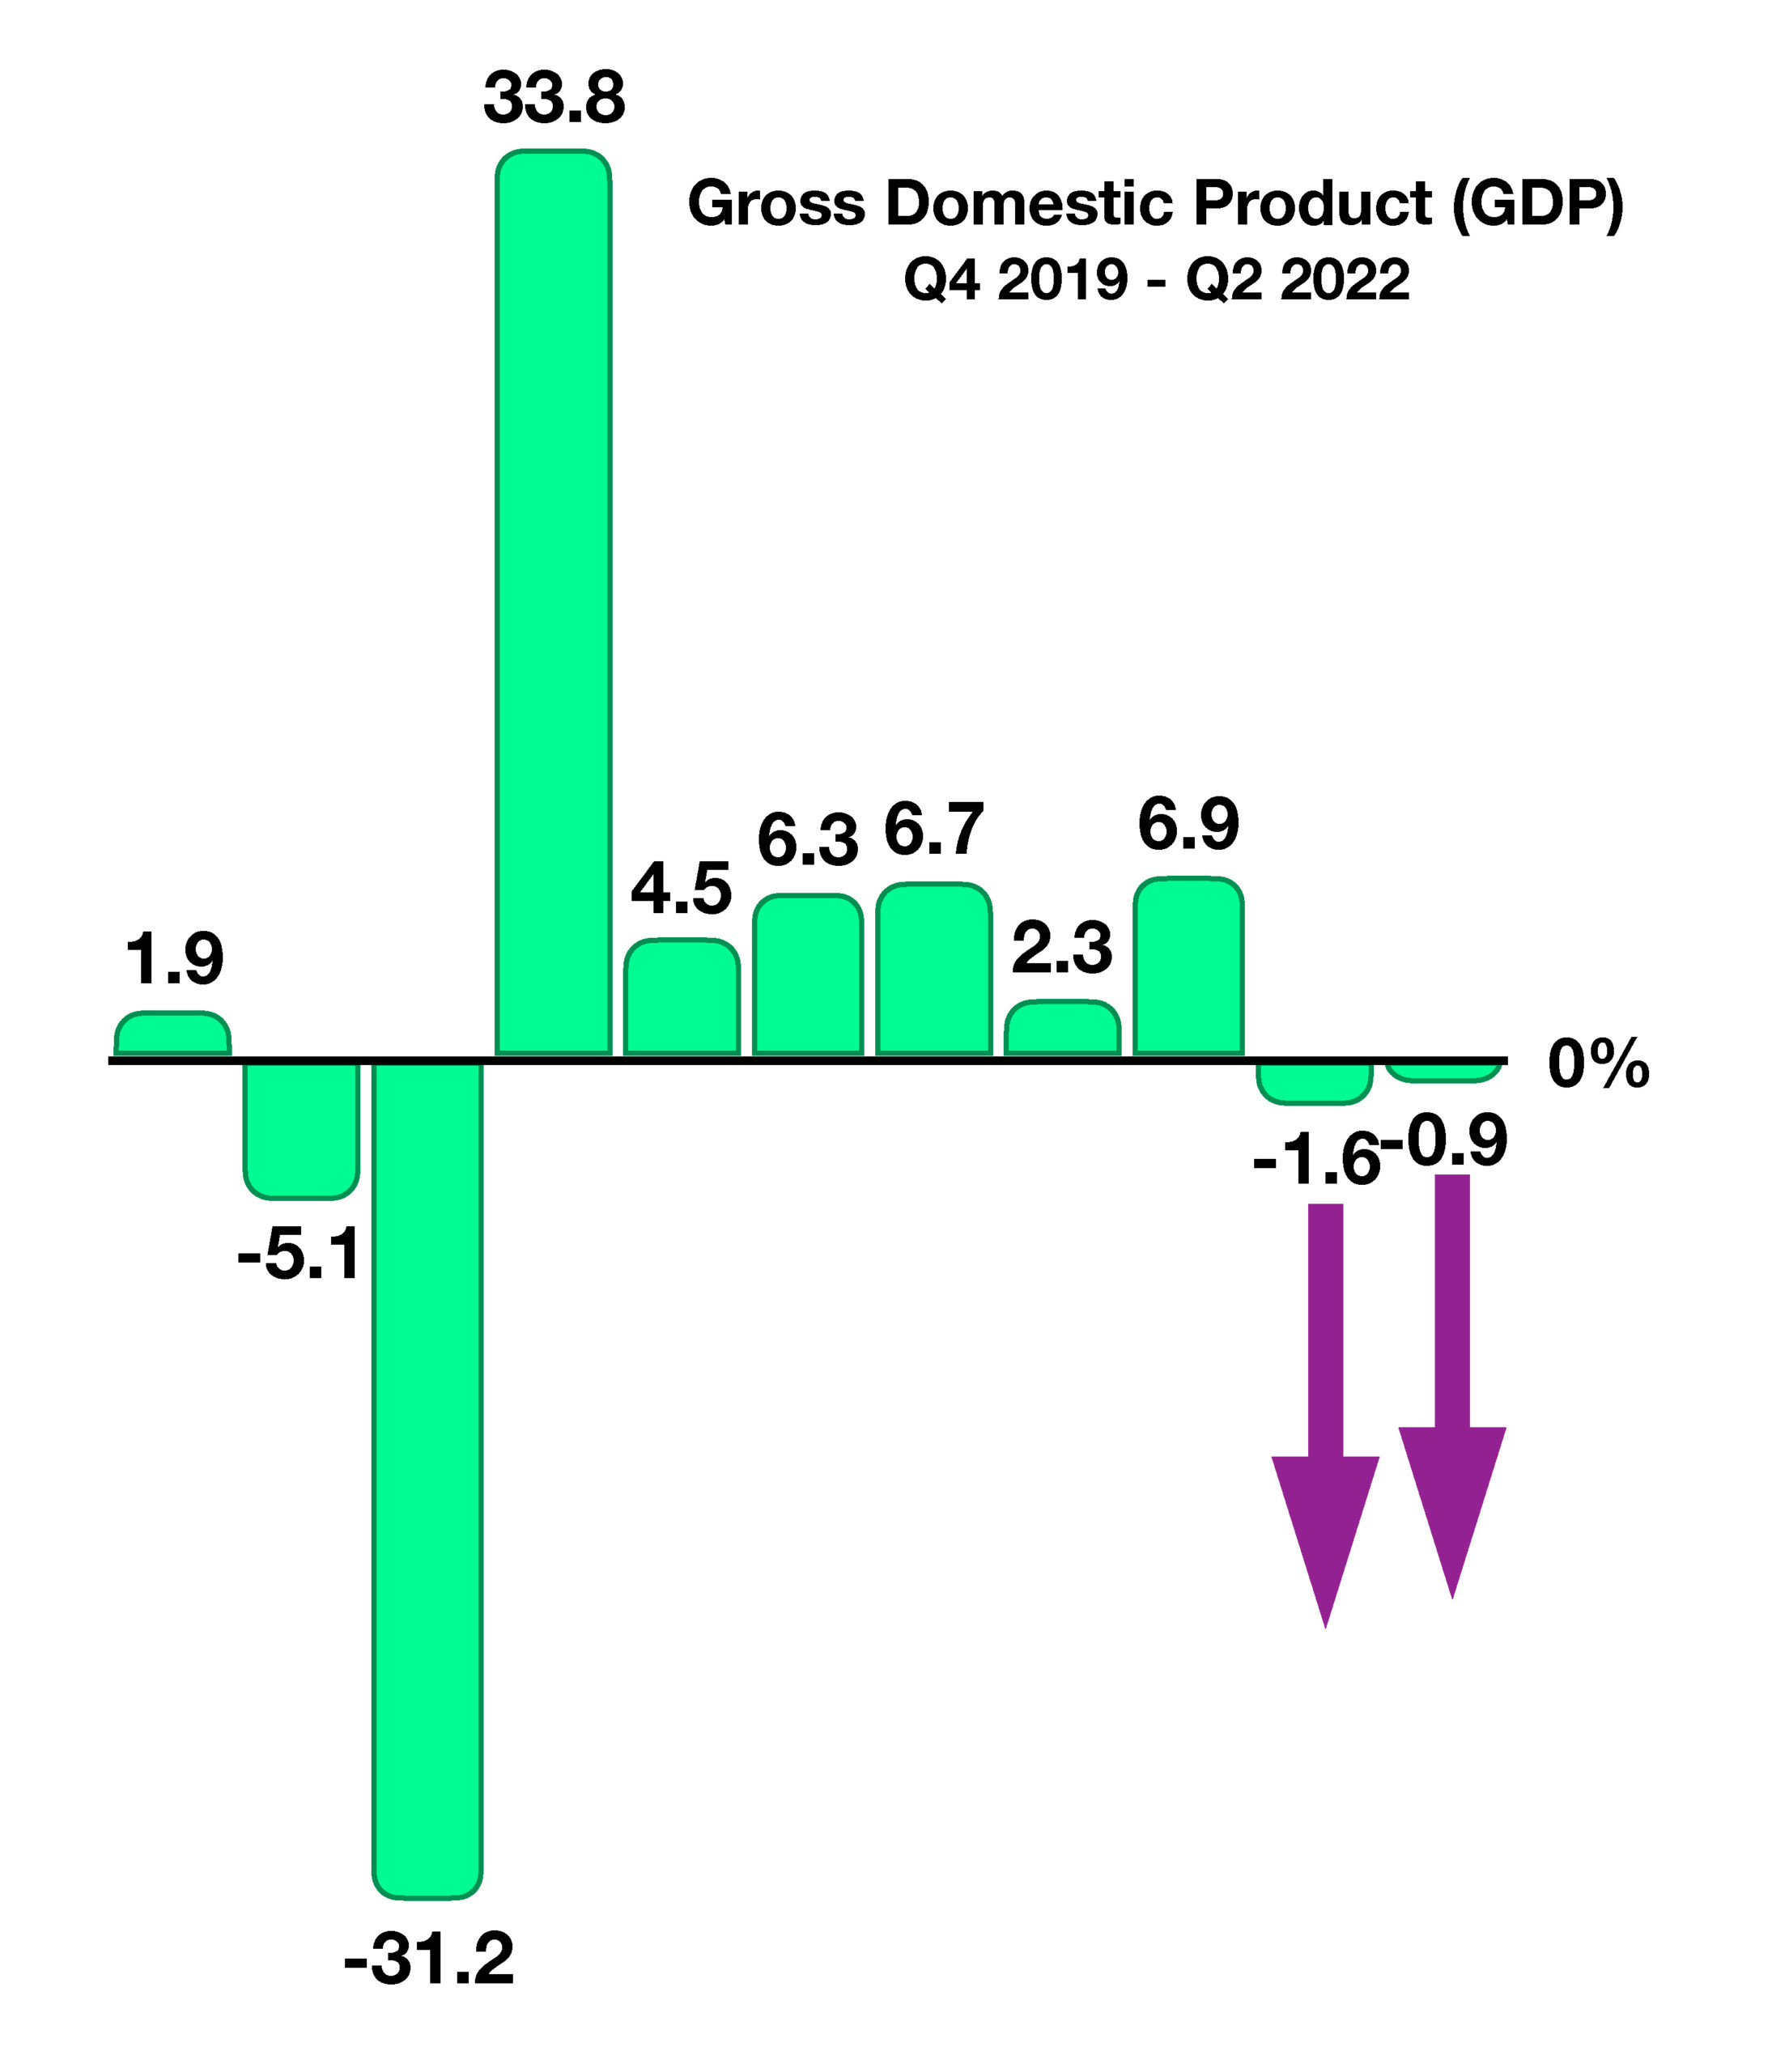
Recession concerns are rising as company earnings, employment data, and economic growth estimates continue to demonstrate an expected slowdown in the economy. Second quarter Gross Domestic Product (GDP) released in July showed a -0.9% decrease in GDP, following a -1.4% decline in the first quarter of the year. Traditional economic credence views two consecutive quarters of negative GDP as constituting a recession.
Markets were anxious in July as company earnings revealed uncertainty surrounding inflation and true economic conditions. Higher operating expenses hindered profit margins for many companies, yet allowed other companies to maintain margins as they continued to pass along elevated costs to consumers in the form of higher prices.
Inflation data showed that overall prices rose 9.1% in the past year, the fastest rise since 1981. Economists believe that the data is being muddled by record-level gasoline and food prices. With fuel prices having eased somewhat in July, upcoming inflation numbers may start to signal a pullback in inflationary pressures as we approach the fall.
The European Central Bank (ECB), the equivalent of the Federal Reserve, increased rates in July in order to help stifle rising inflationary pressures throughout Europe. Consumers in Europe are experiencing little if no respite from rapidly rising prices due to the Russian invasion of Ukraine.
The euro reached parity with the U.S. dollar in July for the first time in twenty years. The equal valuation of the two currencies has made it less costly for Americans buying European products and for those traveling to Europe.
Longer-term bond yields fell in July, even as the Fed increased short-term rates. Longer-term interest rates are essentially dictated by the markets, whereas short-term rates are set by the Federal Reserve. When short-term rates are higher than long-term rates, economists view this dynamic as indicative of slowing economic growth in the future.
The Federal Reserve imposed its second 0.75% rate increase this year, which acts as a tool for the Fed to combat inflation. Analysts have a growing consensus that the Fed may eventually pause or even reduce rates should the economy start to falter.
Sources: U.S. Bureau of Economic Analysis, ECB, Federal Reserve, U.S. Treasury
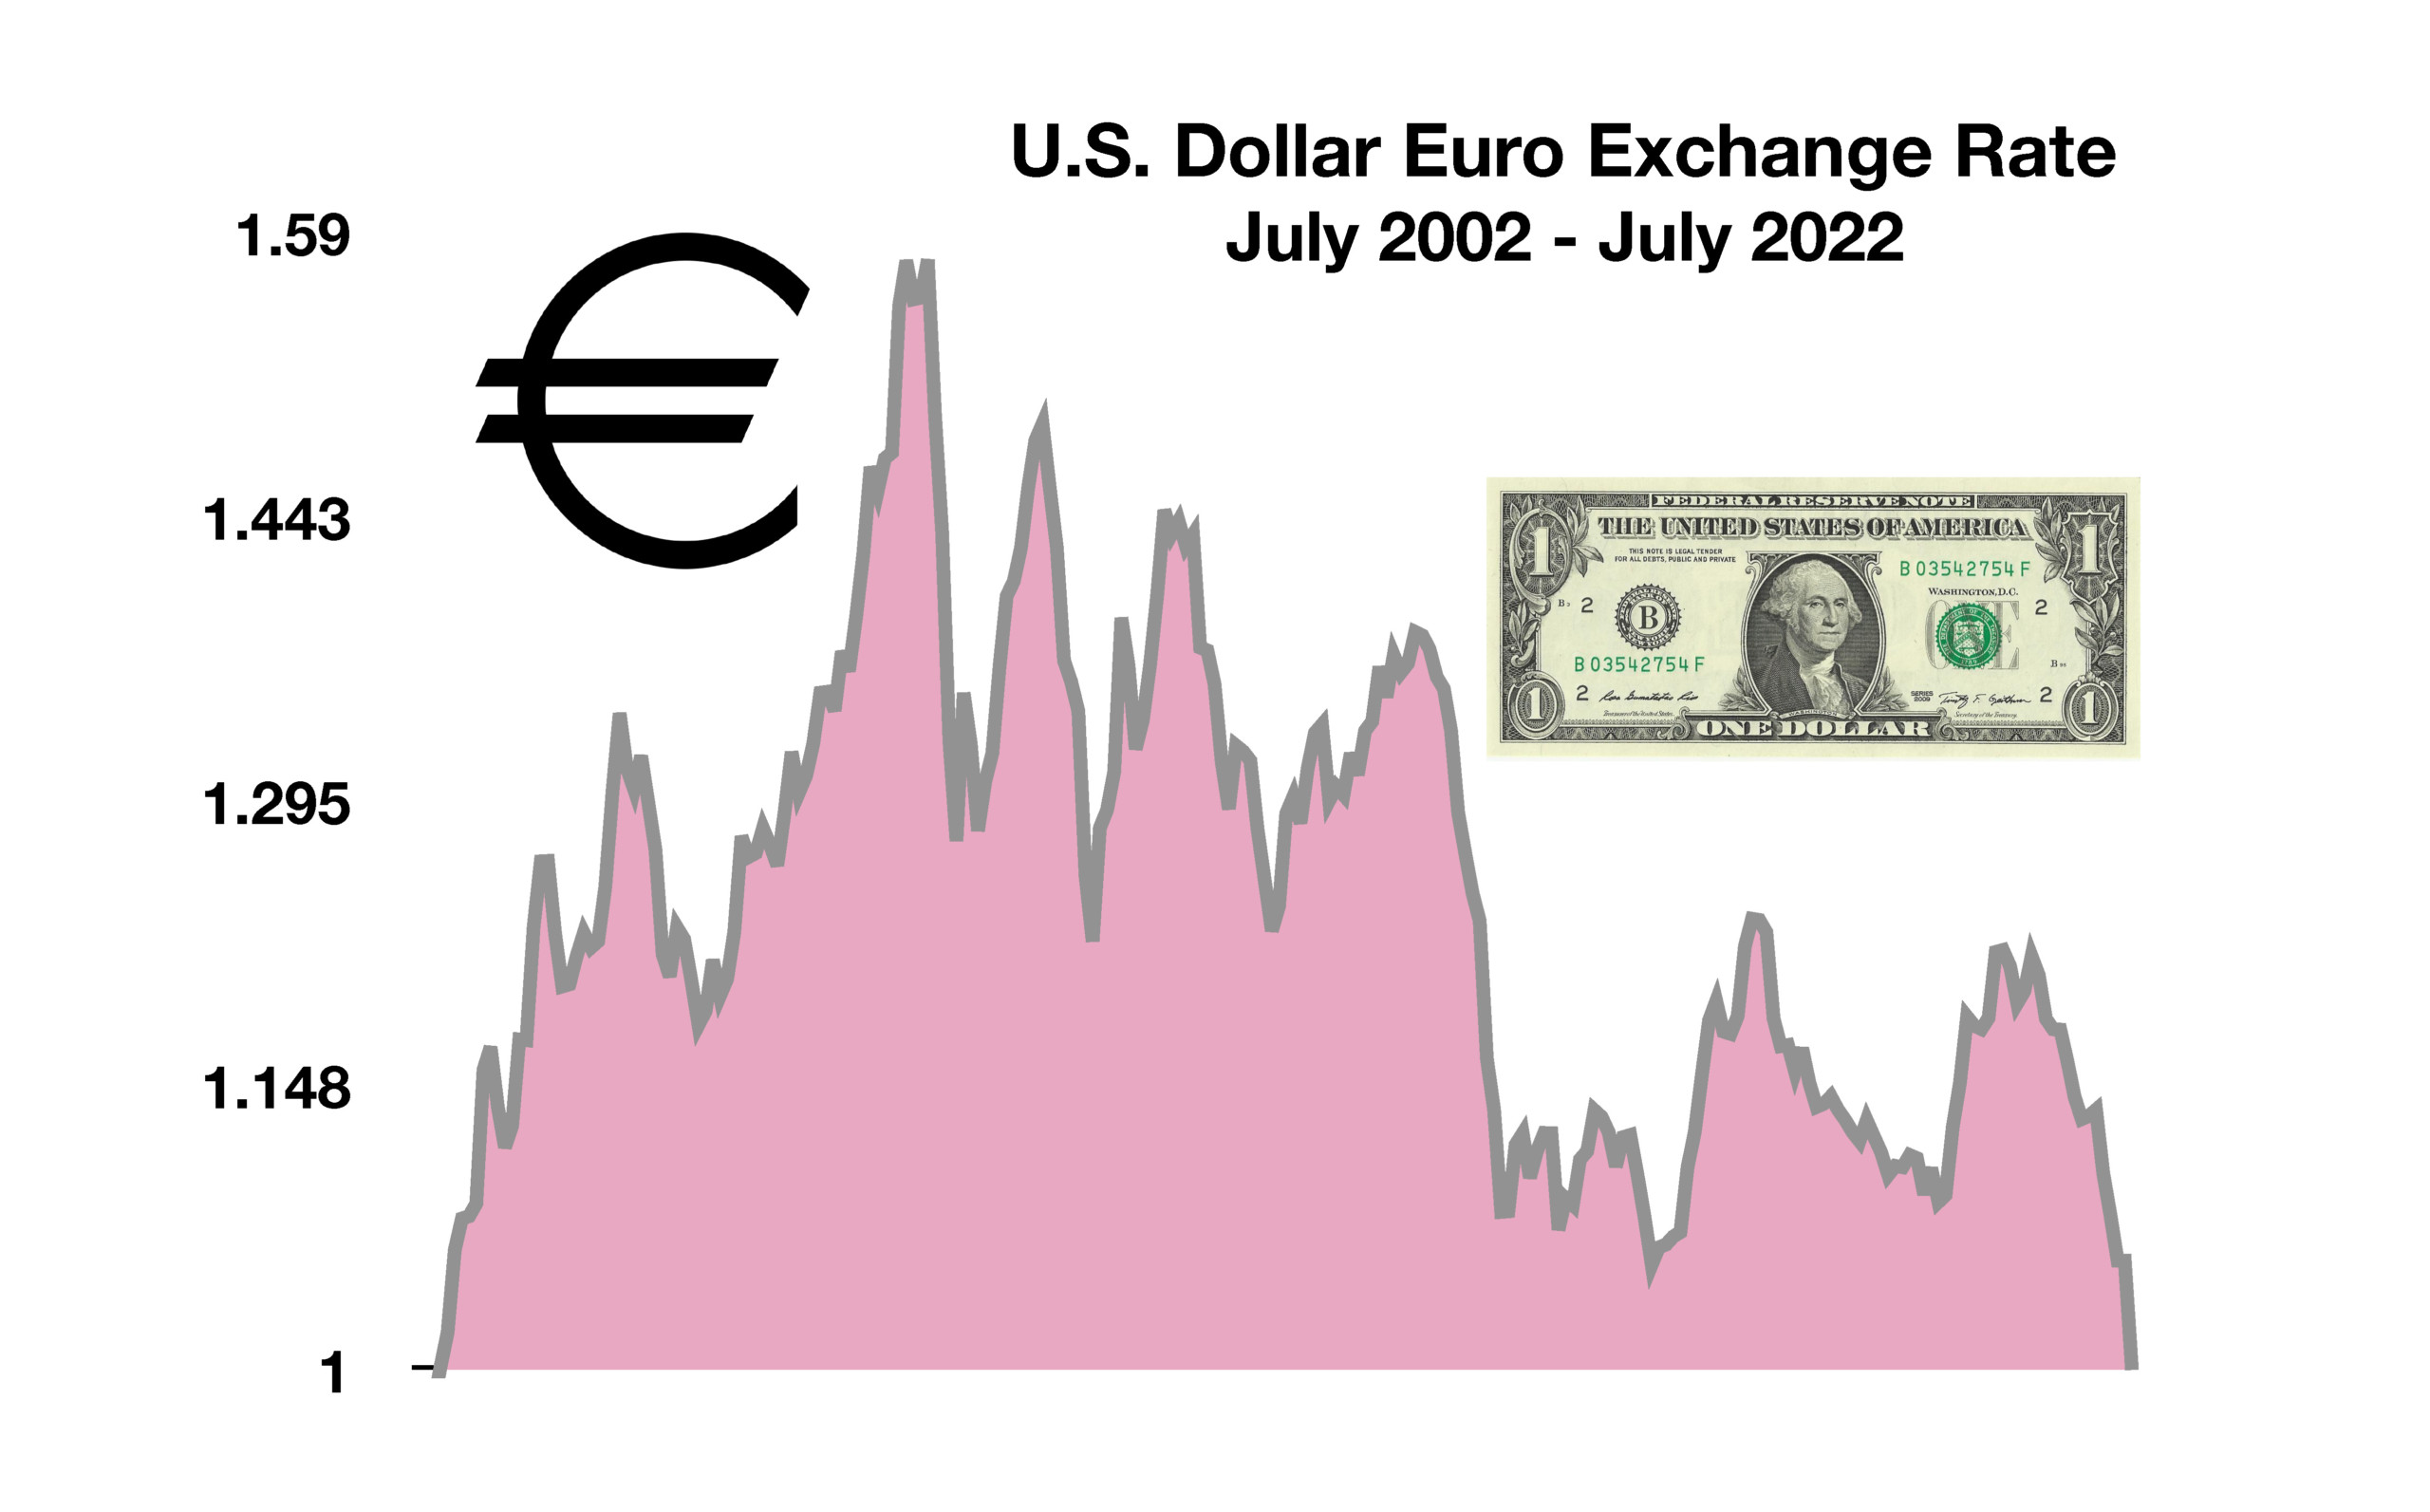 Conversely,U.S. consumers have benefited from a weakened Euro, making European products and travel less expensive for Americans. The discrepancy between the costs of goods in euros versus dollars is already high, and many European-based companies may sell goods that cost far less to buy in euros than they would in dollars. This past month, a trip to Europe as well as European imports has become less costly for Americans than it was even six months ago. (Sources: https://fred.stlouisfed.org/series)
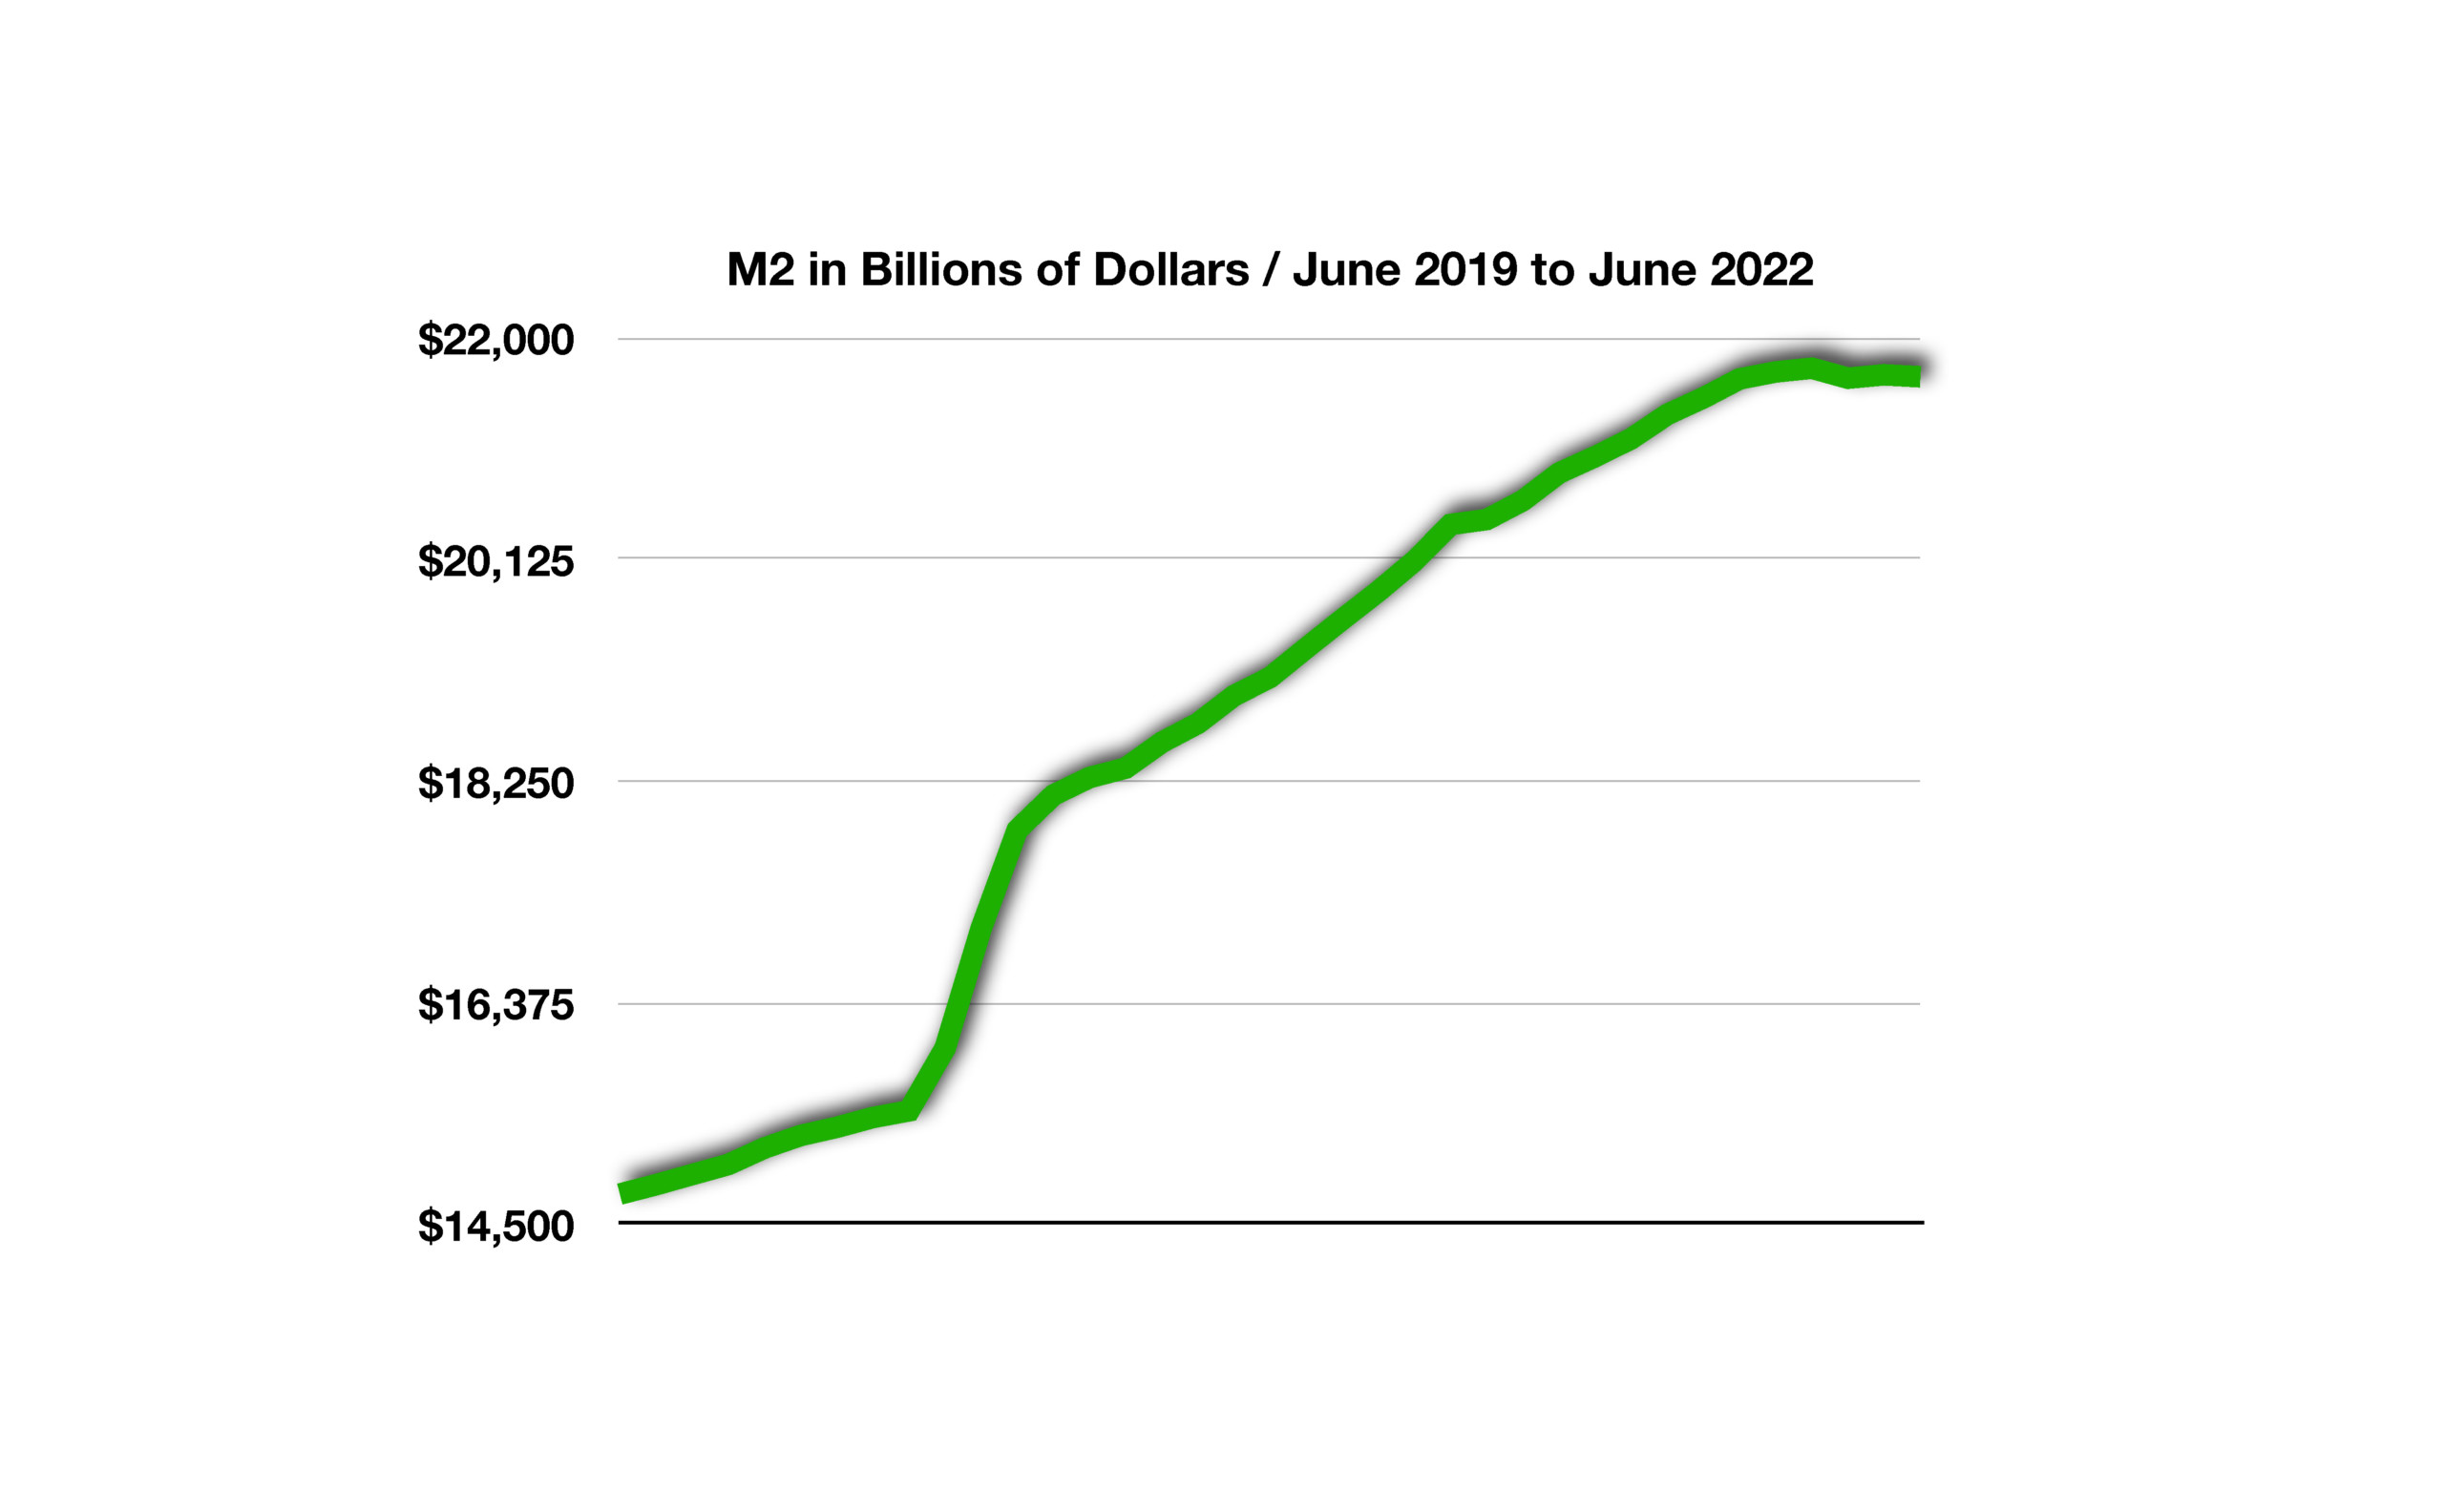 Since this historic jump, the M2 growth rate has been severely constrained, with a swift 20% drop in growth. From its 2020-2021 peak of around 26%, it has fallen to 6% as of April 2022. In its strategy to raise rates and begin quantitative tightening, the Fed has, in the three months before June, allowed M2 growth to plunge to an anemic annualized growth rate of 0.1%. When broad money supply growth falls, then spending contracts which historically has led to recessionary environments. (Sources: Federal Reserve Bank of St. Louis; Board of Governors of the Federal Reserve System (US); M2 [M2SL] Federal Reserve Bank of St. Louis: https://fred.stlouisfed.org/series/M2SL, July 28, 2022.)
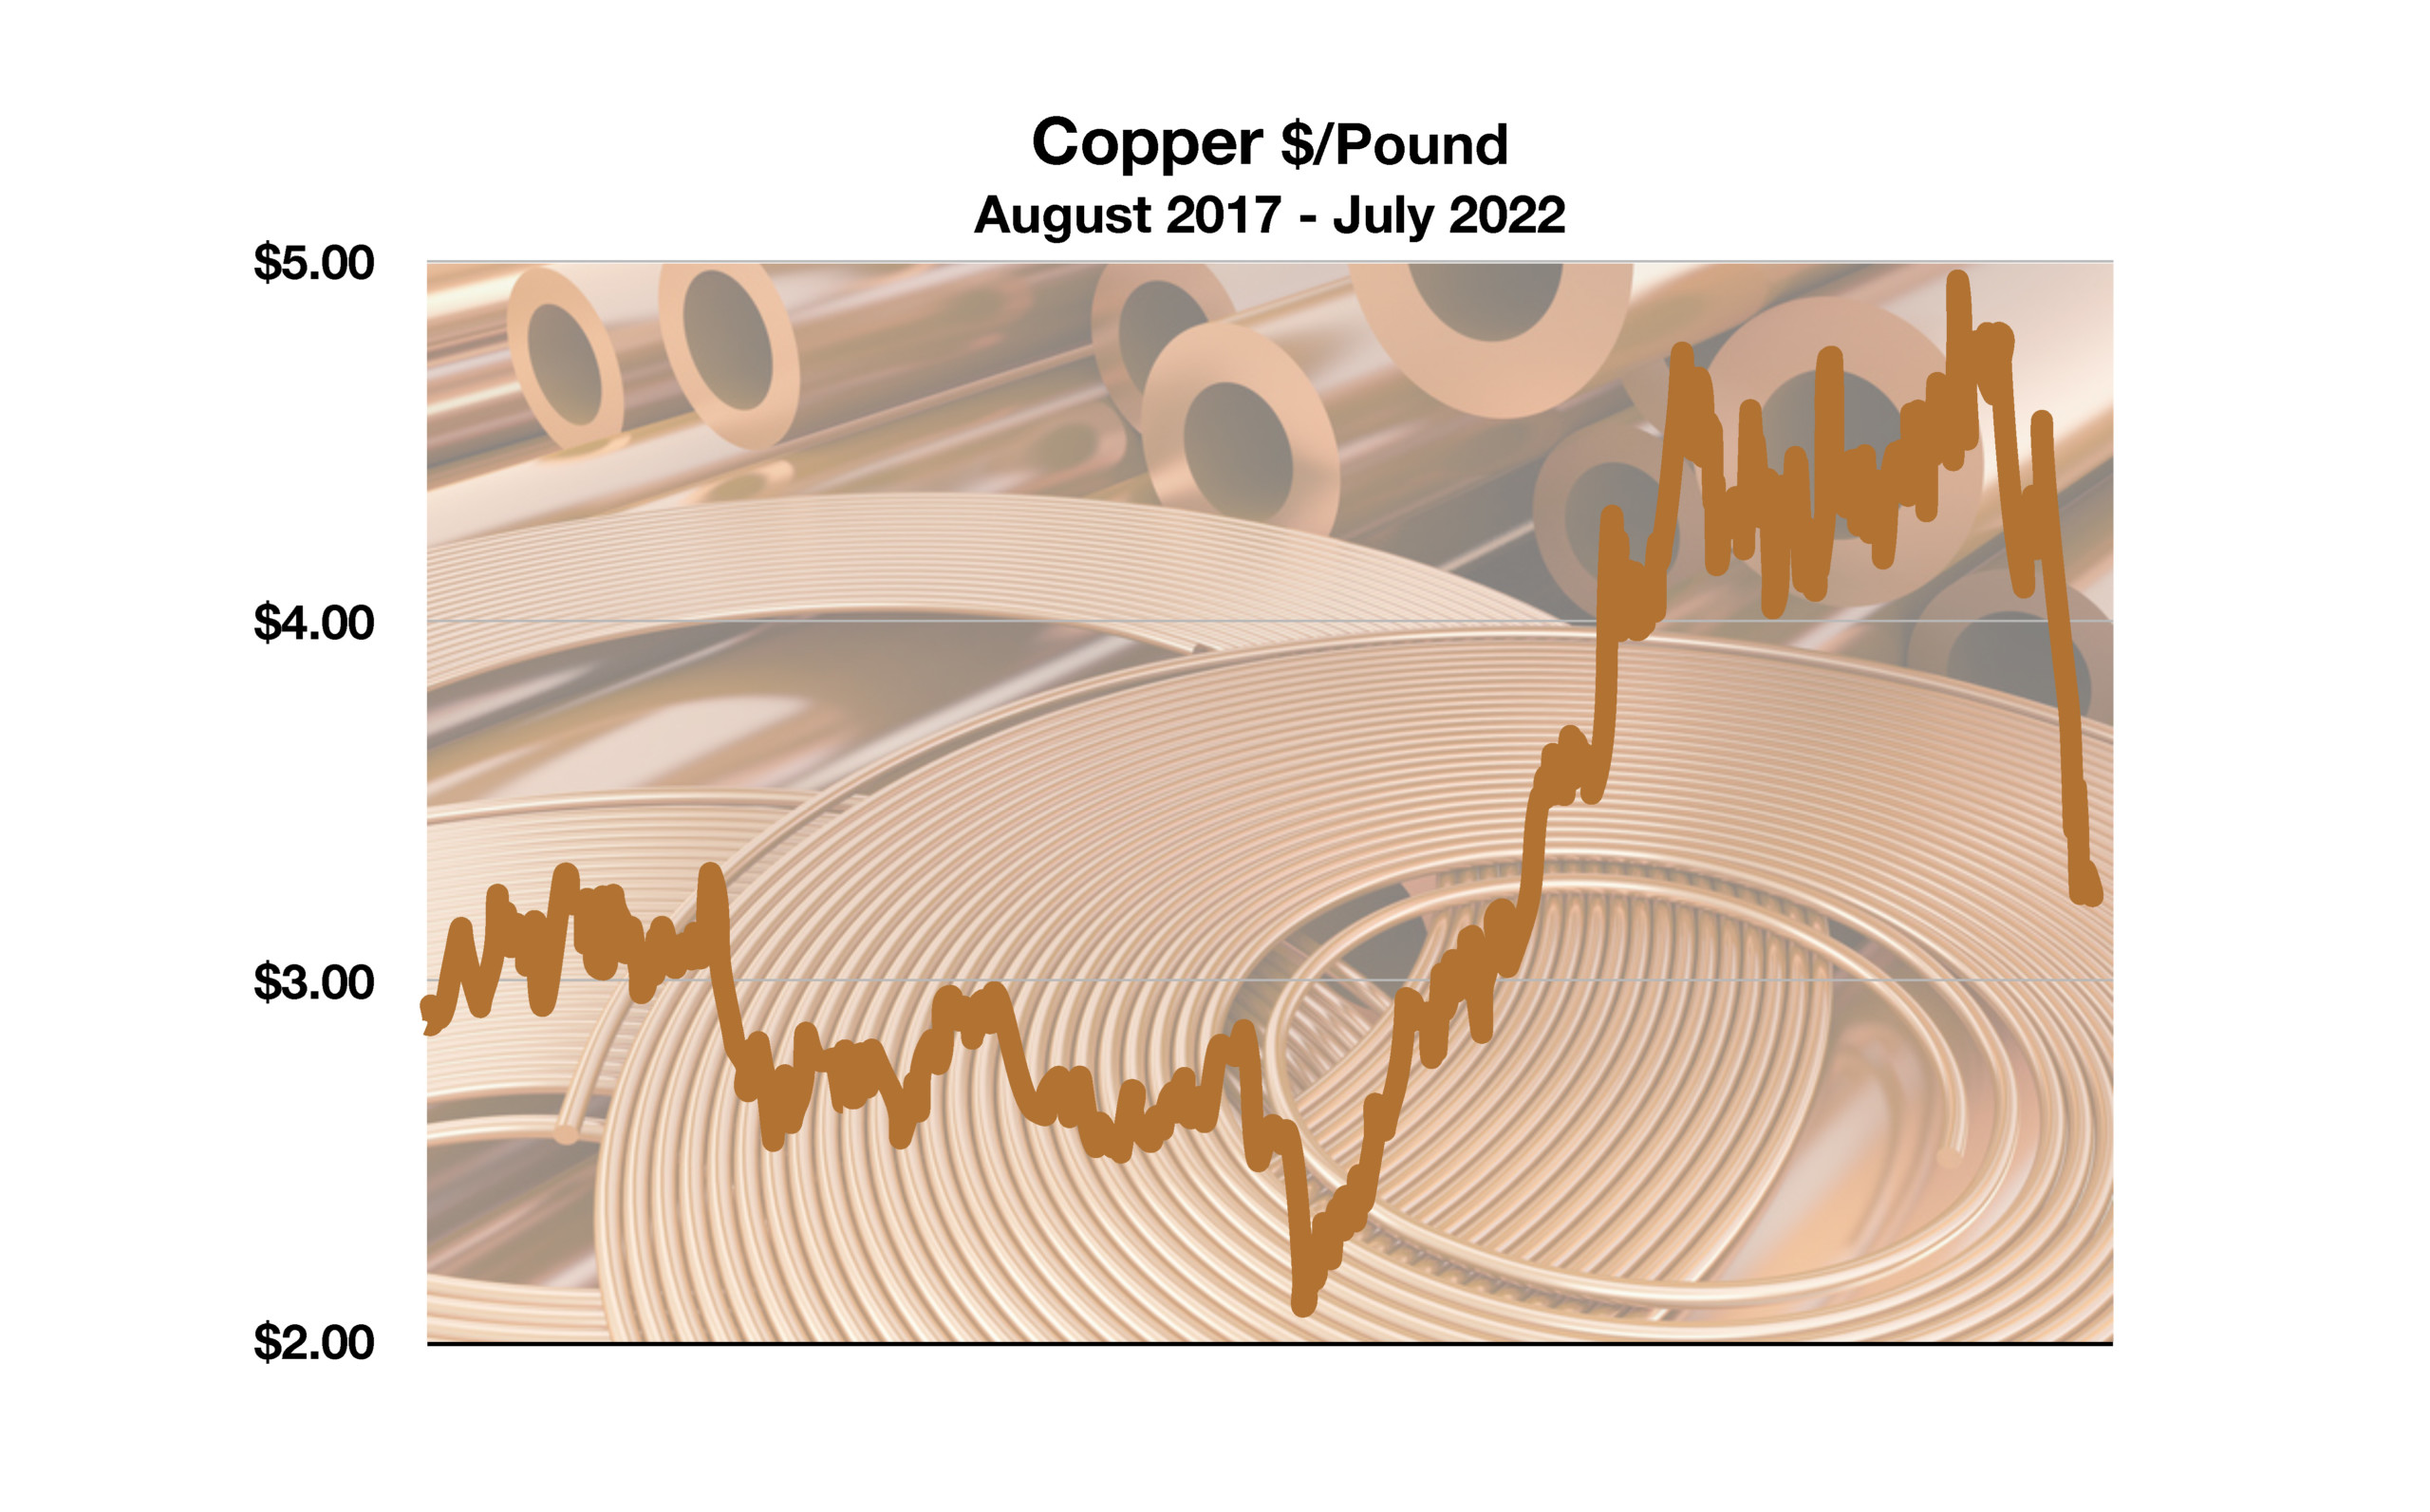 As European economies are in a clear decline with Russia limiting its suppliance of national resources, gas shortages have caused additional slashes in copper’s price. Copper is extremely useful, especially in the fast-expanding electric and environmentally sensitive markets, yet shortages of energy and natural resources have extended its fall. (Sources: Federal Reserve Bank of St. Louis; https://fred.stlouisfed.org/series/PCOPPUSDM)