Ocean Park Capital Management
2503 Main Street
Santa Monica, CA 90405
Main: 310.392.7300
Daily Performance Line: 310.281.8577
Stock Indices:
| Dow Jones | 44,094 |
| S&P 500 | 6,204 |
| Nasdaq | 20,369 |
Bond Sector Yields:
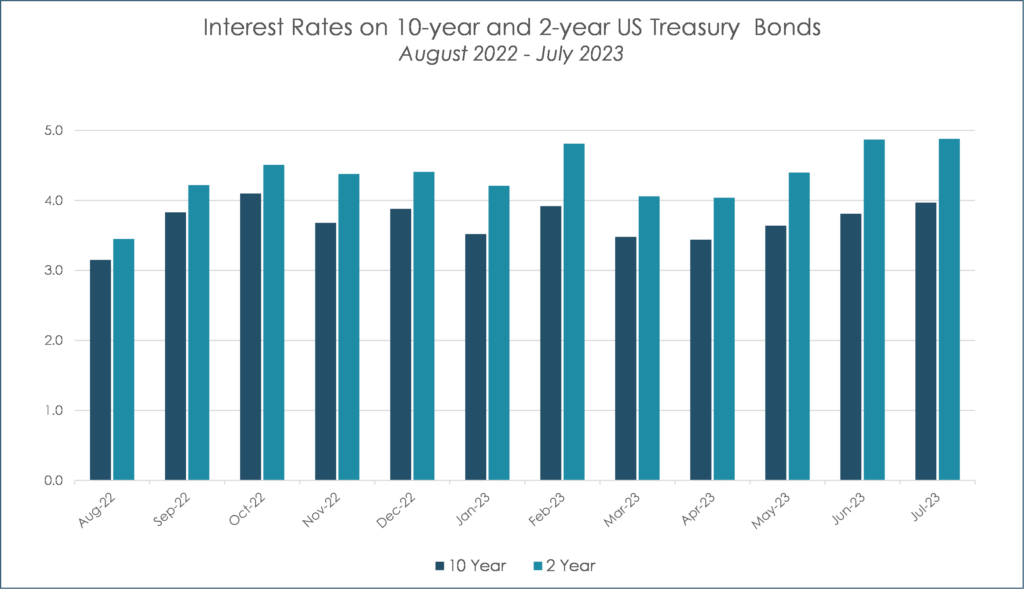
| 2 Yr Treasury | 3.72% |
| 10 Yr Treasury | 4.24% |
| 10 Yr Municipal | 3.21% |
| High Yield | 6.80% |
YTD Market Returns:
| Dow Jones | 3.64% |
| S&P 500 | 5.50% |
| Nasdaq | 5.48% |
| MSCI-EAFE | 17.37% |
| MSCI-Europe | 20.67% |
| MSCI-Pacific | 11.15% |
| MSCI-Emg Mkt | 13.70% |
| US Agg Bond | 4.02% |
| US Corp Bond | 4.17% |
| US Gov’t Bond | 3.95% |
Commodity Prices:
| Gold | 3,319 |
| Silver | 36.32 |
| Oil (WTI) | 64.98 |
Currencies:
| Dollar / Euro | 1.17 |
| Dollar / Pound | 1.37 |
| Yen / Dollar | 144.61 |
| Canadian /Dollar | 0.73 |
Portfolio Overview
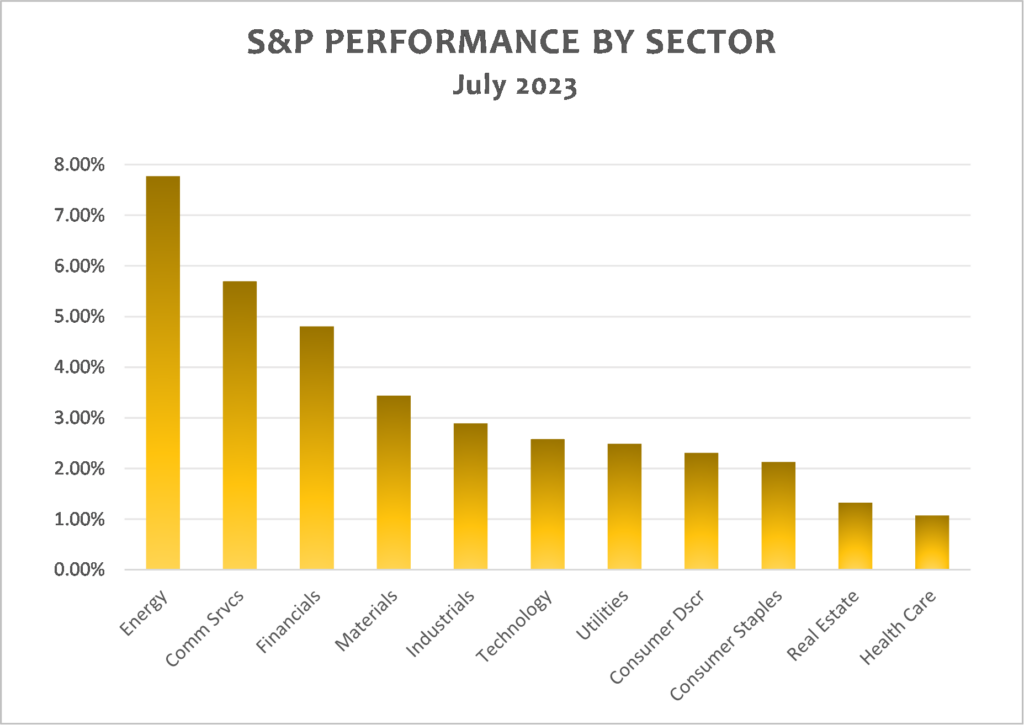
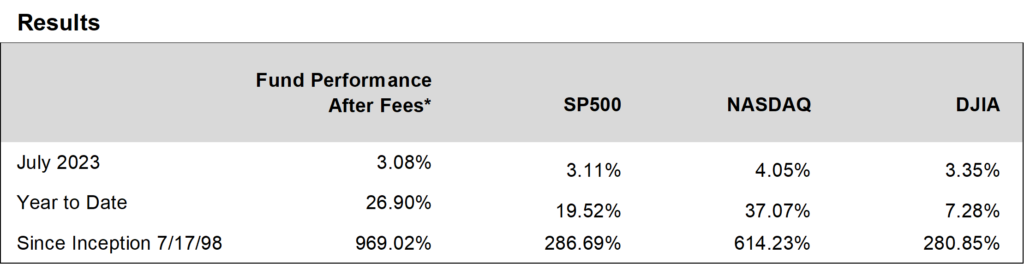
Ocean Park Investors Fund rose 3.08%* in July, while the S&P 500 rose 3.11% and the NASDAQ Composite rose 4.05%. Once again the fund’s technology holdings led the way, and once again our substantial position in Nvidia posted a double-digit gain. Nvidia has gained more than 200% this year through July, as its chips have fueled the explosion in AI development.
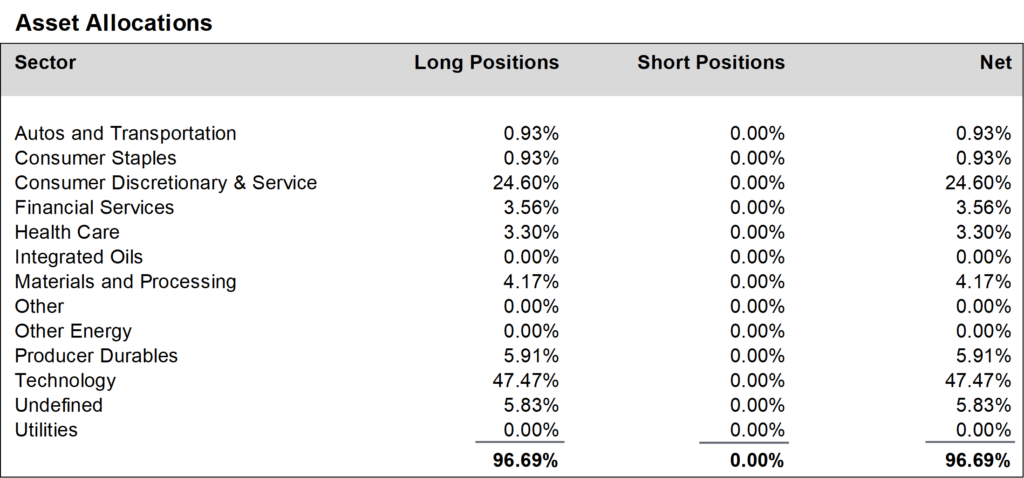
During July, we increased positions in the technology sector and reduced positions in the consumer discretionary and service sector. Notable changes included: initiating positions in Sherwin Williams and ON Semiconductors; selling Ford and Netflix after their earnings reports indicated potential long-term issues; and trimming positions in Advanced Micro Devices, Salesforce and Trade Desk. We finished the month at about 97% net long, unchanged from June.
Daily updates on our activity are available on our Results Line, at 310-281-8577, and current information is also maintained on our website at www.oceanparkcapital.com. To gain access to the site enter password opcap.
*These results are pro forma. Actual results for most investors will vary. See additional disclosures on page 4. Past performance does not guarantee future results.