Stock Indices:
| Dow Jones | 39,807 |
| S&P 500 | 5,254 |
| Nasdaq | 16,379 |
Bond Sector Yields:
| 2 Yr Treasury | 4.59% |
| 10 Yr Treasury | 4.20% |
| 10 Yr Municipal | 2.52% |
| High Yield | 7.44% |
Commodity Prices:
| Gold | 2,254 |
| Silver | 25.10 |
| Oil (WTI) | 83.12 |
Currencies:
| Dollar / Euro | 1.08 |
| Dollar / Pound | 1.26 |
| Yen / Dollar | 151.35 |
| Canadian /Dollar | 0.73 |
Longevity of the Current Bull Market
The current bull market is approaching its 8th year anniversary making it the third longest in history. Investors are looking for signs that would indicate whether we are closing in on a market top or if the rally can continue. As a tactical investment manager, Shamrock is actively reviewing data to determine if a recession is looming and how we should position portfolios. Recessions almost always are a result of one of the following:
- An inverted yield curve (short interest rates are higher than long term rates)
- Extreme spike in energy prices
- Financial imbalance
All three of these indicators are not flashing warning signs causing the Investment Committee at Shamrock to look deeper for other indicators of market stress. Many times market tops are revealed by the following indicators:
- Speculative buying with heavy retail inflows into equity funds
- A big pick up in corporate merger and acquisitions
- A surge in IPOs
- Deterioration in market technicals with a shift towards defensive sector leadership
While the average retail investor has become more bullish, we are no where close to extreme levels witnessed before the tech wreck in 2000 and the housing crisis in 2007. M&A actively increased in 2016 and ended up being the third most active year falling only behind 2015 and 2007. 2016 was one of the slowest years for IPOs since 2009. Post the presidential election in 2016, we witnessed a shift from defensive sectors leading the market to more cyclical sectors showing the greatest growth potential. While the increase in M&A activity concerns us, the other warning signs are not indicating that a major market correction is looming.
With no clear signs that a market top is imminent, we are watching the following signals that could sugest the bull market is nearing an end.
- Rising Real Interest Rates
- Widening Credit Spreads
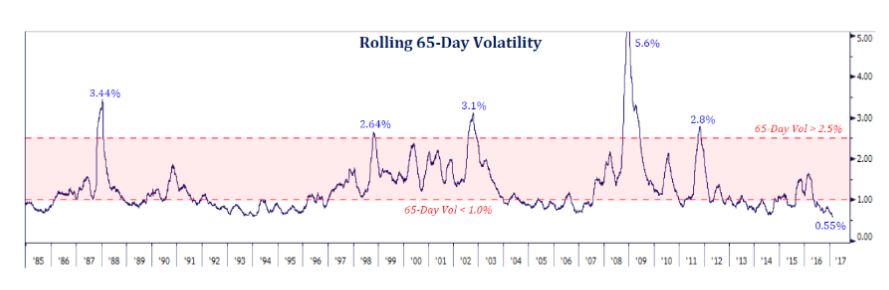
- An Increase in Volatility & More Frequent Market Corrections
Interest Rate Levels
After raising the Federal Funds Rate by 25 basis points in December, the Fed has signaled that it expects three additional rate hikes in 2017. With inflation on the rise and US GDP expanding in 2017, additional rate hikes are warranted. Shamrock is confident that the US economy can sustain higher interest rates; however, if the Fed were to raise rates too high too quickly that could cause the yield curve to invert and would choke off growth and could lead to a recession. Runaway inflation has the same negative impact on wealth as does declining asset prices, and therefore Shamrock is in agreement that the Fed should raise rates to prevent hyperinflation.
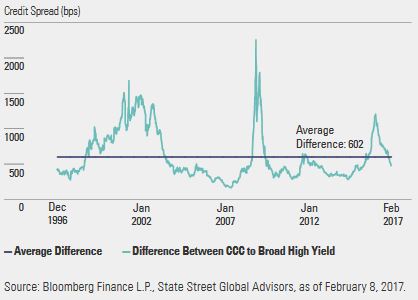
 Source: Strategas. As of: 2-16-17