Ocean Park Capital Management

2503 Main Street

Santa Monica, CA 90405

Main: 310.392.7300

Daily Performance Line:  310.281.8577

November 2016 Performance
Market Update
(all values as of 04.28.2023)

Stock Indices:

Dow Jones 34,098
S&P 500 4,169
Nasdaq 12,226

Bond Sector Yields:

2 Yr Treasury 4.04%
10 Yr Treasury 3.44%
10 Yr Municipal 2.36%
High Yield 8.19%

YTD Market Returns:

Dow Jones 2.87%
S&P 500 8.59%
Nasdaq 16.82%
MSCI-EAFE 10.28%
MSCI-Europe 13.87%
MSCI-Pacific 3.86%
MSCI-Emg Mkt 2.16%
 
US Agg Bond 3.59%
US Corp Bond 4.29%
US Gov’t Bond 3.82%

Commodity Prices:

Gold 1,999
Silver 25.33
Oil (WTI) 76.63

Currencies:

Dollar / Euro 1.10
Dollar / Pound 1.24
Yen / Dollar 133.79
Canadian /Dollar 0.73
 

Fund Overview

Equities rebounded in November, with all the major indices and the Ocean Park funds posting solid gains.  The funds’ performance lagged the indices somewhat, as the post-election rally favored energy, defense, and infrastructure stocks in which the funds are lightly invested.

For the month of November, after fees, Ocean Park Investors Fund gained 1.67%*, while the S&P 500 gained 3.42% and the NASDAQ Composite gained 2.59%.  For the year to date through October, after fees, OPI is down 2.47%*, while the S&P 500 is up 7.58% and the NASDAQ Composite is up 6.32%.

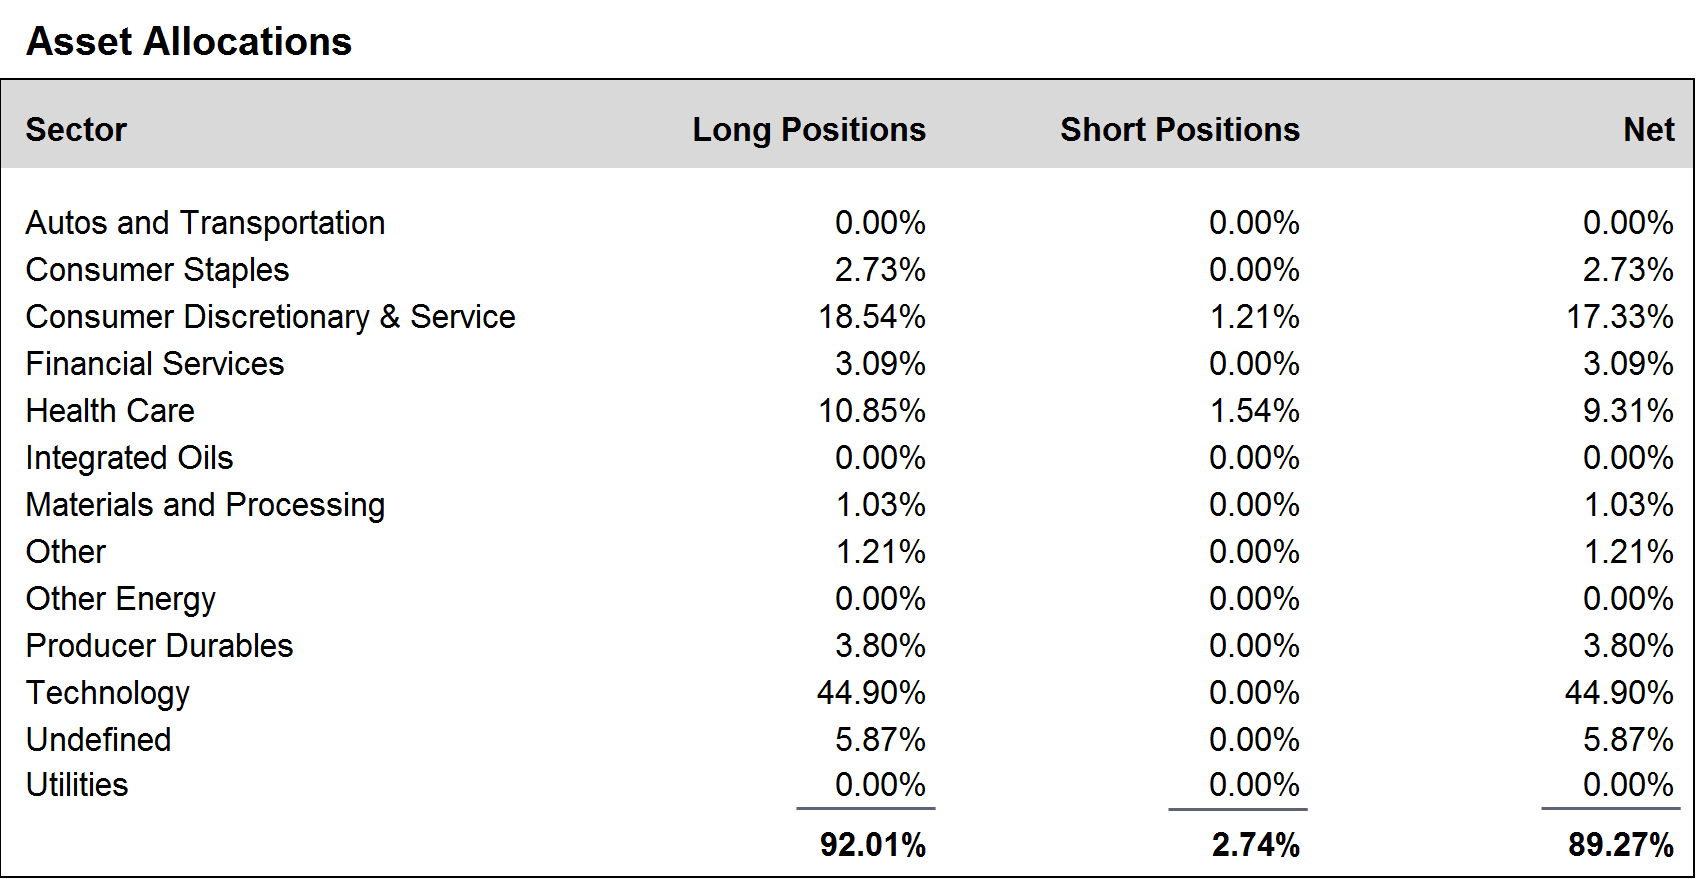
During November, we added to positions in the technology sector, and reduced positions in the consumer discretionary and service and the producer durables sectors.  We finished the month at about 89% net long, up from about 88% at the end of October.

A schedule showing the performance of the Investors Fund is included below, along with our Asset Allocation Chart. Daily updates on our activity are available on our Results Line, at 310-281-8577, and current information is also maintained on our website at www.oceanparkcapital.com. To gain access to the site enter password opcap.

*These results are pro forma.  Actual results for most investors will vary.  See additional disclosures on page 4.   

Past performance does not guarantee future results.


November 2016 - Equity Overview

Equity Overview

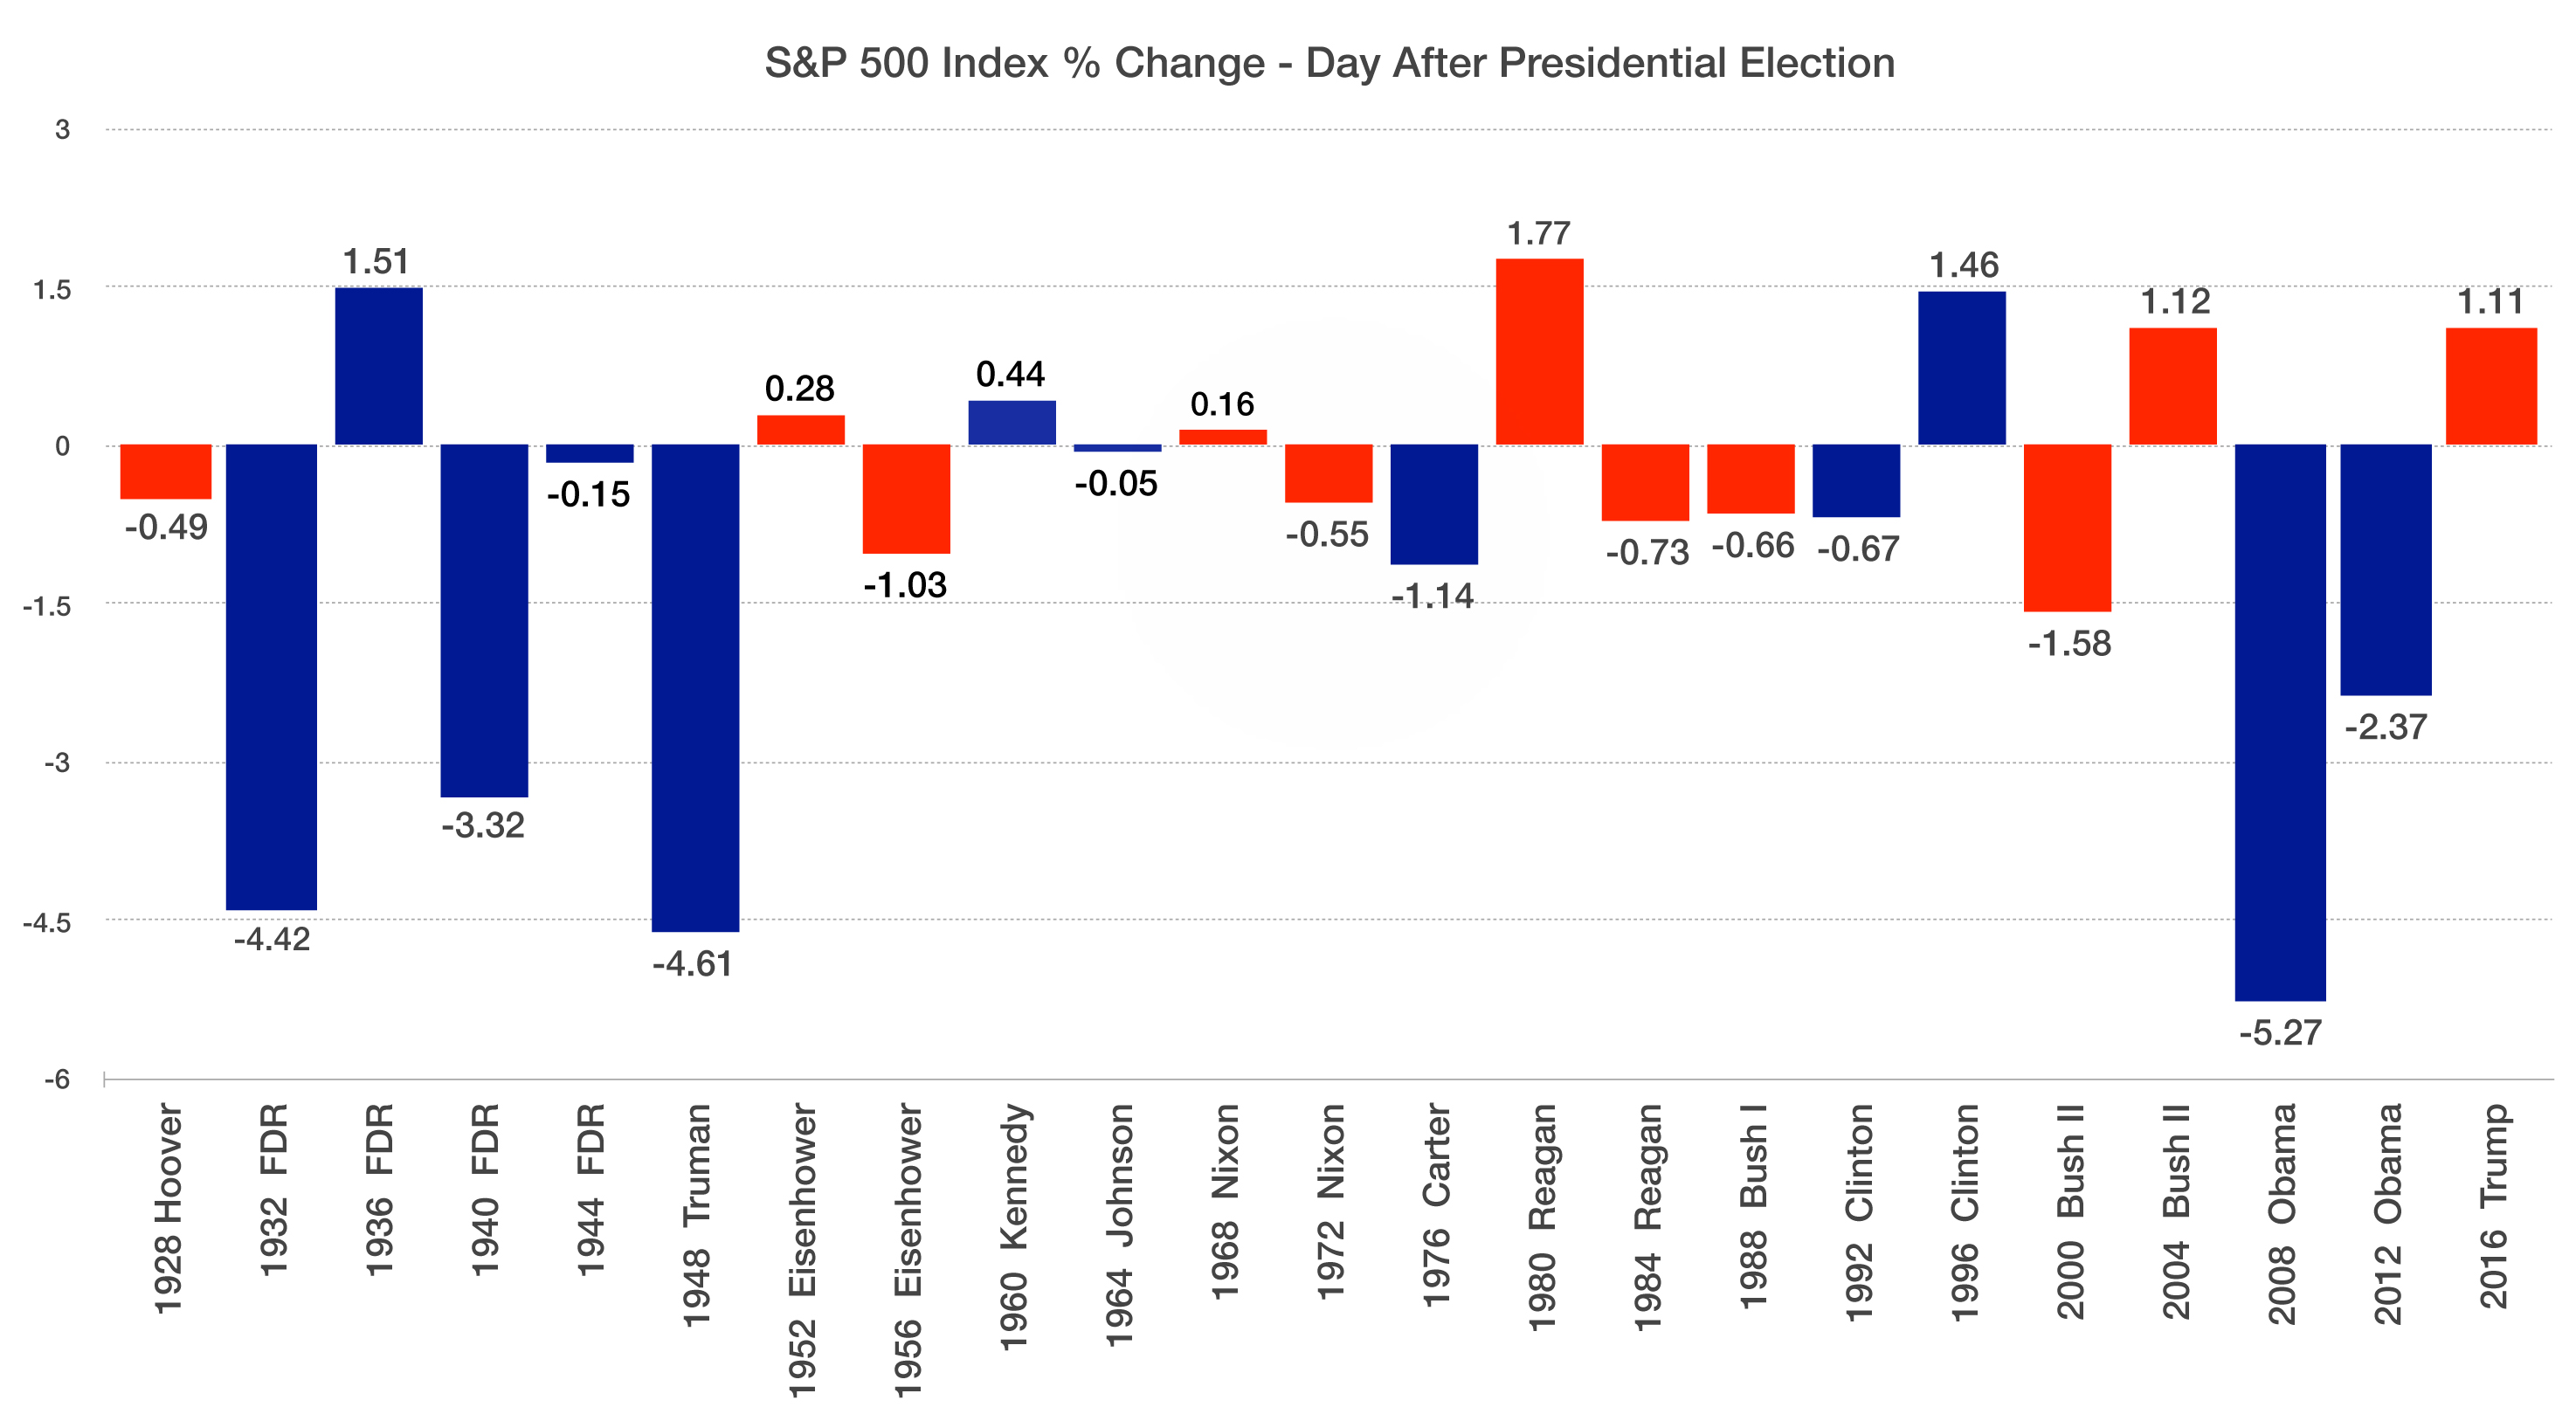
Many analysts believe that the stock market rally following Trump’s election reflects the expectations of a new era of fiscal stimulus. Both economists and analysts agree that the Fed has basically exhausted all of its stimulus efforts by means of using traditional and newly devised monetary policy tools that may no longer be effective.

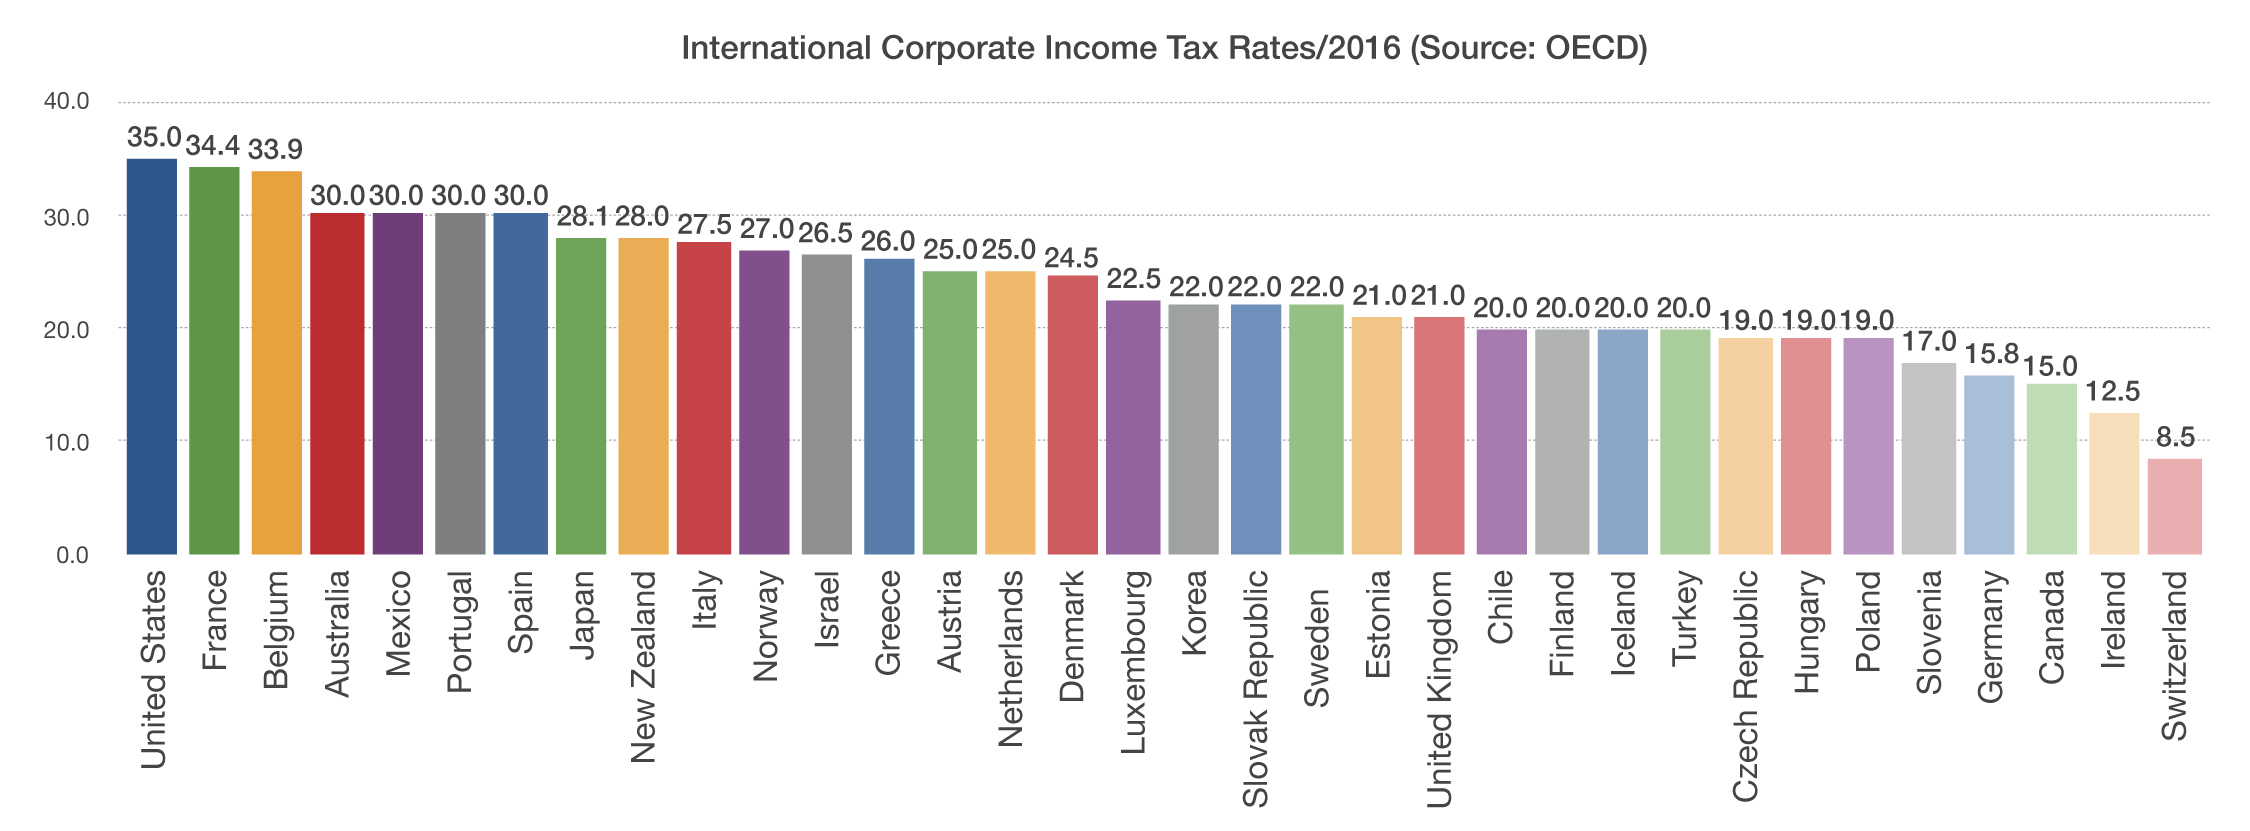
Small caps outperformed large caps following the election, primarily driven by the growth factors expected to benefit small cap stocks. Proposed corporate tax rate cuts also favor small caps, which benefit more than large caps from tax rate reductions. Proposed deregulation is good for small caps as large caps are better suited to handle the higher costs of regulation.

Protectionism could benefit small company stocks which typically generate less than 20% of their sales overseas while larger company stocks generate well over 30% from overseas sales. A reduction in the corporate tax rate to 15% could also be more beneficial for small company stocks, which generally don’t have the resources to bring tax rates below 35%.


November 2016 - Macro Overview

Macro Overview

Consumer sentiment, interest rates, and equity markets all increased in November following the surprise election results.  Infrastructure spending, manufacturing, a reduced regulatory environment, trade agreements, and fiscal stimulus are favorably perceived by much of Wall Street as primary objectives of the president-elect.

A shift towards fiscal stimulus, as proposed by the incoming administration, is expected to help ease the burden on the Federal Reserve. Fiscal stimulus can create higher wages and spending by means of lower taxes, eventually leading to moderate inflation, which is one of the Fed’s objectives.

The Dow Jones Transportation Average climbed 11% for the month, its single largest monthly gain since October 2011. As a leading indicator of economic growth, strong gains in the transportation index are often indicative of improving economic conditions.

A byproduct of rising rates in November, stemming from optimistic economic growth forecasts, led to a considerably stronger U.S. dollar. The challenge for the new administration will be harnessing the dollar’s strength for U.S. imports, yet finding ways to make U.S. products affordable in the world marketplace.

OPEC agreed to cut oil production among its 13 members by 1.2 million barrels a day from the current 33.6 million barrels. The agreed upon reduction would reduce global output by about 1%, easing high levels of supplies and stabilize prices.

Markets are closely watching Trump’s cabinet appointments since several of the appointments are instrumental in orchestrating the direction of various industries, taxes, regulations, and economic growth.


November 2016 - Privacy Notice


Privacy Notice

Federal privacy laws require that we explain to you how we handle “nonpublic personal information.”  This is information we receive or develop about you in the course of our relationship with you.  It includes information you provide to us orally or in the Confidential Investor Questionnaire or other forms, and information we learn about you in the course of providing services to you.

We do not disclose nonpublic personal information about you to third parties, except in certain limited circumstances.  These circumstances include (a) disclosure to our attorneys, auditors, prime brokers, or custodians in the course of providing services to you, (b) disclosure with your consent, or (c) disclosure where required by law or judicial process, such as a court order.

We also restrict your nonpublic personal information to those employees who need to know such information in order to provide services to you.  And we maintain physical, electronic, and procedural safeguards to protect your nonpublic personal information.

Please contact us if you have any questions.


Additional Disclosures

Performance data for OPI reflect the reinvestment of dividends and other earnings on the fund’s assets.  Performance data for the major indices reflect only changes in the value of those indices, and would be higher if dividends were included. However, the index data do not reflect fees that would be paid to index fund managers and transaction costs that would be incurred when their component stocks are bought or sold, while OPI’s data do reflect quarterly fees and expenses incurred by the fund.  The information provided is believed to be reliable, but its accuracy or completeness is not warranted. This material is not intended as an offer or solicitation for the purchase or sale of any stock, bond, mutual fund, or any other financial instrument. The views and strategies discussed herein may not be appropriate and/or suitable for all investors. This material is meant solely for informational purposes, and is not intended to suffice as any type of accounting, legal, tax, or estate planning advice. Any and all forecasts mentioned are for illustrative purposes only and should not be interpreted as investment recommendations.