December 2016
Market Update
(all values as of 04.30.2024)

Stock Indices:

Dow Jones 37,815
S&P 500 5,035
Nasdaq 15,657

Bond Sector Yields:

2 Yr Treasury 5.04%
10 Yr Treasury 4.69%
10 Yr Municipal 2.80%
High Yield 7.99%

YTD Market Returns:

Dow Jones 0.34%
S&P 500 5.57%
Nasdaq 4.31%
MSCI-EAFE 1.98%
MSCI-Europe 2.05%
MSCI-Pacific 1.82%
MSCI-Emg Mkt 2.17%
 
US Agg Bond 0.50%
US Corp Bond 0.56%
US Gov’t Bond 0.48%

Commodity Prices:

Gold 2,297
Silver 26.58
Oil (WTI) 81.13

Currencies:

Dollar / Euro 1.07
Dollar / Pound 1.25
Yen / Dollar 156.66
Canadian /Dollar 0.79
 

Macro Overview

A monumental shift occurred in November as consumer sentiment, interest rates, and equity markets all increased with growth expectations settling in. Infrastructure spending, manufacturing, a friendlier regulatory environment, trade agreements, and fiscal stimulus have become the primary objectives of the president-elect.

A shift towards fiscal stimulus, as proposed by the incoming administration, is expected to help ease the burden on the Federal Reserve. Fiscal stimulus creates higher wages and spending by means of lower taxes, eventually leading to inflationary pressures, which is one of the Fed’s objectives.

Equity markets rallied in November with the Dow Jones Industrial Index breaching the 19,000 level, a record high for the index. The Dow Jones Transportation Average climbed 11% for the month, it’s single largest monthly gain since October 2011. As a leading indicator of economic growth, strong gains in the transportation index are often indicative of improving economic conditions.

Pres Elec Day S&P % Chng-Basic Charts

A byproduct of rising rates in November, stemming from optimistic economic growth forecasts, led to a considerably stronger U.S. dollar. The challenge for the new administration will be harnessing the dollar’s strength for U.S. imports, yet finding ways to make U.S. products affordable in the world marketplace.

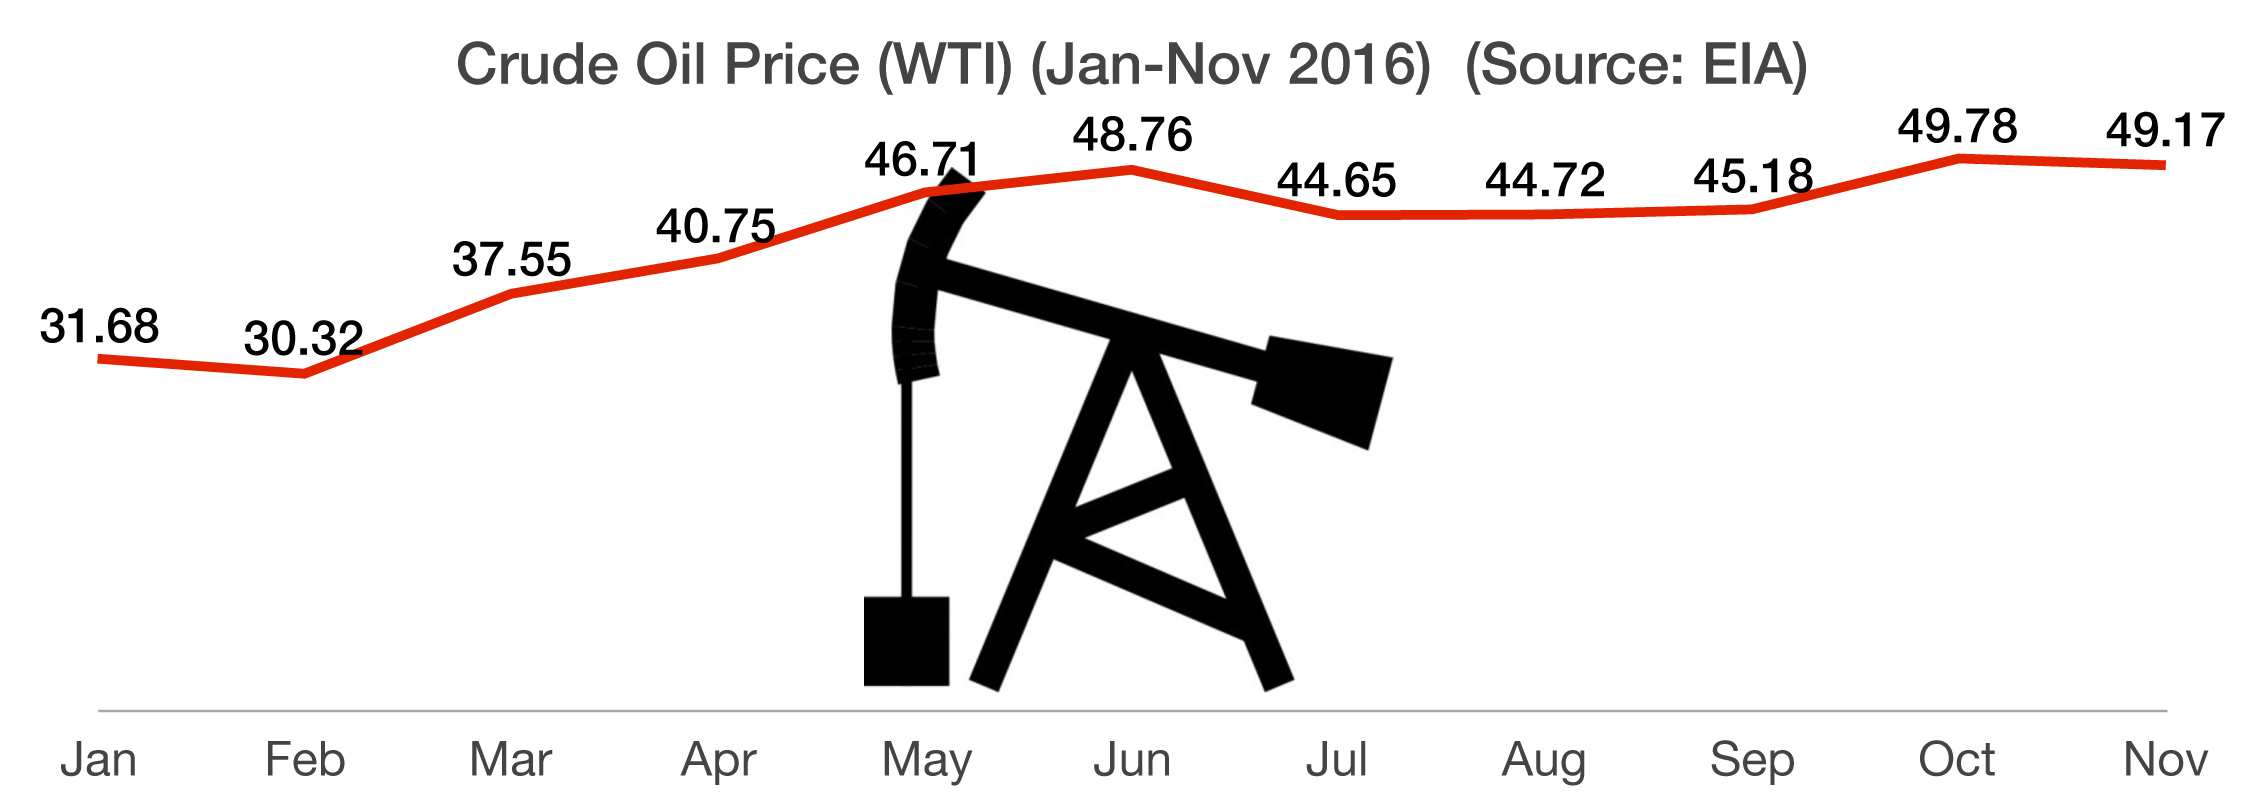
OPEC agreed to cut oil production among its 13 members by 1.2 million barrels a day from the current 33.6 million barrels. The agreed upon reduction would reduce global output by about 1%, easing high levels of supplies and stabilize prices.

Markets are closely watching Trump’s cabinet appointments since several of the appointments are instrumental in orchestrating the direction of various industries, taxes, regulations, and economic growth. (Sources: Fed, OPEC, Reuters, BLS)


The U.S. Has The Highest Corporate Tax Rate In The World At 35%

Stock Indices Reach New Highs – Domestic Equity Overview

Many analysts believe that the stock market rally following Trump’s election reflects the expectations of a new era of fiscal stimulus. Both economists and analysts agree that the Fed has basically exhausted all of its stimulus efforts by means of using traditional and newly devised monetary policy tools that are now considered ineffective.

Small caps outperformed large caps following the election, primarily driven by the growth factors expected to benefit small cap stocks. Proposed corporate tax rate cuts also favor small caps, which benefit more than large caps from tax rate reductions. Proposed deregulation is good for small caps as large caps can handle higher costs of regulation easier than small caps, leaving small caps to benefit the most under deregulation.

Protectionism is expected to benefit small company stocks which typically generate less than 20% of their sales overseas while larger company stocks generate well over 30% from overseas sales. A reduction in the corporate tax rate to 15% would be much more beneficial for small company stocks, which generally don’t have the resources to bring tax rates below 35%.

The Dow Jones Industrial Average reached 19,000 in November, a milestone level for the index, which was at 1000 in November 1972. The Dow Jones Industrial Average rose 5.4% in November, while the S&P 500 Index increased by 3.4% and the Nasdaq Composite added 2.6% for the month. The Dow Jones Transportation Average climbed 11% in November, it’s single largest monthly gain since October 2011. As a leading indicator of economic growth, strong gains in the index are often a good sign for the U.S. economy. (Sources: S&P, Dow Jones, Bloomberg)

U.S. Has Among Highest Corporate Tax Rates – Fiscal Policy Review

One of Trump’s fiscal proposals is to reduce the inherently high U.S. corporate tax rate from 35% to 15%. The United States currently has one of the highest corporate tax rates of any country worldwide at 35%. The average corporate rate globally is just over 23%.

Corp Inc Tax Rates-Basic Charts

Some countries maintain low tax rates or no corporate tax at all, such as Cayman Islands and Bermuda, in order to encourage companies to invest and hire within their countries. If U.S. corporate tax rates drop, it might discourage U.S. companies from seeking tax havens overseas, such as tax inversions. Inversions occur when a U.S. company buys or merges with a foreign domiciled company in order to adopt a lower tax rate. A report released by the OECD is concerned that some European countries are being used as tax havens, but with little or no benefits achieved by the underlying workforce or economy. (Source: OECD)


Only 55% Of Eligible Voters Voted In The Election

Rates Heading Higher – Fixed Income Update

Bond markets reversed their long-term trend of descending yields as economic growth expectations and inflationary pressures mounted. The anticipation of lower taxes sent demand for municipal bonds down. A primary reason for buying munis is the tax benefit of municipal interest, thus resulting in a drop in muni prices in November. High-yield corporate bonds enjoyed a generous run up in November as optimism regarding economic growth and jobs tend to benefit high-yield bonds. High-yield bonds are issued by companies that are considered less credit worthy and more at risk for default. The same companies who issue these bonds tend to prosper in a growth environment, thus generating greater profitability and increasing the likelihood of paying their bond obligations.

The 10-year U.S. Treasury yield ended November at 2.37%, up from 1.87% before the election and 1.37% in July after Britain’s vote to exit the EU. Even as U.S. Treasuries have fallen in price during this yield increase, they are notably the highest yielding government bonds among developed countries. Such a disparity may attract new buyers in search of yield resulting in higher prices and yield constraint. The forces affecting the U.S. bond markets are global, as U.S. debt from various sectors look attractive yield wise as well as conservative relative to higher yielding emerging market debt. (Sources: Bloomberg, U.S. Treasury Dept.)

OPEC Caves In & Cuts Oil Production – Oil Industry Update

OPEC agreed to cut production among its 13 members by 1.2 million barrels a day from the current 33.6 million barrels. The agreed upon reduction would reduce global output by about 1%, easing high levels of supplies. Domestically, the U.S. Energy Administration reported that U.S. stockpiles of oil shrank by 884,000 barrels in the final week of November. The price of WTI, the benchmark for domestic crude oil, ended November at $49.17 per barrel.

Since supply and demand are the primary determinants in setting oil prices, OPEC’s production cuts along with less supply in the U.S. are expected to shore up the price of oil. In addition, the anticipated growth generated from any economic expansion in the U.S. and abroad may increase demand for the commodity, adding pricing pressure as well. The crude oil benchmark WTI was up over 50% at the end of November from January 2016.

Crude Oil Prices (Jan-Nov 2016)-2-Axis Chart

Saudi Arabia, OPEC’s largest oil producer, launched an aggressive campaign against U.S. oil drillers two years ago by continuing to produce oil at record levels in order to maintain and build upon its market share. Saudi Arabia’s relentless approach to put U.S. shale drillers out of business is an indication of how serious a threat U.S. oil production has become to OPEC and its members. The U.S. shale industry, known for its fracking technology to extract oil from shale rock formations, has continued to surprise the world oil markets with its resistance to low prices. U.S. drillers have thus far been able to beat Saudi Arabia’s “pump and dump” strategy of lower oil prices in order to maintain market share. (Sources: EIA, OPEC)

 
Crude Oil (WTI) Is Up Over 50% So Far In 2016

Election Voter Turnout Lowest In 20 Years – Domestic Demographics

Even though election results were still being tabulated at the end of November, the 2016 election has so far had the lowest voter turnout since the 1996 election. The 126 million votes counted means that about 55% of voting age citizens cast ballots for the 2016 election, compared to the 2008 election when nearly 64% of eligible voters cast ballots.

Voter turnout is determined by the number of eligible voters who cast a ballot during an election. Some voters are individuals while others are members of larger families, thus creating social economic dynamics. Social economic factors significantly affect whether or not individuals and family members develop a discipline of voting in future elections. It is suggested that the most important social economic factor affecting voter turnout is education. That is, the more educated an individual is, the higher the probability that he or she will vote during any given election. Hence, it’s no surprise that all political parties strongly support a strong educational base in this country. (Sources: U.S. Census Bureau, Bipartisan Policy Center, electionproject.org)

Voter Turnout 2016-Basic Charts

 
The Cost of Sleep Deprivation - Nighty night!

The Cost of Sleep Deprivation (by Bob Veres)

Are you getting enough sleep?  If not, you might be costing your employer significant productivity, which the Rand Europe think tank has now translated into aggregate dollars across the global economy.sleep-deprivation-cropped

The researchers say that the U.S. and Japan are by far the economies losing the most through sleep deprivation.  Some 1.2 million working days are lost in the U.S. each year, with costs amounting to an astonishing 2.28% of America’s GDP ($411 billion); see chart.  Japan is number two on the narcolepsy scale, losing an estimated 600,000 working days and $138 billion worth of lost productivity.  Germany, the U.K. and Canada are, by comparison, getting more and better sleep.

Source:http://www.forbes.com/sites/niallmccarthy/2016/12/01/report-sleep-deprivation-costs-the-u-s-economy-400-billion-every-year-infographic/#42ae8a682e3d

Black Money in India (by Bob Veres)

Surely one of the most curious–and potentially costly–monetary experiments is taking place right now in India, where Prime Minister Narendra Modi abruptly decided—without warning—that the 500- and 1,000-rupee notes in circulation were no longer valid currency, effectively turning 86% of his country’s paper currency into colorful scratch pads.  The Reserve Bank of India is printing new replacement bills to restock its banking system, but reports say it will take five or six months before the money removed from circulation can be replaced—in a country where cash represents 98% of all transactions by volume, and 68% by value.  Sales across the country have fallen by 20-30%, reducing estimates of India’s GDP growth this year.

The goal was to flush out vast hoards of undeclared wealth that had either escaped taxation or was acquired through illicit means—called “black money” in Indian economic circles.  Yet estimates show that about two thirds of the dark funds managed to escape the “demonetisation,” by finding their its way into “white” channels.  A more permanent solution is a proposed switch to electronic payments for most transactions.

Source: http://www.economist.com/news/asia/21711094-without-cash-indians-are-struggling-modis-attempt-crush-black-economy-hurting-poor?fsrc=scn/tw/te/bl/ed/modisattempttocrushtheblackeconomyishurtingthepoor

 
The Employed and the Drop-Outs

The Employed and the Drop-Outs (by Bob Veres)

Headlines told us that the U.S. economy added 178,000 jobs in November, dropping the unemployment rate to 4.6%—the lowest level since August 2007, and surely an improvement over the 10% rates of the Great Recession.  Those numbers represent great news, and indicate that the country is in strong shape as President-elect Trump takes office. 

However, a degree of caution is in order as we look closer at the numbers.  For one thing, average hourly earnings for all American workers declined by three cents, to $25.89, after large gains in October.  Overall, average hourly earnings are up 2.5% this year, which is lower than you might expect if there was tight competition for workers.

Beyond that, part of the drop in unemployment was the result of new jobs, but a larger part was the fact that 226,000 people dropped out of the labor force in November, following a similar decline of 195,000 in October.  The total labor force was 157.03 million in the U.S. in January 2015, and has risen somewhat sluggishly to 159.49 million in November 2016—despite 4.8 million new worker-age Americans coming into the economy.  The bottom line: people are dropping out faster than they’re being hired—for some reason.

This is not intended to be discouraging news.  The U.S. economy is clearly in much better shape today than it was five or eight years ago, and most people can find work if they want to.  Among those who will be looking hard at the numbers behind the numbers are Fed chairperson Janet Yellen and her team of economists, who will want to know when—or if—the unemployment rate has dropped so low that there is real competition for labor, driving significant increases in wages, driving inflation up high enough that it will be necessary to raise interest rates.  That will be a topic of debate at the next Fed meeting December 13-14.

Sources:

http://www.newsmax.com/Finance/StreetTalk/nonfarm-payrolls-jobs-unemployment-media/2016/12/02/id/761870/

https://www.washingtonpost.com/news/wonk/wp/2016/12/02/u-s-economy-added-178000-jobs-in-november-unemployment-rate-drops-to-4-6-percent/?utm_term=.519490446fee


Employment by Category

Employment by Category (by Bob Veres)

We look at the unemployment statistics in the newspaper and see a blended picture of all Americans.  Currently, we are told, 4.6% of Americans who are looking for a job are unable to find one.  But what is the figure for adult men and women over age 20?  Or for people with a high school diploma vs. those who are college-educated?unemployment-cropped

The Labor Department Report that the newspapers are reporting on actually breaks down these figures in some detail, as you can see in the accompanying chart.  Notice that much of the actual joblessness is found in the teenage population, age 16-19 years, where unemployment runs at 15.2% overall.  Also note that white Americans have a rate below the national average (4.2%), while African-Americans are unemployed at higher rates (8.1%).

Look lower on the chart and you see that people 25 years and older, overall, have an unemployment rate of just 3.9%—a figure you probably won’t see anywhere in the headlines.  Break that down by education, and you see the value of a diploma or degree, as the rate is three times higher for people who never graduated from high school (7.9%) than people who graduated from college (2.3%).  

Source: http://finance.yahoo.com/news/us-payrolls-report-november-2016-130614643.html

 
World Class Inequality

World-Class Inequality (by Bob Veres)

One of the persistent issues of the 2016 U.S. Presidential campaign was the wide (and growing) divide between the “haves” and the “have-nots”—variously expressed as a rising sentiment against the “one-percenters,” or as laments against the “hollowing out of the middle class.”


oecd2016-income-inequality-update-1
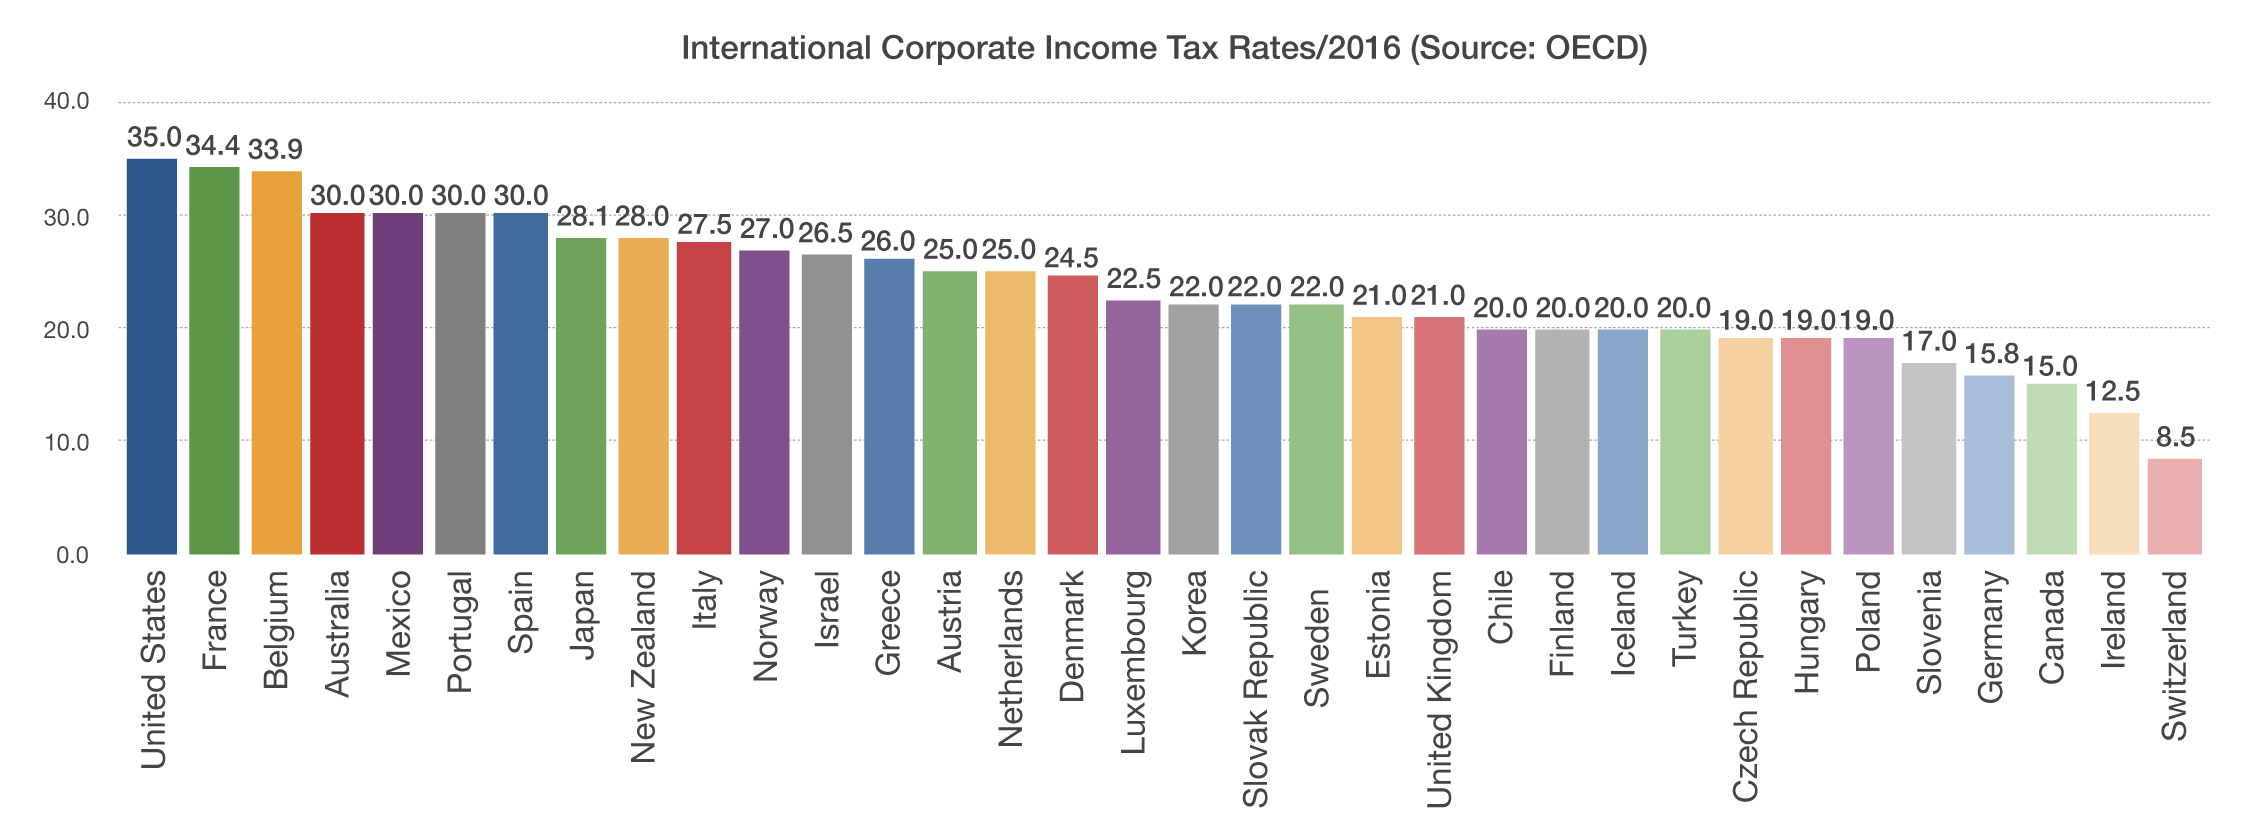
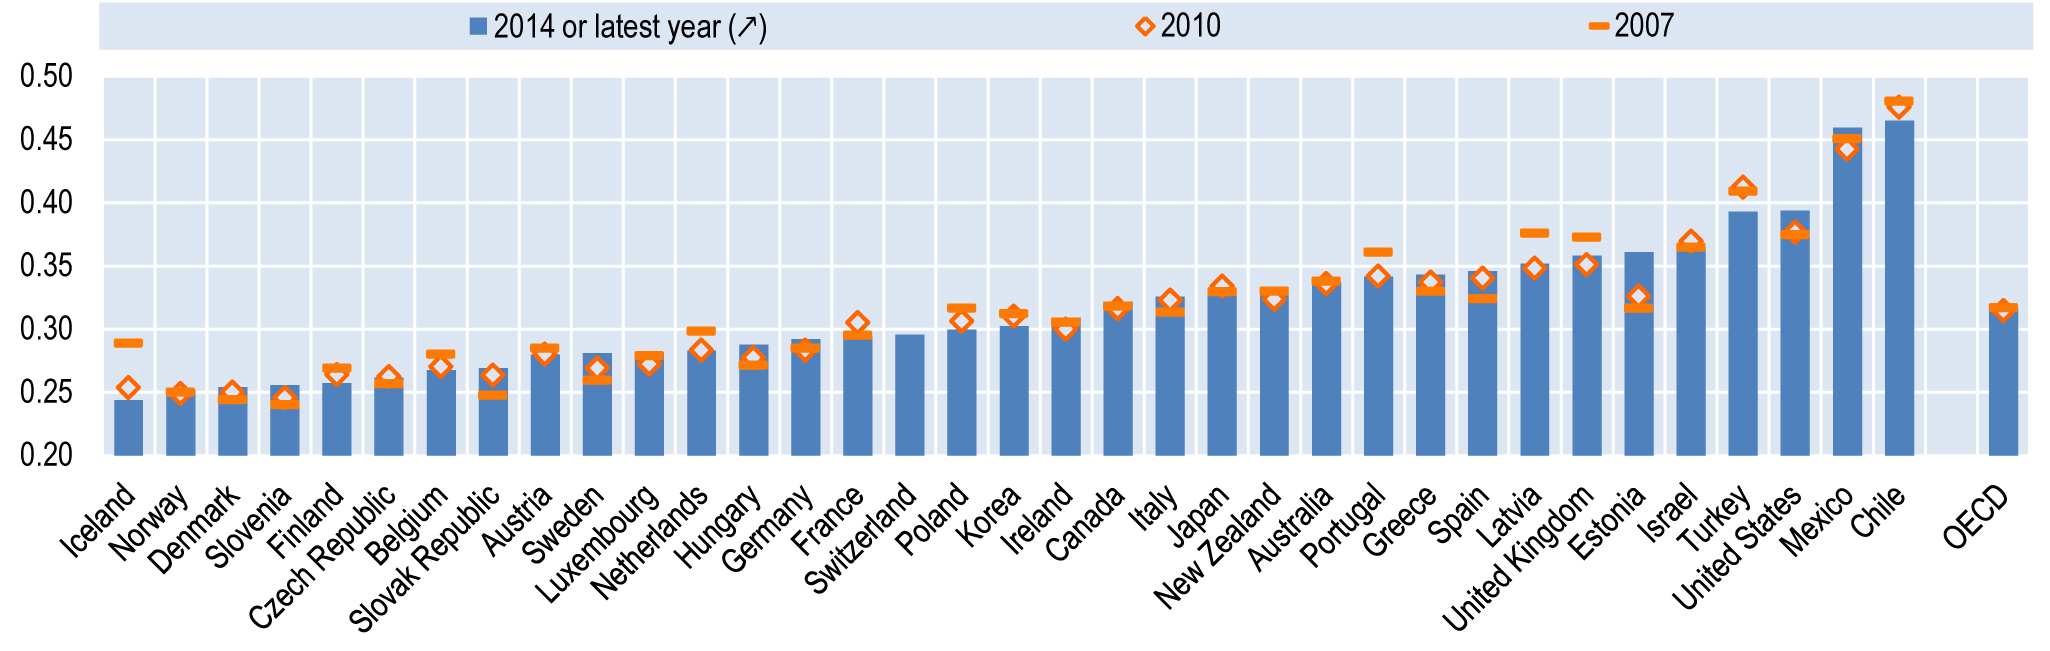
Is the U.S. any more unequal than other countries? A report from the Organization for Economic Co-operation and Development (OECD) suggests that it is. Looking at all developed nations, OECD researchers found that the average “score” of inequality, from 0-1, was right around 0.318 (see graphic), with higher scores indicating a bigger gap between the wealthiest citizens and the average working person. (A “0” score would indicate that everybody enjoys exactly the same income, while a “1” score would mean that one person took home all the income.) America, home to Wall Street and its multi-million-dollar bonuses, came in with the third-highest income inequality, behind only Chile and Mexico, and far more unequal than the world’s most egalitarian societies in Scandinavia: Iceland, Norway, Denmark and Finland. (Turkey came in at a virtual tie with the U.S.)

What does that mean? Traditionally, societies with greater inequality tend to be less socially stable, to the point where international economists monitor the discrepancy between rich and average citizens to determine which nations are in danger of experiencing a revolution among the masses. Consider the most recent election a form of revolution, which may have failed, considering the number of Wall Streeters and wealthy corporate titans who are already preparing to take office in President-Elect Trump’s Washington cabinet. Source: OECD

jacorn-coffee-croppedWhat will you do in 2017 to improve your financial health? Do you know your “retirement number” – that magic portfolio amount that will allow you to live a lifetime of independence, free of financial worry? Is your investing plan on track to achieve your number? How will you convert that retirement portfolio to a stream of income that considers inflation, market volatility, and the prospects for long life? Do you feel like Uncle Sam wants too much of the money he didn’t earn? If these and other financial questions are distracting you from the joy of the season, make a resolution. Call Wayne Firebaugh and set a time to share a cup of coffee (or in Wayne’s case a glass of iced tea) and discuss some answers.