December 2016
Market Update
(all values as of 04.28.2023)

Stock Indices:

Dow Jones 34,098
S&P 500 4,169
Nasdaq 12,226

Bond Sector Yields:

2 Yr Treasury 4.04%
10 Yr Treasury 3.44%
10 Yr Municipal 2.36%
High Yield 8.19%

YTD Market Returns:

Dow Jones 2.87%
S&P 500 8.59%
Nasdaq 16.82%
MSCI-EAFE 10.28%
MSCI-Europe 13.87%
MSCI-Pacific 3.86%
MSCI-Emg Mkt 2.16%
 
US Agg Bond 3.59%
US Corp Bond 4.29%
US Gov’t Bond 3.82%

Commodity Prices:

Gold 1,999
Silver 25.33
Oil (WTI) 76.63

Currencies:

Dollar / Euro 1.10
Dollar / Pound 1.24
Yen / Dollar 133.79
Canadian /Dollar 0.73
 

Macro Overview

A monumental shift occurred in November as consumer sentiment, interest rates, and equity markets all increased with growth expectations settling in. Infrastructure spending, manufacturing, a friendlier regulatory environment, trade agreements, and fiscal stimulus have become the primary objectives of the president-elect.

A shift towards fiscal stimulus, as proposed by the incoming administration, is expected to help ease the burden on the Federal Reserve. Fiscal stimulus creates higher wages and spending by means of lower taxes, eventually leading to inflationary pressures, which is one of the Fed’s objectives.

Equity markets rallied in November with the Dow Jones Industrial Index breaching the 19,000 level, a record high for the index. The Dow Jones Transportation Average climbed 11% for the month, it’s single largest monthly gain since October 2011. As a leading indicator of economic growth, strong gains in the transportation index are often indicative of improving economic conditions.Pres Elec Day S&P % Chng-Basic Charts

A byproduct of rising rates in November, stemming from optimistic economic growth forecasts, led to a considerably stronger U.S. dollar. The challenge for the new administration will be harnessing the dollar’s strength for U.S. imports, yet finding ways to make U.S. products affordable in the world marketplace.

OPEC agreed to cut oil production among its 13 members by 1.2 million barrels a day from the current 33.6 million barrels. The agreed upon reduction would reduce global output by about 1%, while easing high levels of supplies and stabilizing prices.

November saw an accelerating shift in assets from globalization related positions towards domestic related positions. The inflationary effects of economic growth have now replaced the deflationary concerns that lingered since the financial crisis of 2008. Markets are closely watching Trump’s cabinet appointments since several of the appointments are instrumental in orchestrating the direction of various industries, taxes, regulations, and economic growth. The economic climate is different now than it was during prior Republican administrations. When Reagan came into office in 1980, inflation was at 14% and the dollar was at a generational low. Heading into the inauguration, inflation is below 2% and the dollar is at a 13-year high, making dramatic economic improvements difficult to achieve.  (Sources: Fed, OPEC, Reuters, BLS)

 
Stock Indices Reach New Highs

Stock Indices Reach New Highs – Domestic Equity Overview

Many analysts believe that the stock market rally following Trump’s election reflects the expectations of a new era of fiscal stimulus. Both economists and analysts agree that the Fed has basically exhausted all of its stimulus efforts by means of using traditional and newly devised monetary policy tools that are now considered ineffective.

Small caps outperformed large caps following the election, primarily driven by the growth factors expected to benefit small cap stocks. Proposed corporate tax rate cuts also favor small caps, which benefit more than large caps from tax rate reductions. Proposed deregulation is good for small caps as large caps can handle higher costs of regulation easier than small caps, leaving small caps to benefit the most under deregulation.

Protectionism is expected to benefit small company stocks which typically generate less than 20% of their sales overseas while larger company stocks generate well over 30% from overseas sales. A reduction in the corporate tax rate to 15% would be much more beneficial for small company stocks, which generally don’t have the resources to bring tax rates below 35%.

The Dow Jones Industrial Average reached 19,000 in November, a milestone level for the index, which was at 1000 in November 1972. The Dow Jones Industrial Average rose 5.4% in November, while the S&P 500 Index increased by 3.4% and the Nasdaq Composite added 2.6% for the month. The Dow Jones Transportation Average climbed 11% in November, it’s single largest monthly gain since October 2011. As a leading indicator of economic growth, strong gains in the index are often a good sign for the U.S. economy. (Sources: S&P, Dow Jones, Bloomberg)

What Imports Into The U.S. – Consumer Behavior

Top 10 Imports to U.S.-Basic Charts
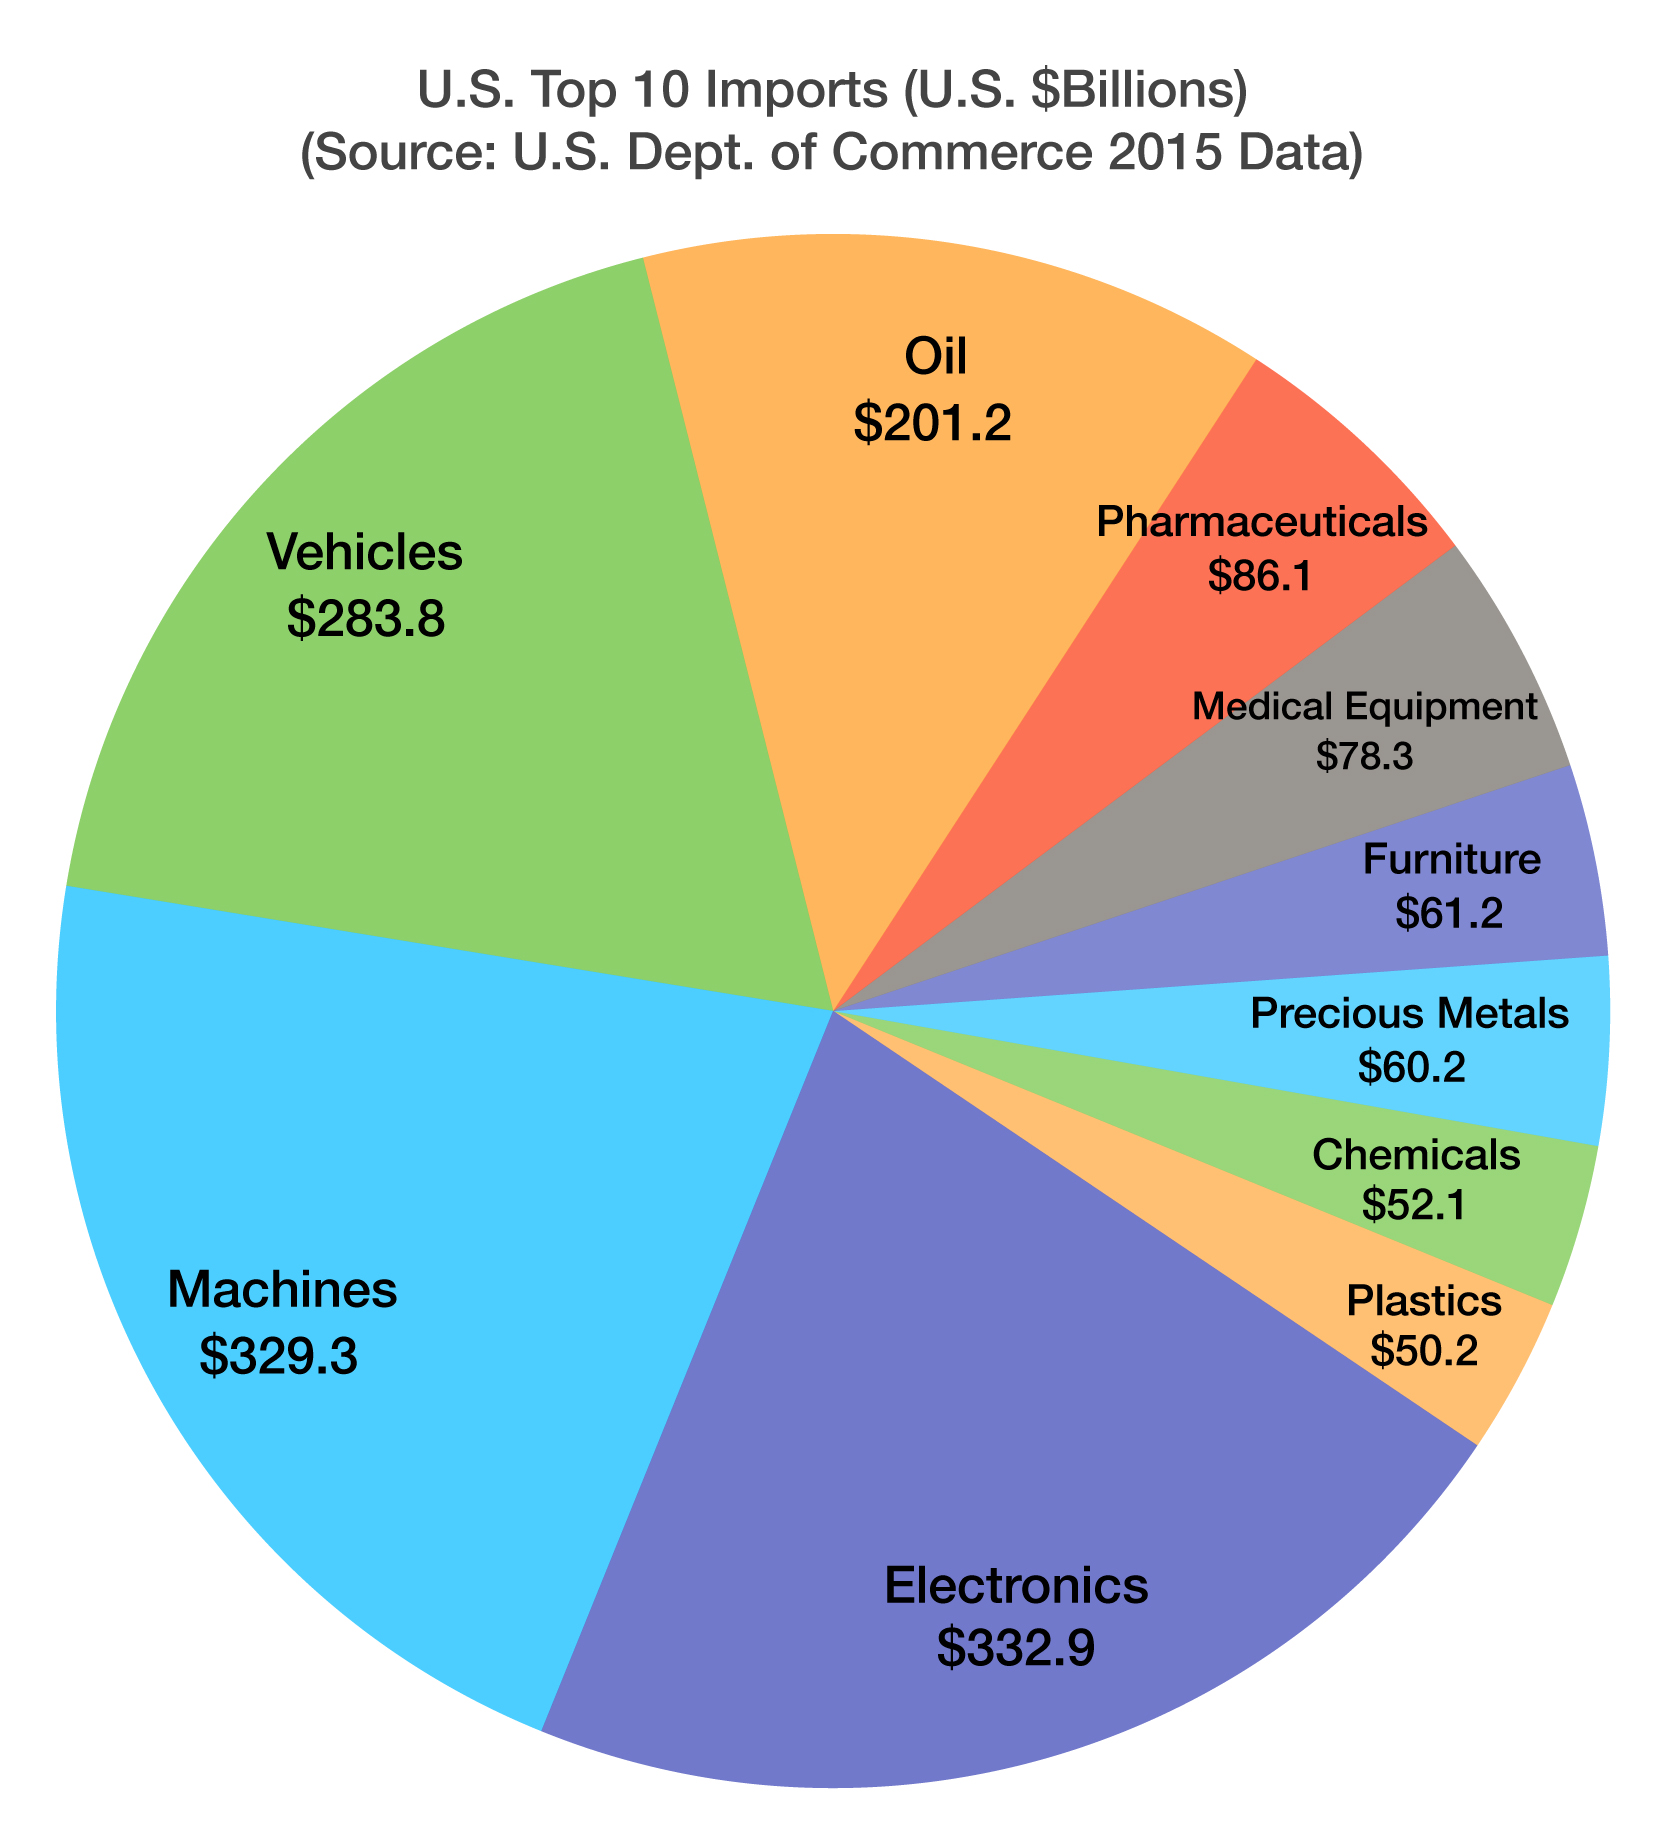
As the president-elect prepares to enter the White House, foreign imports into the U.S. have become a leading agenda item. According to the Commerce Department, the top imports into the U.S. include electronic devices such as mobile phones, computers and TVs, followed by machinery and automobiles. The onset of additional tariffs and import duties might change the makeup of imports dramatically, as consumers tackle higher prices along with some manufacturing possibly shifting to the U.S.

The biggest question everyone has is how will higher tariffs affect U.S. consumers and the economy. The most dominant imports currently tend to be high margin products such as mobile phones, laptops, and computers. Any additional tariffs might either be partially absorbed by the exporters or passed along to consumers in the form of higher prices. What’s interesting is that the onset of cheap Chinese made products have actually altered consumer behavior in the U.S. over the past twenty years. Before inexpensive TVs made their way into electronic superstores, a typical TV would last years. Today, TVs are considered disposable and easily replaced.

Should import prices rise, consumers might reconsider replacing products regularly, and instead maintain existing products for longer periods.  (Source: Dept. of Commerce)

 
Rates Heading Higher

Rates Heading Higher – Fixed Income Update

Bond markets reversed their long-term trend of descending yields as economic growth expectations and inflationary pressures mounted. The anticipation of lower taxes sent demand for municipal bonds down. A primary reason for buying munis is the tax benefit of municipal interest, thus resulting in a drop in muni prices in November. High-yield corporate bonds enjoyed a generous run up in November as optimism regarding economic growth and jobs tend to benefit high-yield bonds. High-yield bonds are issued by companies that are considered less credit worthy and more at risk for default. The same companies who issue these bonds tend to prosper in a growth environment, thus generating greater profitability and increasing the likelihood of paying their bond obligations.

The 10-year U.S. Treasury yield ended November at 2.37%, up from 1.87% before the election and 1.37% in July after Britain’s vote to exit the EU. Even as U.S. Treasuries have fallen in price during this yield increase, they are notably the highest yielding government bonds among developed countries. Such a disparity may attract new buyers in search of yield resulting in higher prices and yield constraint. The forces affecting the U.S. bond markets are global, as U.S. debt from various sectors look attractive yield wise as well as conservative relative to higher yielding emerging market debt. (Sources: Bloomberg, U.S. Treasury Dept.)

OPEC Caves In & Cuts Oil Production – Oil Industry Update

OPEC agreed to cut production among its 13 members by 1.2 million barrels a day from the current 33.6 million barrels. The agreed upon reduction would reduce global output by about 1%, easing high levels of supplies. Domestically, the U.S. Energy Administration reported that U.S. stockpiles of oil shrank by 884,000 barrels in the final week of November. The price of WTI, the benchmark for domestic crude oil, ended November at $49.17 per barrel.

Since supply and demand are the primary determinants in setting oil prices, OPEC’s production cuts along with less supply in the U.S. are expected to shore up the price of oil. In addition, the anticipated growth generated from any economic expansion in the U.S. and abroad may increase demand for the commodity, adding pricing pressure as well. The crude oil benchmark WTI was up over 50% at the end of November from January 2016. Crude Oil Prices (Jan-Nov 2016)-2-Axis Chart
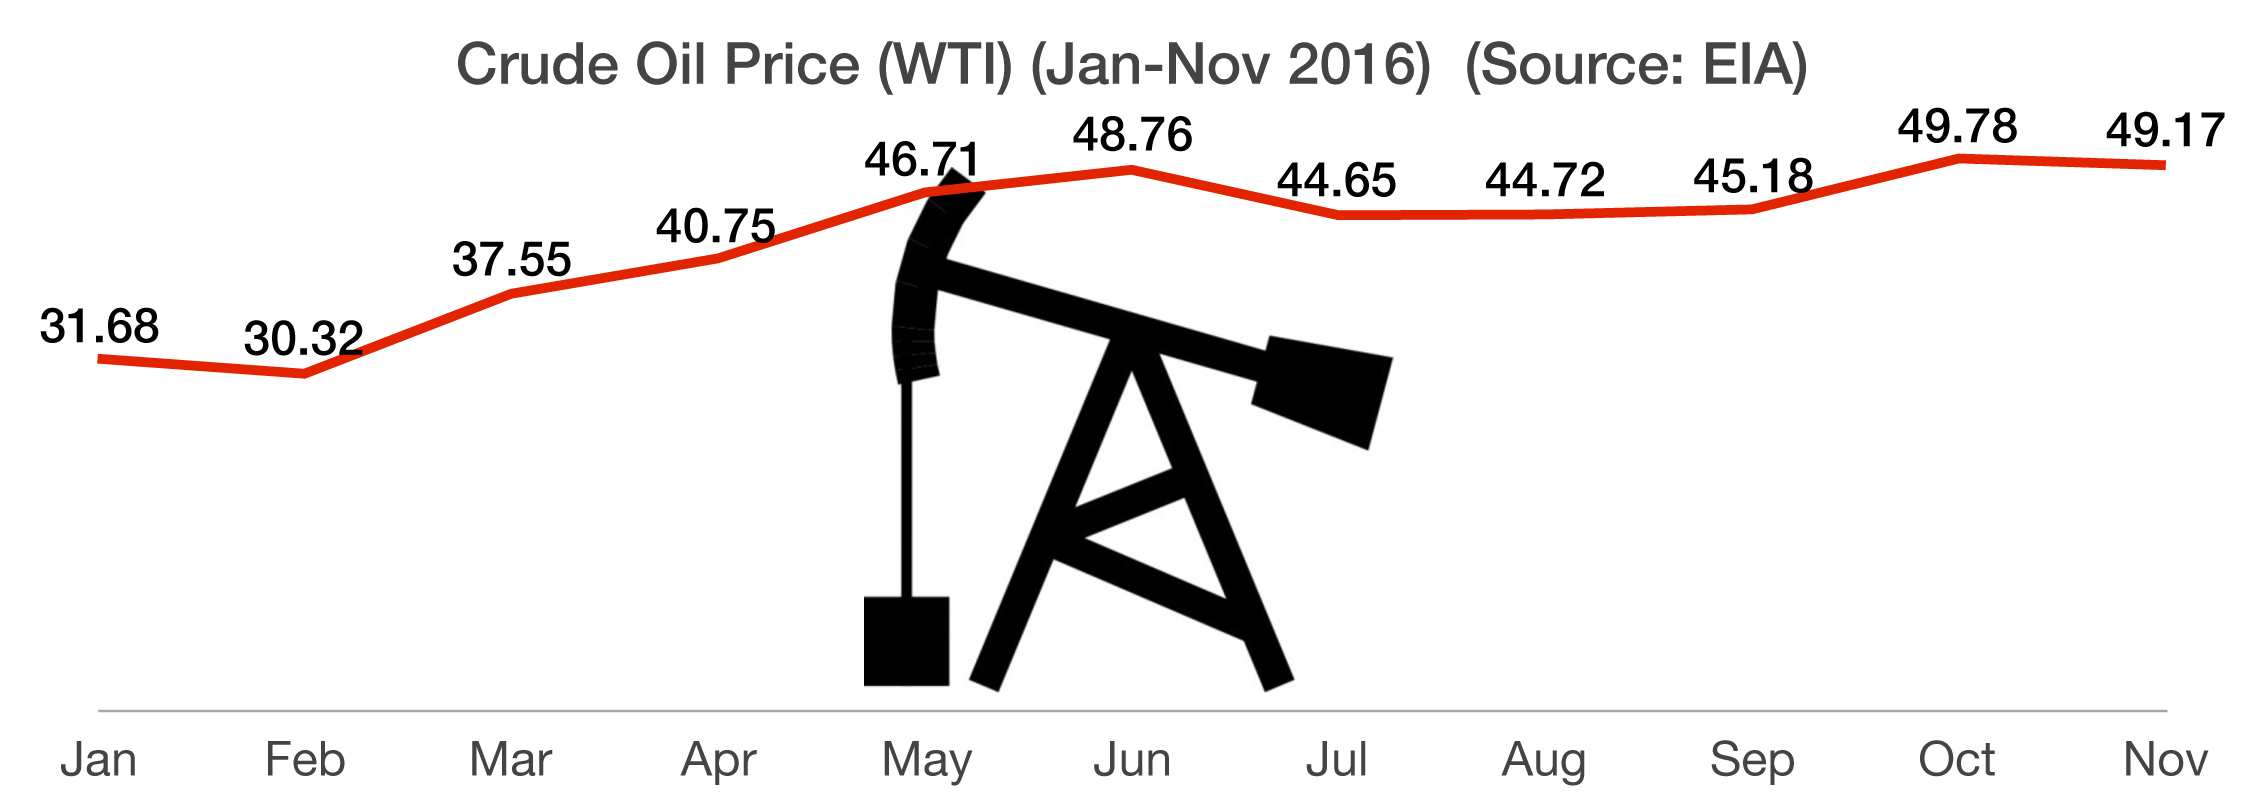
Saudi Arabia, OPEC’s largest oil producer, launched an aggressive campaign against U.S. oil drillers two years ago by continuing to produce oil at record levels in order to maintain and build upon its market share.

Saudi Arabia’s relentless approach to put U.S. shale drillers out of business is an indication of how serious a threat U.S. oil production has become to OPEC and its members. The U.S. shale industry, known for its fracking technology to extract oil from shale rock formations, has continued to surprise the world oil markets with its resistance to low prices. U.S. drillers have thus far been able to beat Saudi Arabia’s “pump and dump” strategy of lower oil prices in order to maintain market share. (Sources: EIA, Worldbank, OPEC)