Earl R. King Sr., CFP®

Managing Member

1300 Caraway Court, Suite 200

Largo, MD 20774

Tel: 301-364-1617/Cell: 240-472-6570

 eking@erogerfinancial.com / www.erogerfinancial.com


December 2019
Market Update
(all values as of 10.31.2024)

Stock Indices:

Dow Jones 41,763
S&P 500 5,705
Nasdaq 18,095

Bond Sector Yields:

2 Yr Treasury 4.16%
10 Yr Treasury 4.28%
10 Yr Municipal 3.03%
High Yield 7.06%

YTD Market Returns:

Dow Jones 10.81%
S&P 500 19.62%
Nasdaq 20.54%
MSCI-EAFE 7.30%
MSCI-Europe 6.40%
MSCI-Pacific 7.60%
MSCI-Emg Mkt 11.60%
 
US Agg Bond 1.86%
US Corp Bond 2.77%
US Gov’t Bond 1.90%

Commodity Prices:

Gold 2,755
Silver 32.81
Oil (WTI) 70.50

Currencies:

Dollar / Euro 1.08
Dollar / Pound 1.29
Yen / Dollar 153.21
Canadian /Dollar 0.71

Macro Overview

Markets have been undermined for weeks by the uncertainty of a phase-one trade deal outlined by U.S. and Chinese trade delegates. Optimism for a probable U.S.-China trade deal stemmed from the progression toward a phase-one deal that might include a rollback of certain tariffs by both the U.S. and China.

Global equity markets continued to elevate in November against a backdrop of political events and optimism surrounding ongoing trade negotiations. With the year end approaching, focus has shifted to the 2020 election, a phase-one trade deal, the Fed maintaining rates, and receding recession concerns.

A broad barometer of the current status of the country’s economic well being is the money supply, which essentially measures the level of cash in savings accounts, checking accounts, CDs, and money market funds. Money supply has grown over 10% during the past quarter, translating into plenty of excess liquidity for financial markets and providing a buffer against any unexpected volatility.

Fixed income analysts expect that the Fed is attempting to normalize interest rates by holding off on any further rate changes until economic data offers a clearer view of where the economy is headed. Analysts believe that subdued inflation exceptions by the Fed may leave rates steady heading into 2020.

There are less global bonds yielding negative rates, down to $11.9 trillion from a peak of $17 trillion in the summer. Lessening negative yields is indicative of a possibly stronger global economy, sparking a drive to equities to capture growth prospects. Some believe that the president’s objective of a weaker U.S. dollar would be beneficial for both international equities and exports of U.S. products around the world.

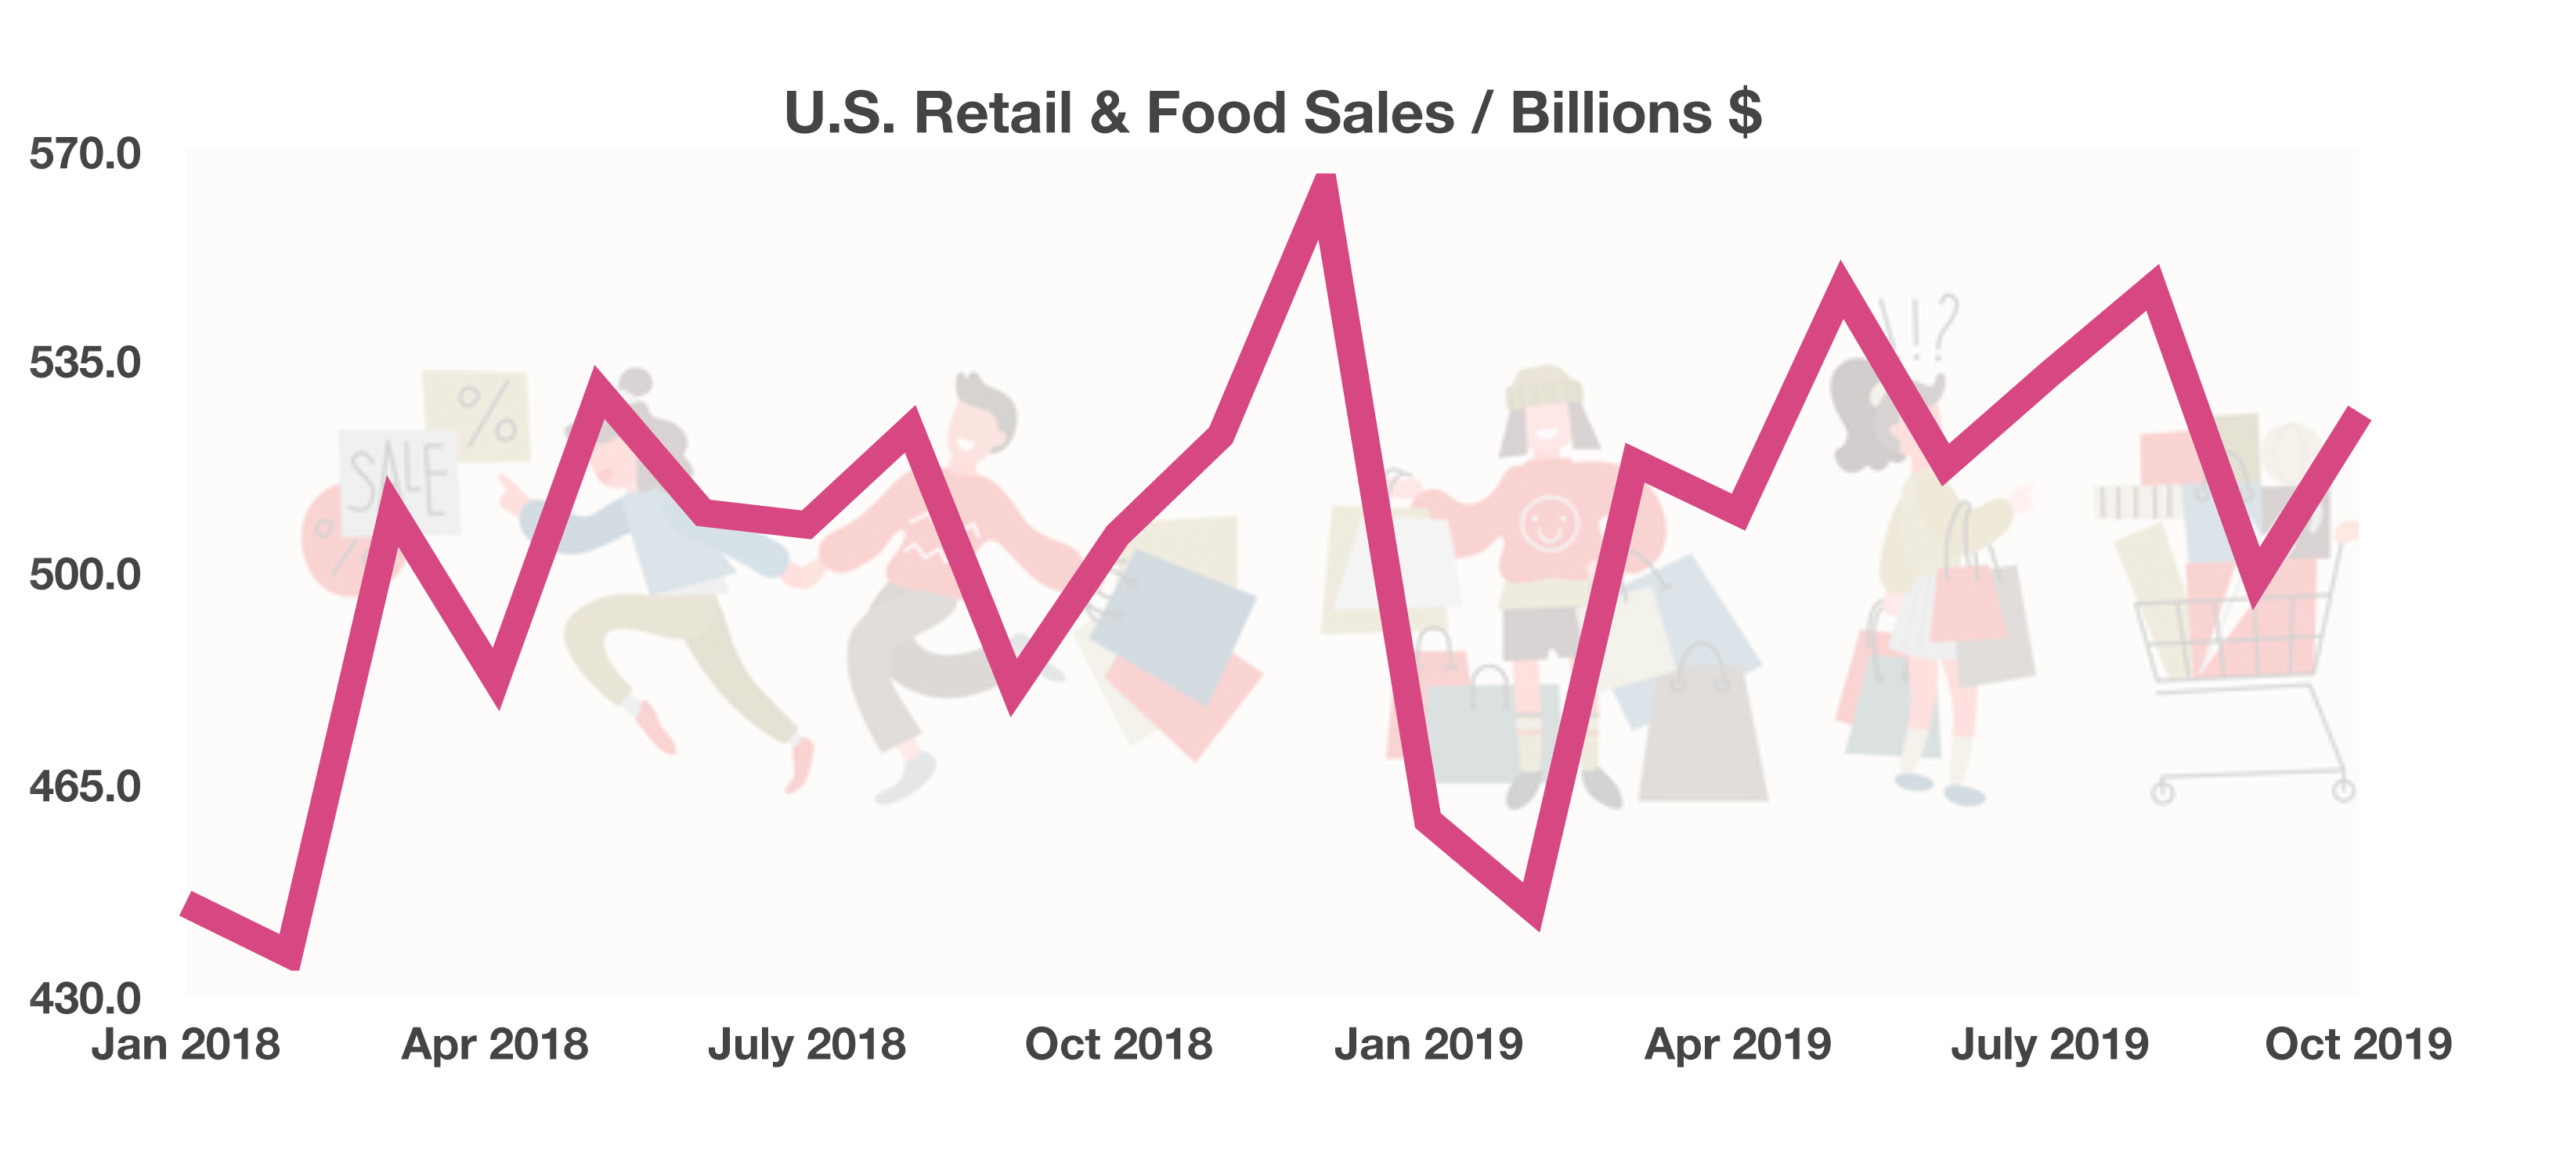
Consumers continue to spend at retail stores and on food heading into the holiday season, buoying economic activity throughout the country. Consumer expenditures represent over two-thirds of GDP, an integral part of the nation’s economy. A continued low-rate environment, along with a strong job market, has allowed consumers to spend generously on retail and food. (Sources: Commerce Dept., Bloomberg, Federal Reserve, BLS)


the fed is buying $60 billion of Treasury bills each month

Global Markets Elevate – Equity Review

Domestic equities finished November with gains not seen since the summer.

Optimism surrounding U.S.-China trade discussions helped fuel equities higher, with technology, health care, and financials as the leading sectors in November.

The absence of volatility, along with the Fed maintaining a steady rate environment, was also a catalyst for equities to climb in November. Stock market volatility, as measured by the VIX Index, dropped to its lowest levels since April.

U.S. equity markets have outperformed international equities over the past two years so far. Historically, a lower U.S. dollar has benefited international stocks, as well as help increase exports of U.S. products worldwide. (Sources: U.S. Commerce Department, Bloomberg)

Looks Like QE But It’s Not Says The Fed – Fixed Income Overview

The Federal Reserve is slowly re-expanding its balance sheet by currently buying $60 billion of Treasury bills each month. Reminiscent of the Fed’s Quantitative Easing (QE) program, meant to stimulate economic activity, the Fed denies that it is QE, but rather just a buffer for any possible bond market volatility.

Interest rates are believed to have stabilized for the time being, as the Fed has essentially placed a hold on raising and lowering rates until further notice. The yield on the 10-year treasury bond ended November at 1.78%, essentially where it’s been for the past two months.

The presidential race is promoting bond buyers to consider municipal bonds in order to hedge against any possible increase in tax rates. The tax free interest generated by municipal bonds has historically been a benefit for certain investors in the higher tax brackets. (Source: Federal Reserve)

Presidential Candidate Tax Proposals Influence Voter Turnout – Politics In Review

Taxes and income inequality have become a primary agenda topic for several presidential candidates. Various proposals from the candidates include repealing the Tax & Jobs Act, removing the step-up basis for inherited assets, increasing capital gains tax, imposing a financial transaction tax, and eliminating the tax deduction for mortgage interest on a second home.

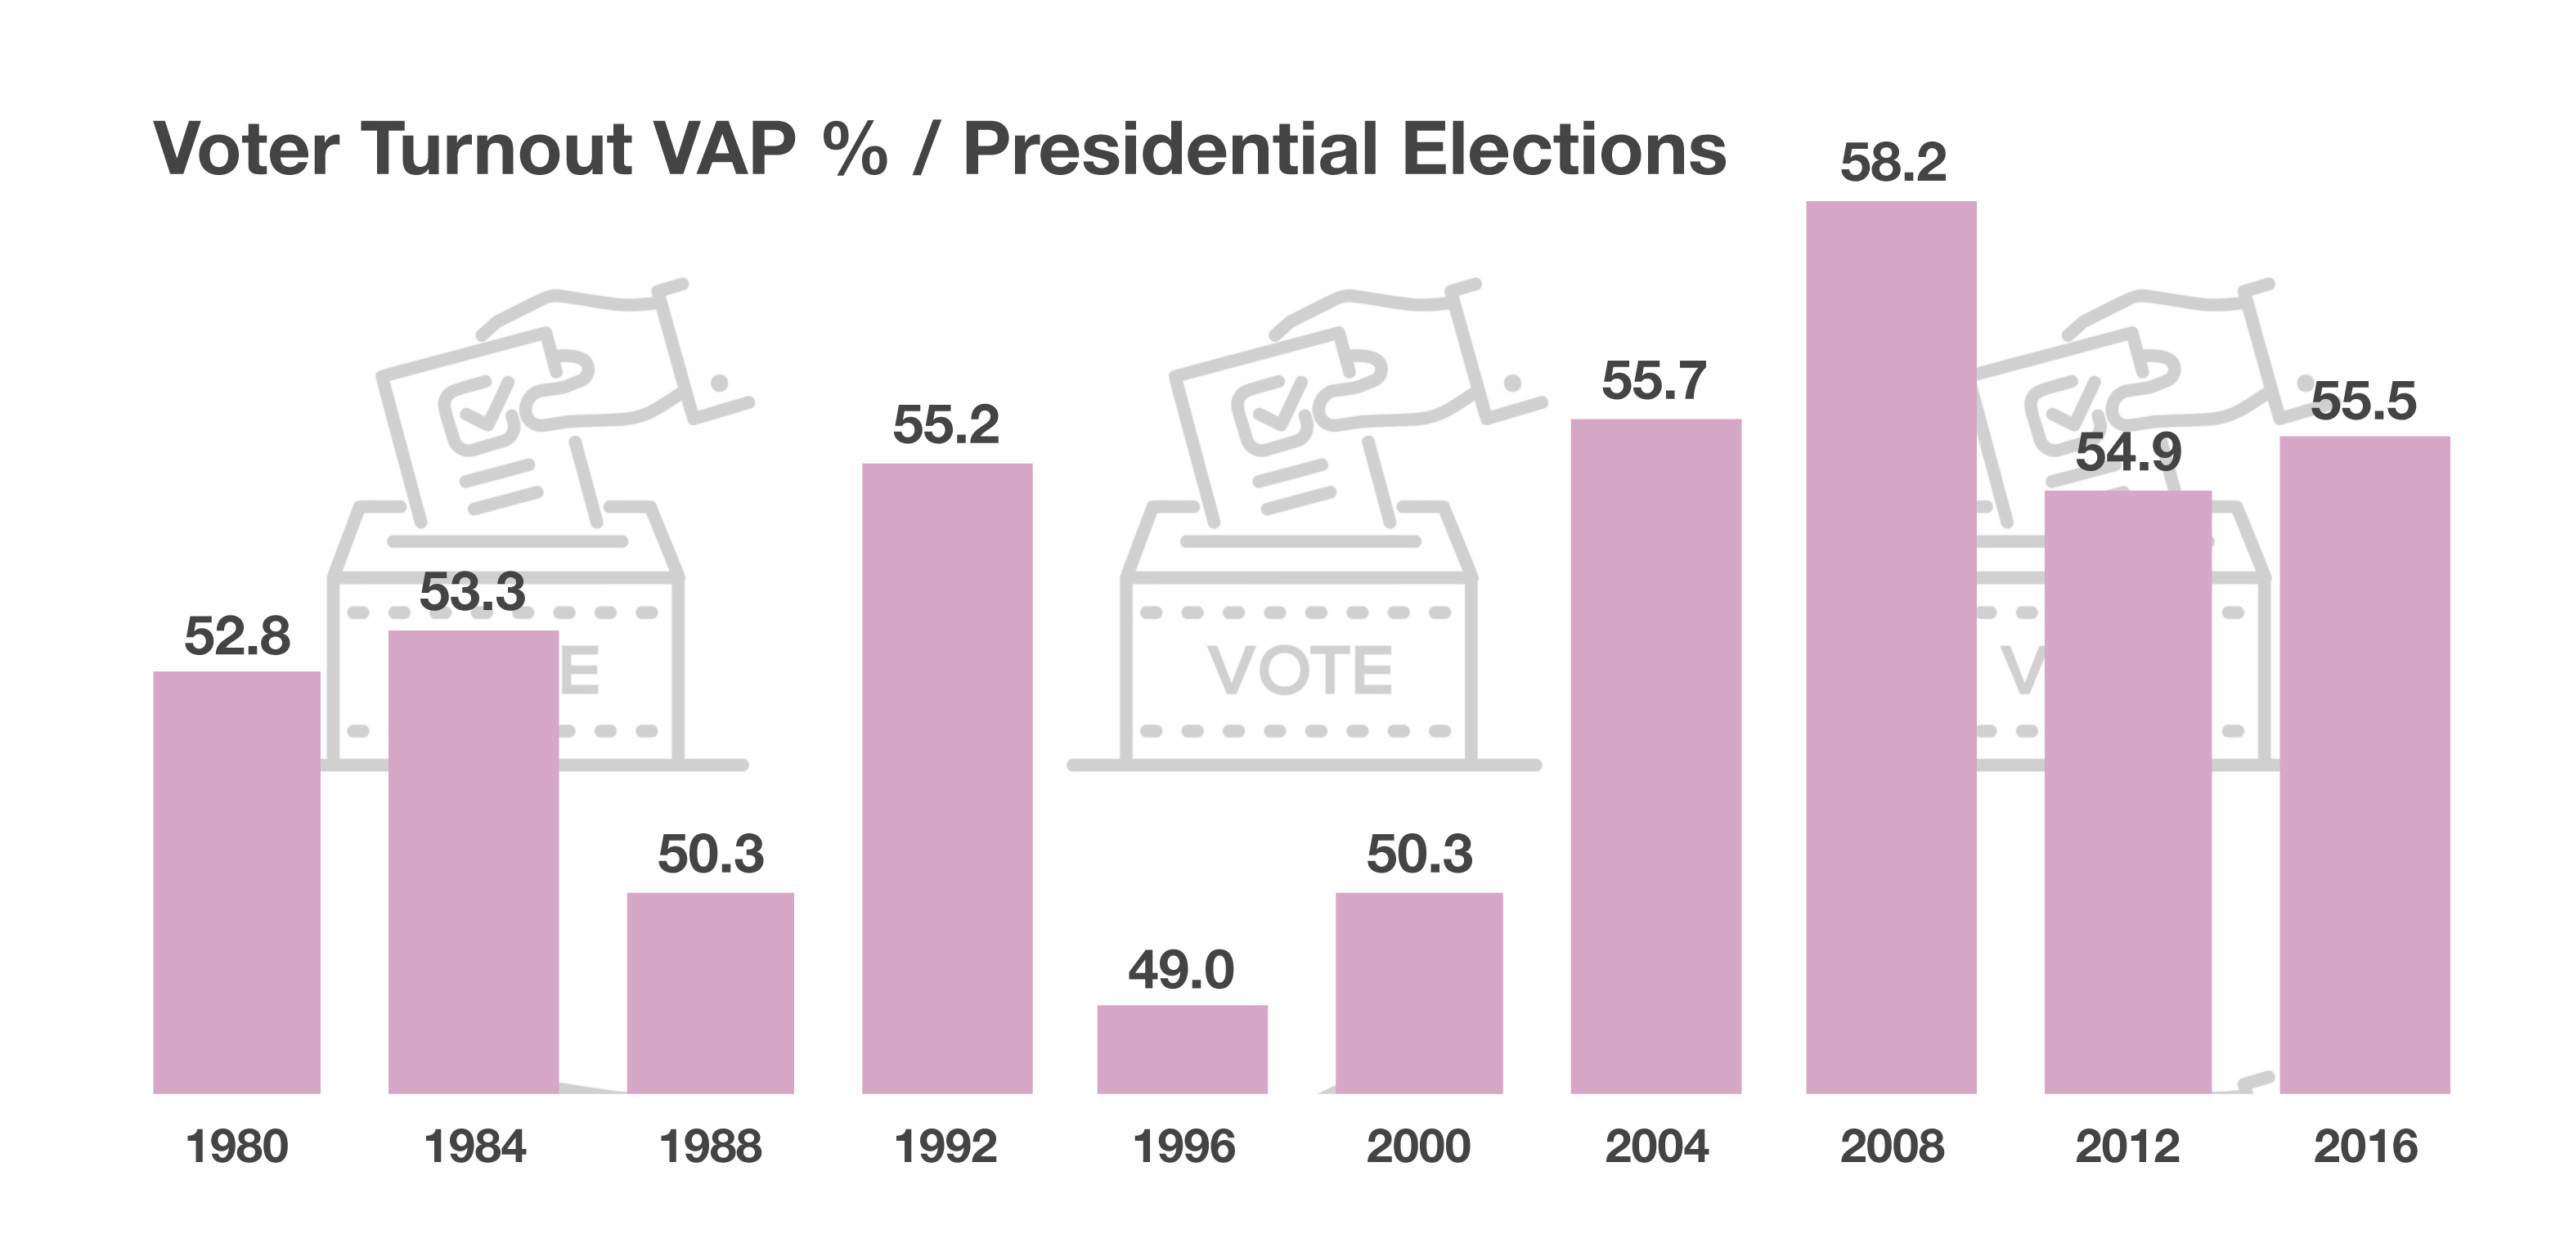
Presidential election voter turnout is tracked by the Bipartisan Policy Center, which monitors voter turnout state by state. The 2016 presidential election saw an estimated 55% of the voting age population (VAP) turn out to vote. Who actually turns out to vote can be driven by the candidates’ policies and how it may affect individuals. The number of voters has varied over the years and has always been very difficult to predict. (Source: Bipartisan Policy Center)
 
it took an income of $515,371 to be part of the top 1% of earners in 2017

Medigap Plan F Phasing Out – Medicare Benefits Update

Of the ten Medicare supplemental plans, known also as Medigap, the single most popular plan, Plan F, will be eliminated at the end of the year to new subscribers. 

Retirees who turn 65 after 2019 will no longer have Plan F as an option. Plan F is the most expensive supplemental option since there are no deductibles, no co-pays and no additional bills after a doctor’s visit. 

Plan G has become the next best comprehensive plan after Plan F is phased out to newcomers. Plan G is almost identical to Plan F with the exception of having to pay the Medicare deductible before insurance pays any benefits.

A Medigap policy supplements expenses not covered by Medicare including co-payments, co-insurance, and deductibles.  Medigap policies are sold by private insurance companies and vary in pricing and coverage from state to state. 

The following are important aspects regarding Medigap policies:

In order to have Medigap coverage, one must have Medicare Part A & Part B.

A Medigap policy only covers one person, not a married couple. So, each person needs their own separate policy.

Any standardized Medigap policy is guaranteed renewable even with a pre-existing condition.

Medigap does not cover prescription drugs. Medicare Part D does offer coverage for prescription drugs.

Medigap policies generally don’t cover long-term care, vision, dental care, hearing aids, eyeglasses, or private nursing. (Source: medicare.gov)

What It Takes To Be In the Top 1% Of Earners – Fiscal Policy

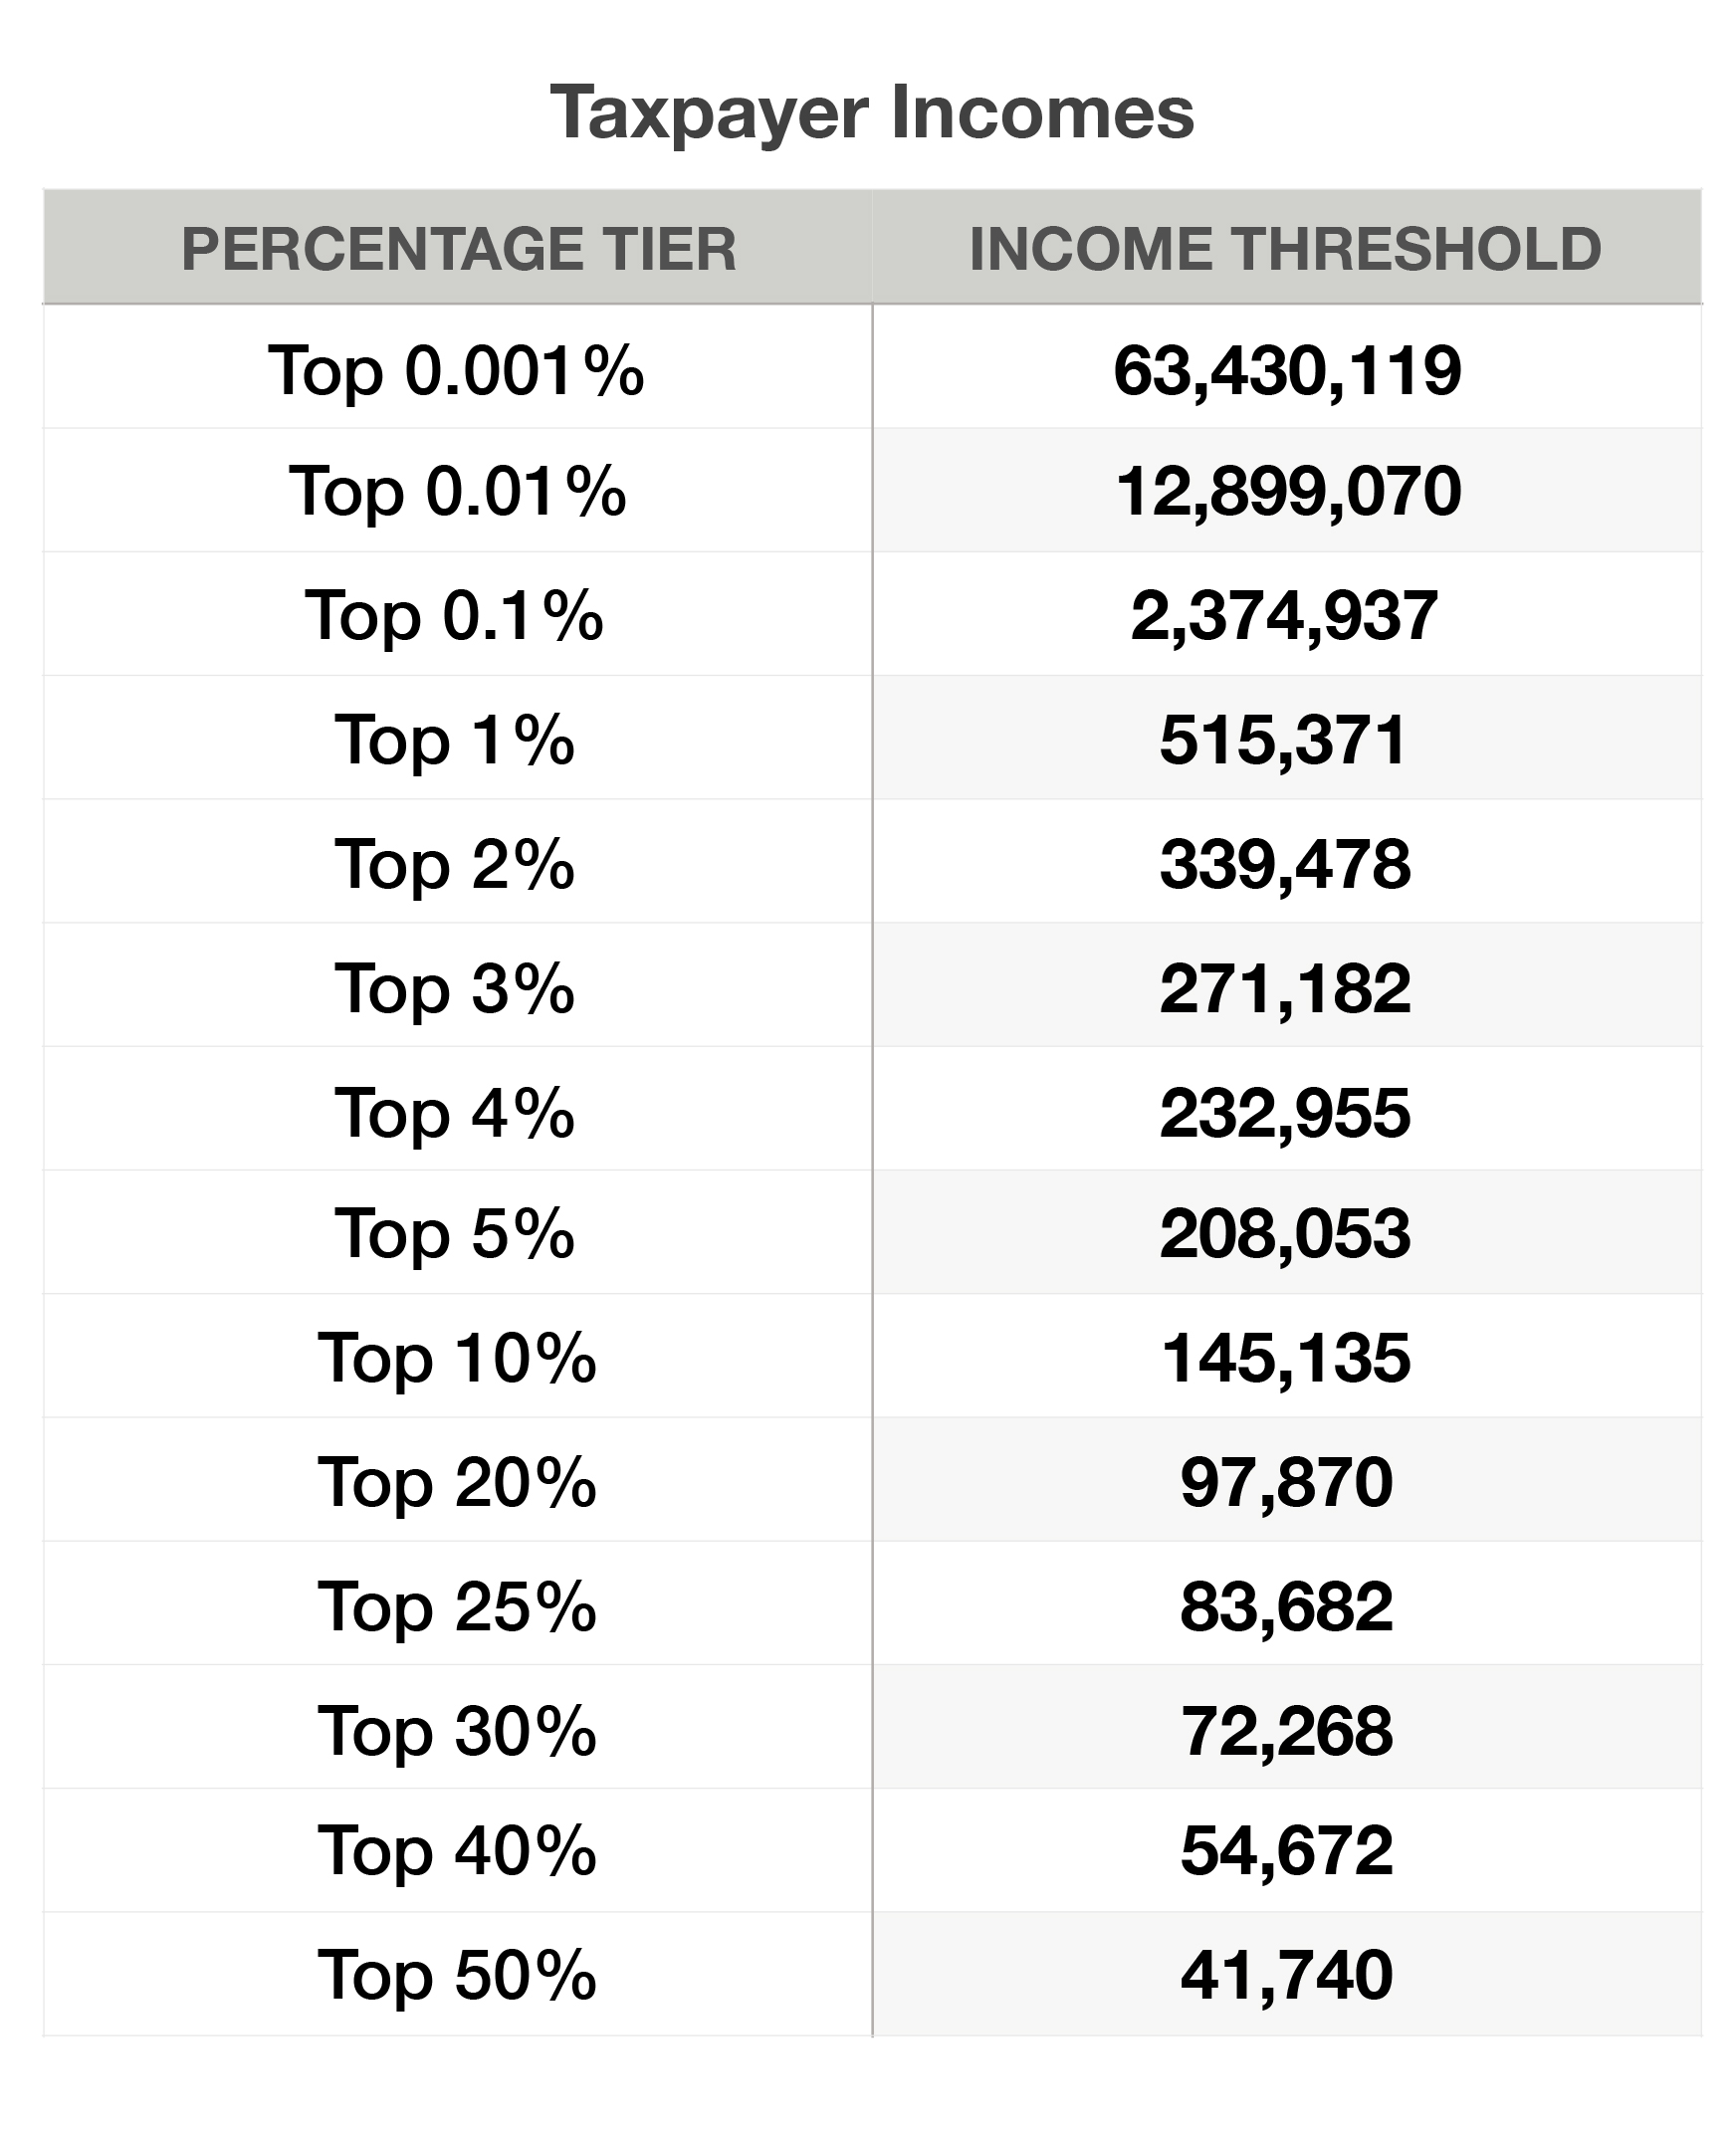
According to the most recent data released by the IRS, it took earnings of $515,371 to be part of the top 1% of earners in 2017. It took an additional 7.2% to crack the 1% mark from the prior year, equal to an additional $37,106 in income.

Of the 138,945,000 individual tax returns filed in 2017, 1,432,952 returns fell into the top 1% category. The top 50% tax earners were, on the other hand, more representative of taxpayers across the country, with an income threshold of $41,740. There were over 71 million taxpayers that fell into the top 50% in 2017.

(Source: IRS, www.irs.gov/statistics/soi)

 
u.s. agricultural exports to china grew 700% from 2000 to 2017. 

U.S. Agricultural Exports To China Decline – Trade Policy Review

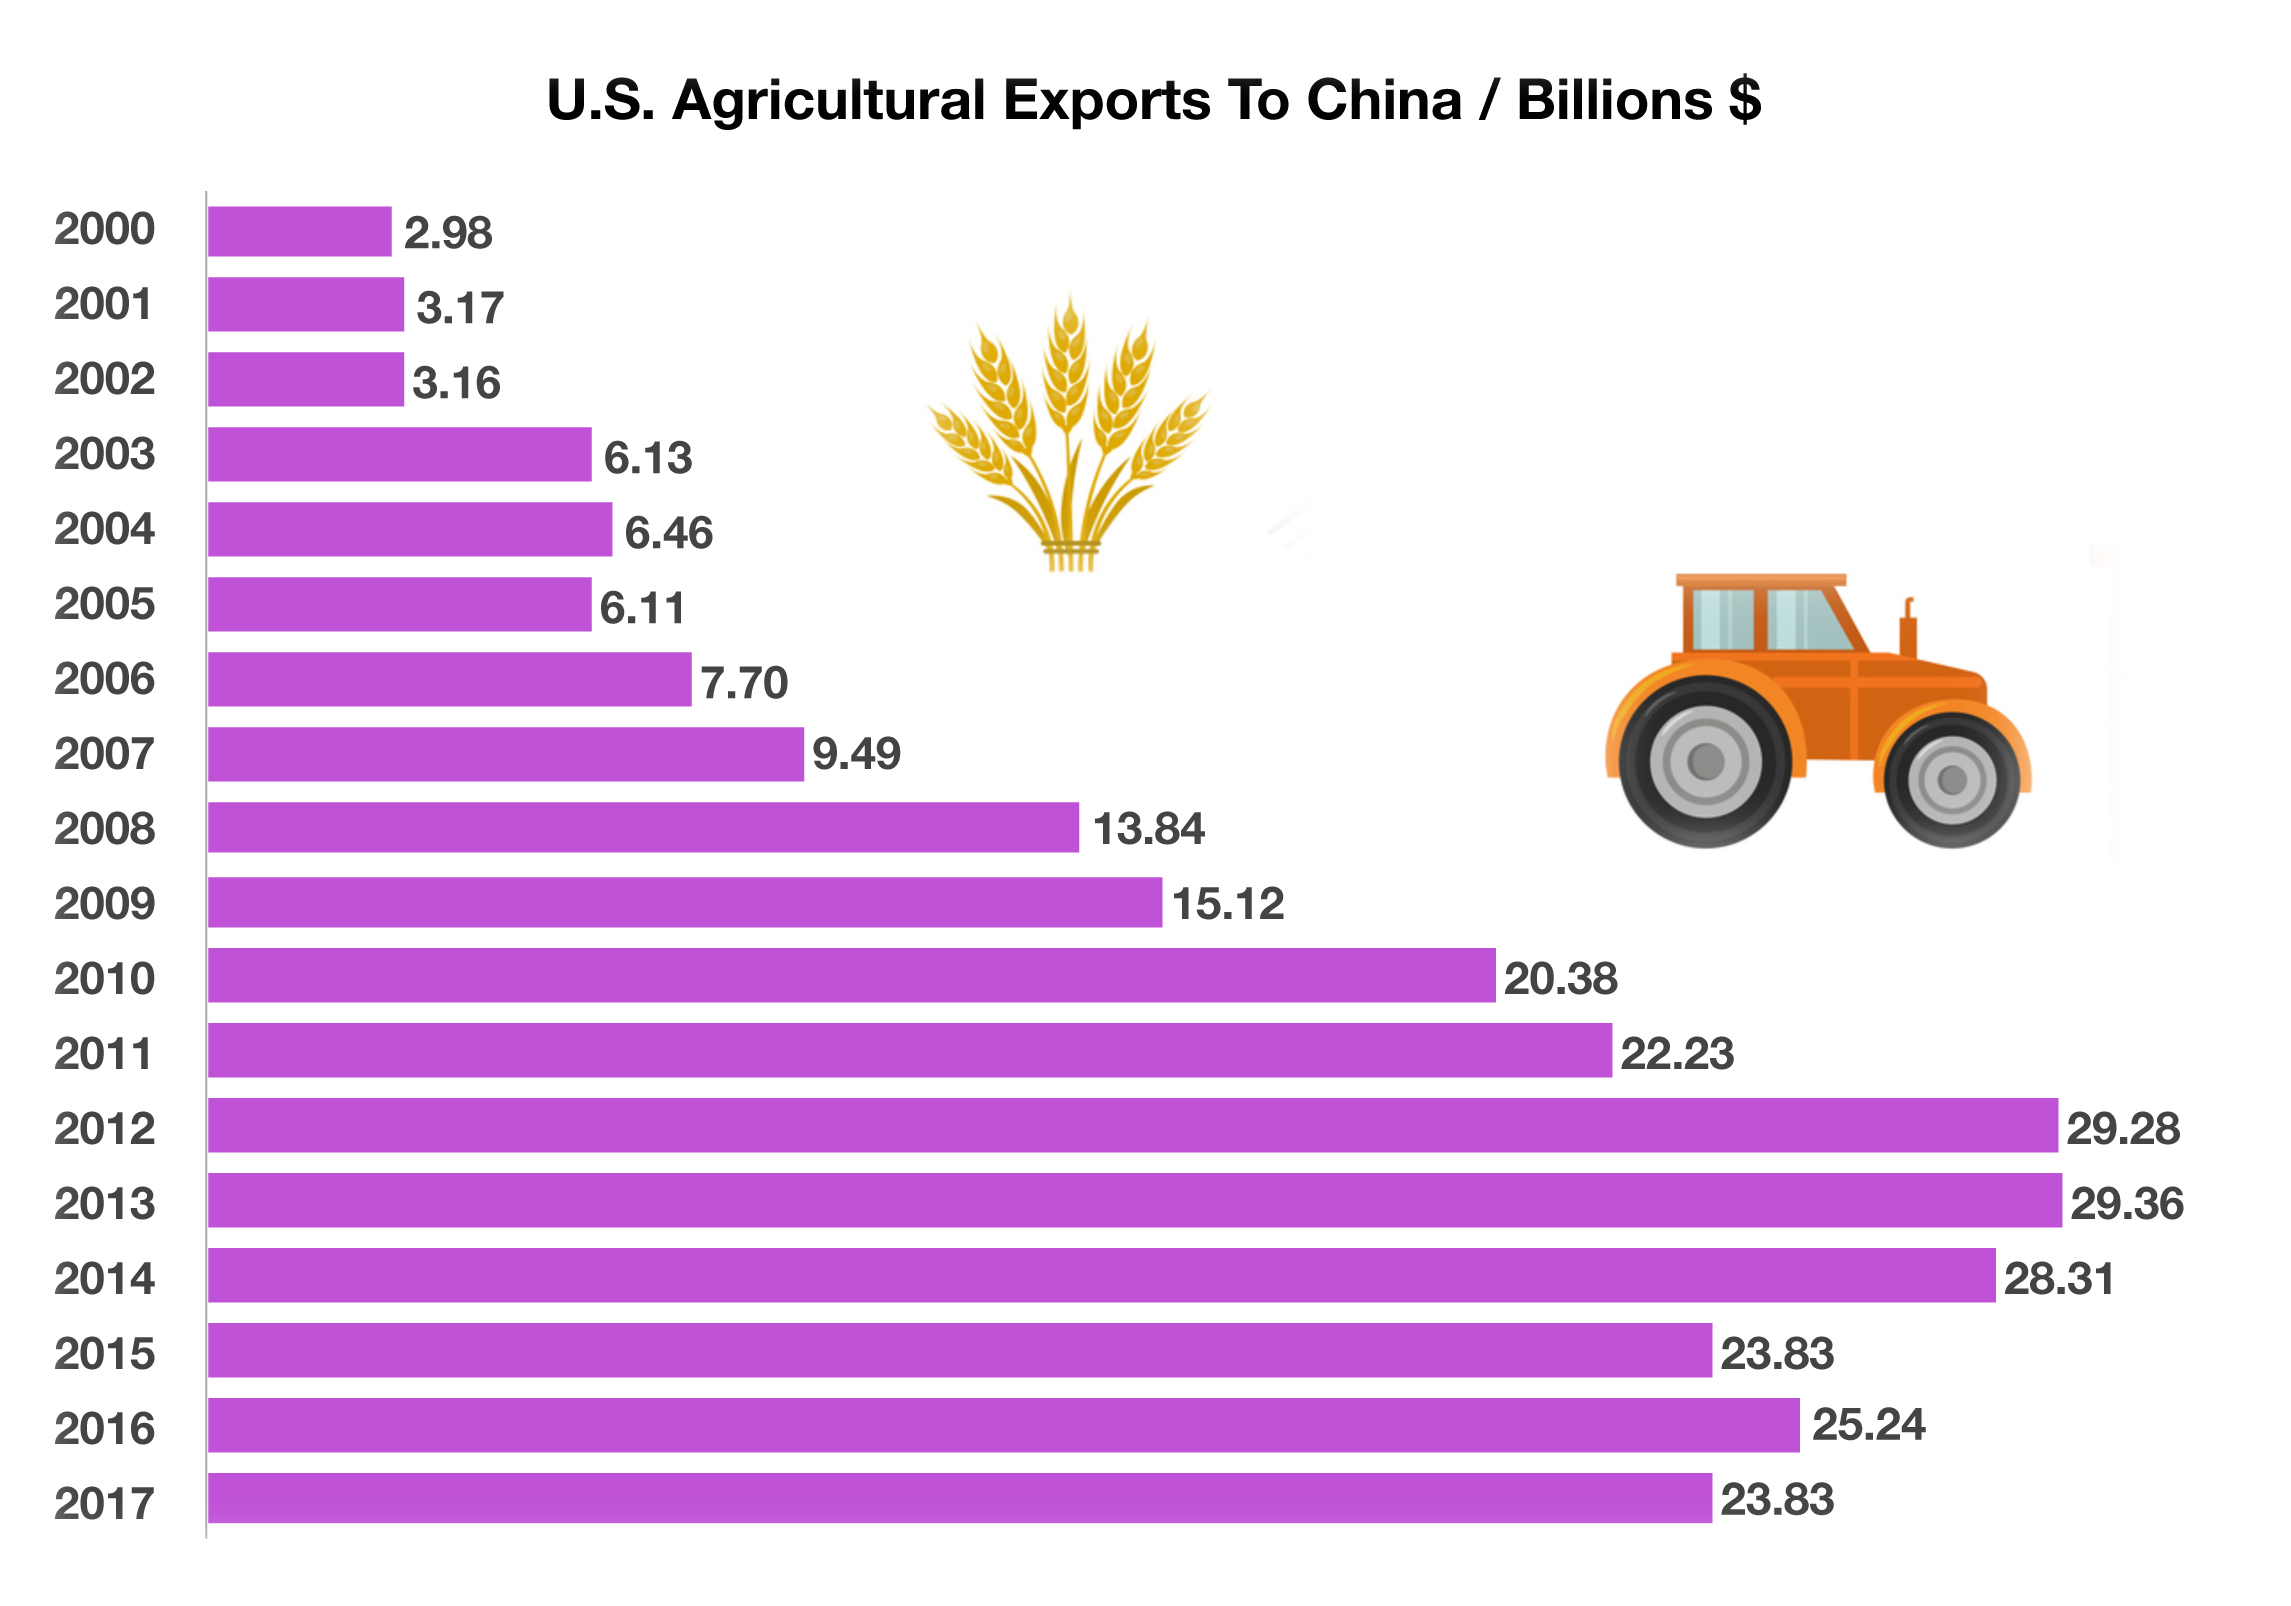
China is the largest export market for U.S. agricultural products, with over $28 billion of exports in 2017. Agricultural exports to China have steadily increased over the past few years, with a 700% increase from 2000 to 2017. 

Agricultural products exported to China include soybeans, cotton, pork, corn, and wheat. Soybeans account for the single largest agricultural export, representing over 50% of China’s soybean imports in 2017 alone.

Fallout from the trade disputes have recently given other countries the opportunity to capture agricultural market share from the U.S. Agricultural producing countries including Brazil, Australia, Canada, and Ukraine, which have all been able to increase exports to China as U.S. exports have fallen. The risk to U.S. exporters is that these alternate suppliers may take permanent market share away from the U.S.

Demand for U.S. exports may also be affected by slowing global growth. The IMF is estimating a 3% growth rate for the global economy in 2019, a drop from 3.6% in 2018. Among those countries expected to see a decline in growth are China, Japan and the United States. China’s forecast is primarily due to trade tensions and a drop in exports. India continues to grow at a favorable rate among both the emerging and developed economies.

(Sources: U.S. Department of Agriculture, IMF)