Ocean Park Capital Management

2503 Main Street

Santa Monica, CA 90405

Main: 310.392.7300

Daily Performance Line:  310.281.8577

November 2019
Market Update
(all values as of 08.30.2024)

Stock Indices:

Dow Jones 41,563
S&P 500 5,648
Nasdaq 17,713

Bond Sector Yields:

2 Yr Treasury 3.91%
10 Yr Treasury 3.91%
10 Yr Municipal 2.70%
High Yield 6.92%

YTD Market Returns:

Dow Jones 10.28%
S&P 500 18.42%
Nasdaq 18.00%
MSCI-EAFE 9.72%
MSCI-Europe 9.81%
MSCI-Pacific 9.34%
MSCI-Emg Mkt 7.44%
 
US Agg Bond 3.07%
US Corp Bond 3.49%
US Gov’t Bond 2.95%

Commodity Prices:

Gold 2,535
Silver 29.24
Oil (WTI) 73.65

Currencies:

Dollar / Euro 1.10
Dollar / Pound 1.31
Yen / Dollar 144.79
Canadian /Dollar 0.74

Fund Overview

Equities posted impressive gains in November, as did the Ocean Park funds.  Continuing the trend in October, our technology stocks were particularly strong.  We outperformed all of the major indices for the month, as well as the HFRI Equity Hedge Index, which was up 1.74% and is up 11.16% for the year to date.

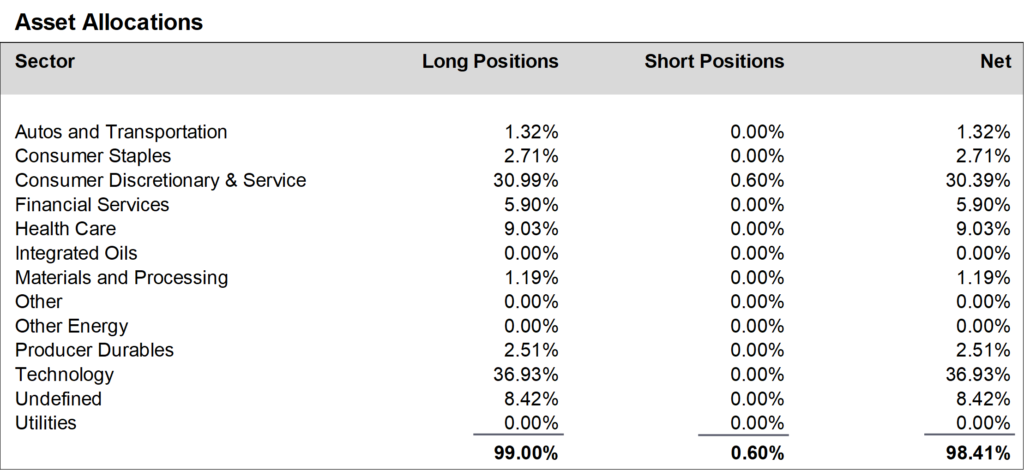
During November, we added to positions in the consumer staples and technology sectors and reduced positions in the producer durables sector. We ended the month at about 98% net long, up from about 94% in October.

A schedule showing the performance of the Investors Fund is included below, along with our Asset Allocation Chart. Daily updates on our activity are available on our Results Line, at
310-281-8577, and current information is also maintained on our website at www.oceanparkcapital.com. To gain access to the site enter password opcap.


*These results are pro forma. Actual results for most investors will vary. See additional disclosures on page 4. Past performance does not guarantee future results.

 
Equity Overview - November 2019

Equity Overview

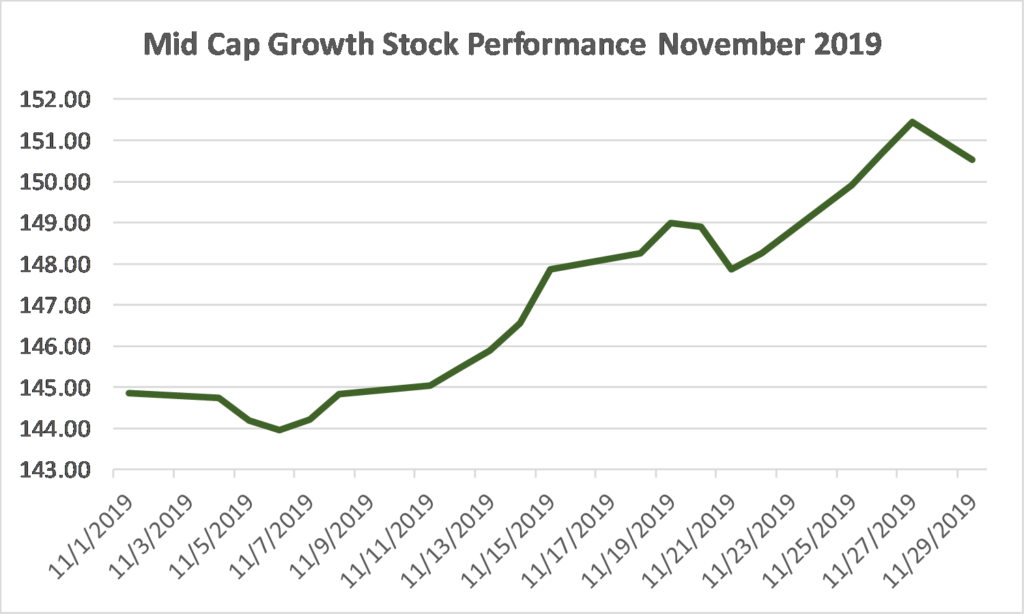
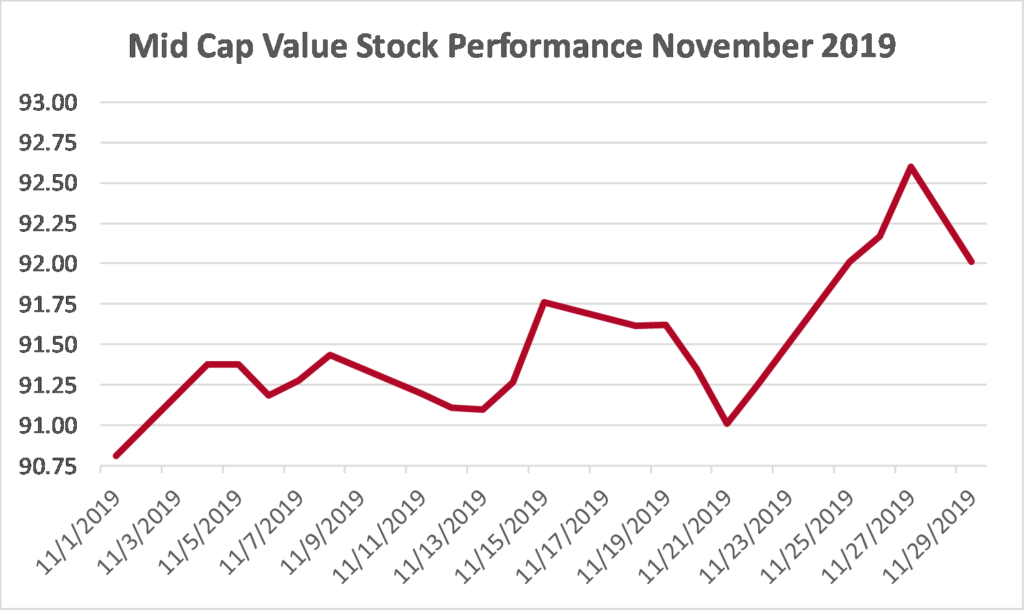
Investors in November continued to favor growth stocks over value stocks.  Technology, health care, and financial stocks were the strongest while real estate and utilities were the weakest. The forward 12-month price-earnings ratio for the S&P 500 rose from 17.2 to 17.6, versus the five-year average of 16.6.

3rd quarter corporate earnings reported in November were a bit less impressive than the numbers reported in October, but still solid.  With 96% of S&P 500 companies now reporting, the blended growth rate stands at -2.6%, but as we noted last month this compares favorably with the consensus expectation of -4.0%.  In addition, 75% of companies have now beaten consensus earnings estimates (better than the one-year and five-year averages) and 59% have beaten consensus revenue estimates (level with the one-year and five-year averages).


Macro Overview - November 2019

Macro Overview

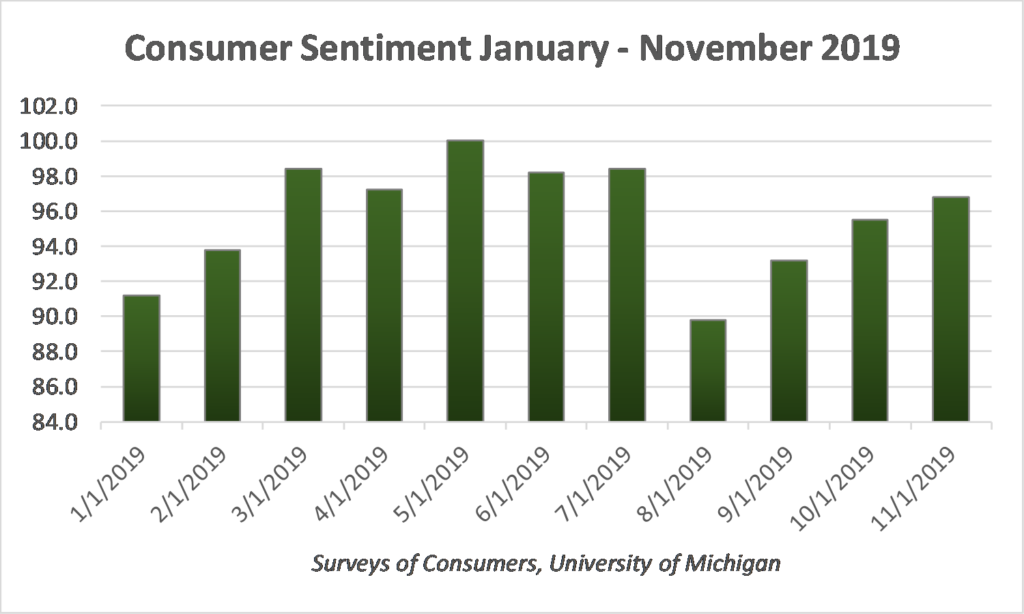
Economic data reported in November were generally positive.  Retail sales showed gains and consumer sentiment improved.  Third quarter GDP estimates were raised from 1.9% annualized to 2.1%, still below last year’s level but encouraging.   Employment was strong.  Sales of new homes were significantly higher, as mortgage rates remained low.  However manufacturing remains a soft spot, with ISM numbers below 50% indicating continued weakening.

Notes of the October Fed meeting, released in November, indicated that after the October rate cut (the third cut this year), the Fed will not act further in 2019.

International equity markets were generally higher, particularly in Europe where Christine Lagarde took over as president of the European Central Bank.  Notably, the unusual phenomenon of negative interest rates on global bonds appears to be abating, as the total worldwide dropped to $11.9 trillion from a high over the summer of $17 trillion.


Additional Disclosures and Privacy Notice

Additional Disclosures

Performance data for OPI reflect the reinvestment of dividends and other earnings on the fund’s assets.  Performance data for the major indices reflect only changes in the value of those indices, and would be higher if dividends were included. However, the index data do not reflect fees that would be paid to index fund managers and transaction costs that would be incurred when their component stocks are bought or sold, while OPI’s data do reflect quarterly fees and expenses incurred by the fund.  The information provided is believed to be reliable, but its accuracy or completeness is not warranted. This material is not intended as an offer or solicitation for the purchase or sale of any stock, bond, mutual fund, or any other financial instrument. The views and strategies discussed herein may not be appropriate and/or suitable for all investors. This material is meant solely for informational purposes, and is not intended to suffice as any type of accounting, legal, tax, or estate planning advice. Any and all forecasts mentioned are for illustrative purposes only and should not be interpreted as investment recommendations.


Privacy Notice

Federal privacy laws require that we explain to you how we handle “nonpublic personal information.”  This is information we receive or develop about you in the course of our relationship with you.  It includes information you provide to us orally or in the Confidential Investor Questionnaire or other forms, and information we learn about you in the course of providing services to you.

We do not disclose nonpublic personal information about you to third parties, except in certain limited circumstances.  These circumstances include (a) disclosure to our attorneys, auditors, prime brokers, or custodians in the course of providing services to you, (b) disclosure with your consent, or (c) disclosure where required by law or judicial process, such as a court order.

We also restrict your nonpublic personal information to those employees who need to know such information in order to provide services to you.  And we maintain physical, electronic, and procedural safeguards to protect your nonpublic personal information.

Please call us at (310) 392-7300 if you have any questions.