Dow Jones | 42,544 |
S&P 500 | 5,881 |
Nasdaq | 19,310 |
2 Yr Treasury | 4.25% |
10 Yr Treasury | 4.58% |
10 Yr Municipal | 3.13% |
High Yield | 7.27% |
Dow Jones | 12.88% |
S&P 500 | 23.31% |
Nasdaq | 28.64% |
MSCI-EAFE | 4.10% |
MSCI-Europe | 2.10% |
MSCI-Pacific | 6.60% |
MSCI-Emg Mkt | 7.60% |
US Agg Bond | 1.25% |
US Corp Bond | 2.13% |
US Gov’t Bond | 1.18% |
Gold | 2,638 |
Silver | 29.28 |
Oil (WTI) | 71.80 |
Dollar / Euro | 1.04 |
Dollar / Pound | 1.25 |
Yen / Dollar | 157.46 |
Canadian /Dollar | 0.69 |
Macro Overview
Markets have been undermined for weeks by the uncertainty of a phase-one trade deal outlined by U.S. and Chinese trade delegates. Optimism for a probable U.S.-China trade deal stemmed from the progression toward a phase-one deal that might include a rollback of certain tariffs by both the U.S. and China.
Global equity markets continued to elevate in November against a backdrop of political events and optimism surrounding ongoing trade negotiations. With the year end approaching, focus has shifted to the 2020 election, a phase-one trade deal, the Fed maintaining rates, and receding recession concerns.
A broad barometer of the current status of the country’s economic well being is the money supply, which essentially measures the level of cash in savings accounts, checking accounts, CDs, and money market funds. Money supply has grown over 10% during the past quarter, translating into plenty of excess liquidity for financial markets and providing a buffer against any unexpected volatility.
Fixed income analysts expect that the Fed is attempting to normalize interest rates by holding off on any further rate changes until economic data offers a clearer view of where the economy is headed. Analysts believe that subdued inflation exceptions by the Fed may leave rates steady heading into 2020.
There are less global bonds yielding negative rates, down to $11.9 trillion from a peak of $17 trillion in the summer. Lessening negative yields is indicative of a possibly stronger global economy, sparking a drive to equities to capture growth prospects. Some believe that the president’s objective of a weaker U.S. dollar would be beneficial for both international equities and exports of U.S. products around the world.
Consumers continue to spend at retail stores and on food heading into the holiday season, buoying economic activity throughout the country. Consumer expenditures represent over two-thirds of GDP, an integral part of the nation’s economy. A continued low-rate environment, along with a strong job market, has allowed consumers to spend generously on retail and food. (Sources: Commerce Dept., Bloomberg, Federal Reserve, BLS)
Global Markets Elevate – Equity Review
Domestic equities finished November with gains not seen since the summer.
Optimism surrounding U.S.-China trade discussions helped fuel equities higher, with technology, health care, and financials as the leading sectors in November.
The absence of volatility, along with the Fed maintaining a steady rate environment, was also a catalyst for equities to climb in November. Stock market volatility, as measured by the VIX Index, dropped to its lowest levels since April.
U.S. equity markets have outperformed international equities over the past two years so far. Historically, a lower U.S. dollar has benefited international stocks, as well as help increase exports of U.S. products worldwide. (Sources: U.S. Commerce Department, Bloomberg)
Looks Like QE But It’s Not Says The Fed – Fixed Income Overview
The Federal Reserve is slowly re-expanding its balance sheet by currently buying $60 billion of Treasury bills each month. Reminiscent of the Fed’s Quantitative Easing (QE) program, meant to stimulate economic activity, the Fed denies that it is QE, but rather just a buffer for any possible bond market volatility.
Interest rates are believed to have stabilized for the time being, as the Fed has essentially placed a hold on raising and lowering rates until further notice. The yield on the 10-year treasury bond ended November at 1.78%, essentially where it’s been for the past two months.
The presidential race is promoting bond buyers to consider municipal bonds in order to hedge against any possible increase in tax rates. The tax free interest generated by municipal bonds has historically been a benefit for certain investors in the higher tax brackets. (Source: Federal Reserve)
Presidential Candidate Tax Proposals Influence Voter Turnout – Politics In Review
Taxes and income inequality have become a primary agenda topic for several presidential candidates. Various proposals from the candidates include repealing the Tax & Jobs Act, removing the step-up basis for inherited assets, increasing capital gains tax, imposing a financial transaction tax, and eliminating the tax deduction for mortgage interest on a second home.
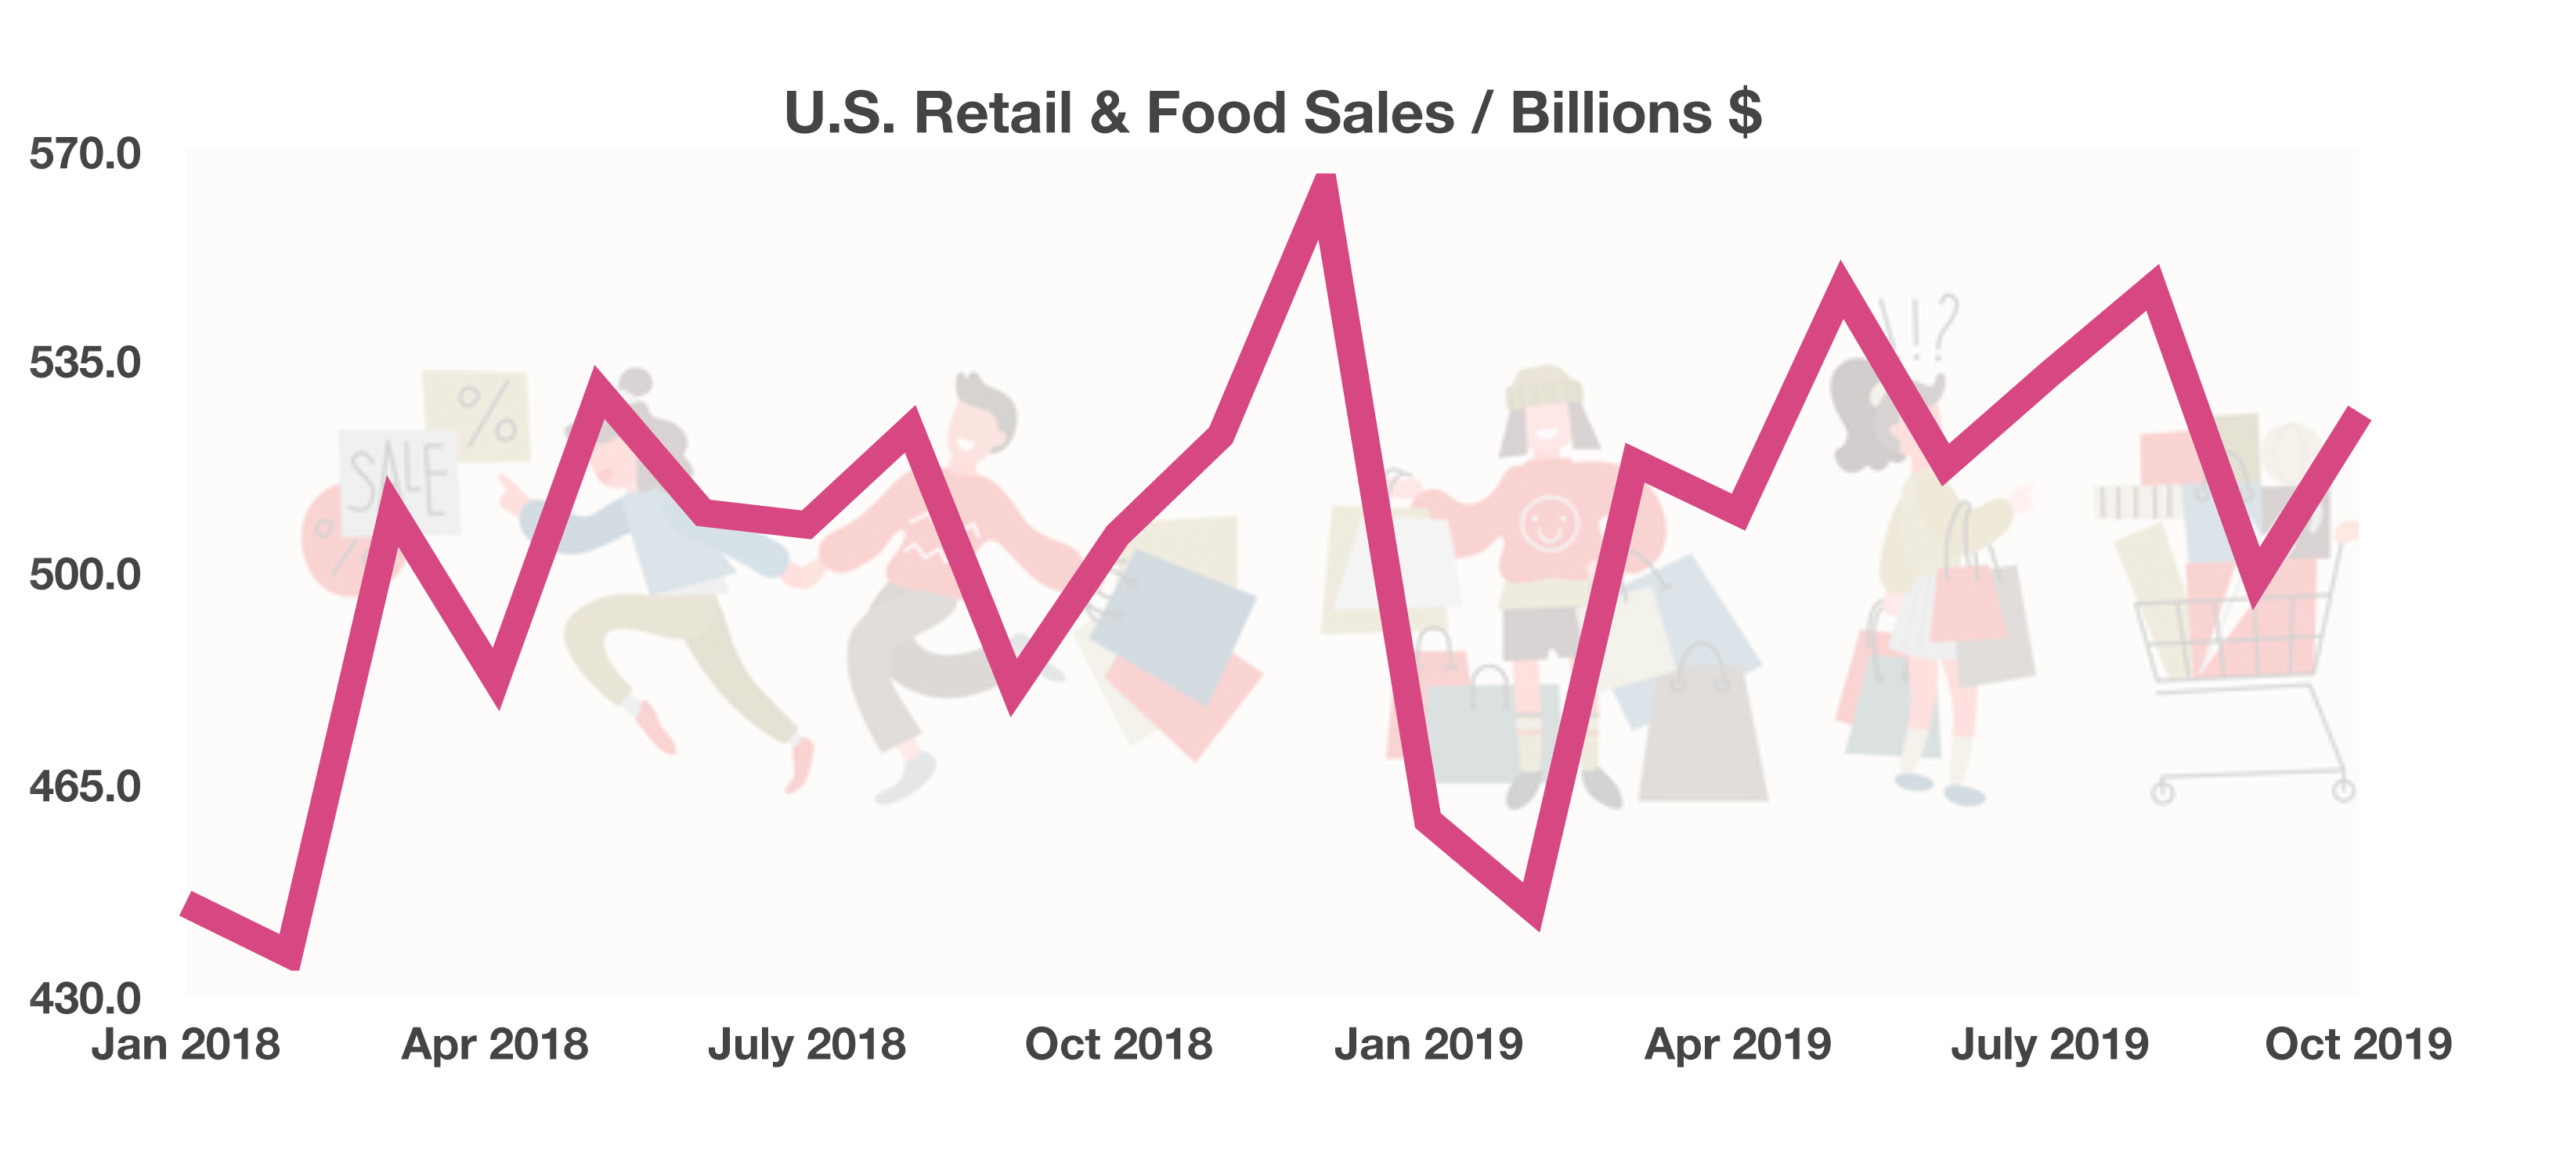
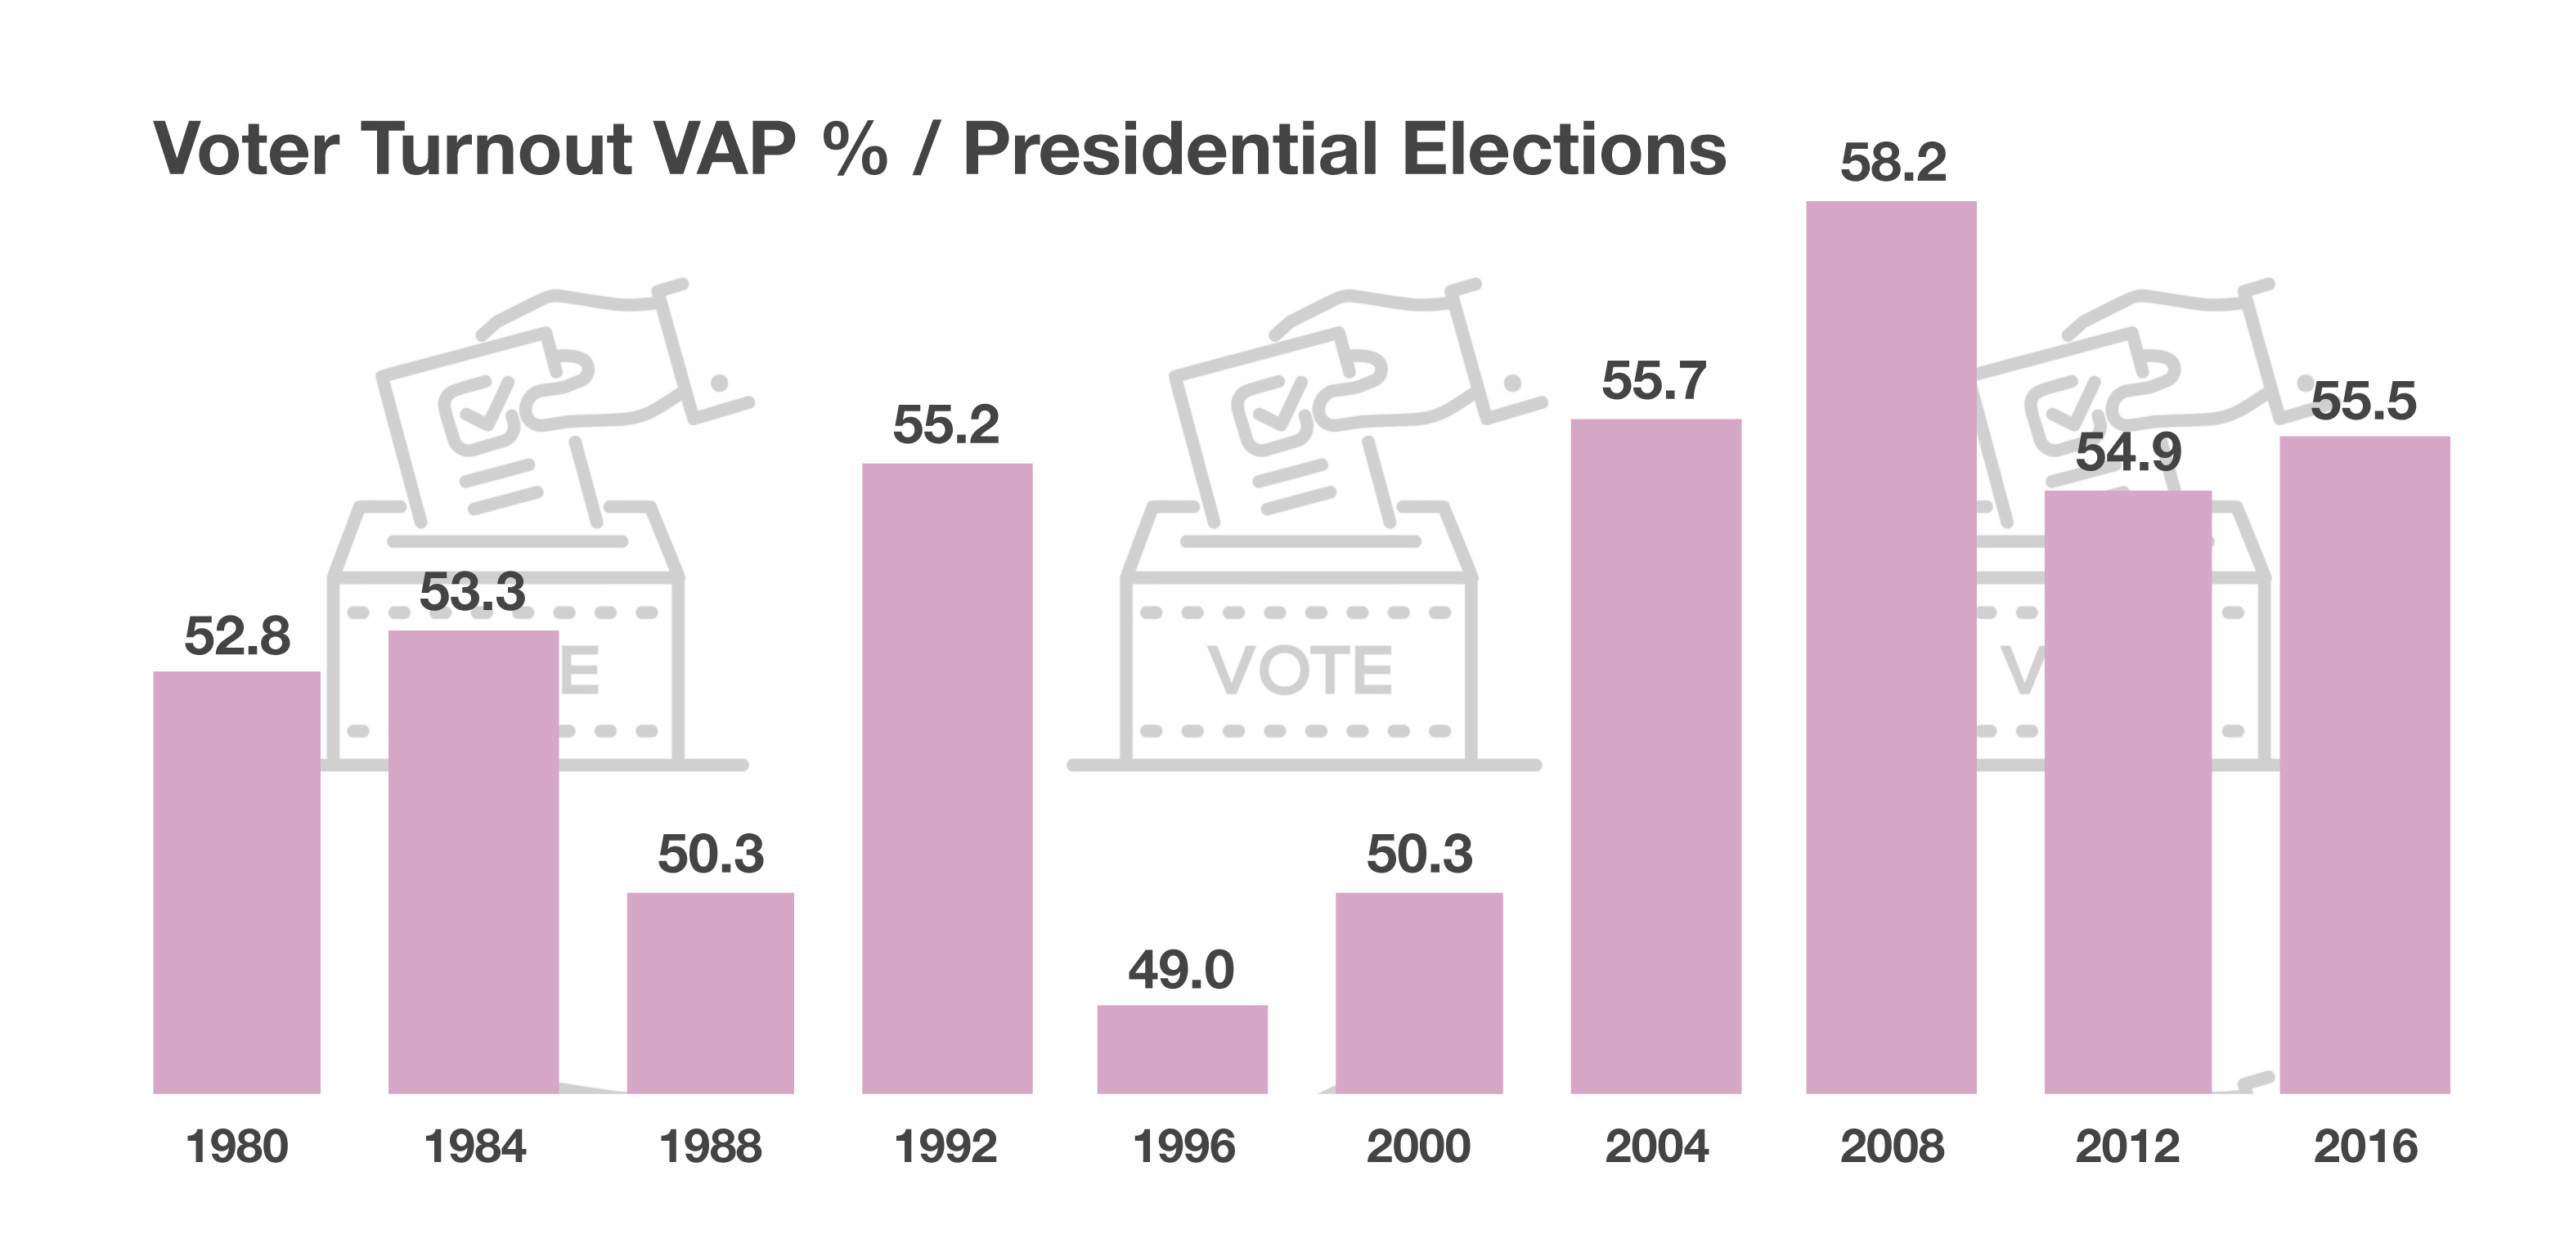
Presidential election voter turnout is tracked by the Bipartisan Policy Center, which monitors voter turnout state by state. The 2016 presidential election saw an estimated 55% of the voting age population (VAP) turn out to vote. Who actually turns out to vote can be driven by the candidates’ policies and how it may affect individuals. The number of voters has varied over the years and has always been very difficult to predict. (Source: Bipartisan Policy Center)
Medigap Plan F Phasing Out – Medicare Benefits Update
Of the ten Medicare supplemental plans, known also as Medigap, the single most popular plan, Plan F, will be eliminated at the end of the year to new subscribers.
Retirees who turn 65 after 2019 will no longer have Plan F as an option. Plan F is the most expensive supplemental option since there are no deductibles, no co-pays and no additional bills after a doctor’s visit.
Plan G has become the next best comprehensive plan after Plan F is phased out to newcomers. Plan G is almost identical to Plan F with the exception of having to pay the Medicare deductible before insurance pays any benefits.
A Medigap policy supplements expenses not covered by Medicare including co-payments, co-insurance, and deductibles. Medigap policies are sold by private insurance companies and vary in pricing and coverage from state to state.
The following are important aspects regarding Medigap policies:
In order to have Medigap coverage, one must have Medicare Part A & Part B.
A Medigap policy only covers one person, not a married couple. So, each person needs their own separate policy.
Any standardized Medigap policy is guaranteed renewable even with a pre-existing condition.
Medigap does not cover prescription drugs. Medicare Part D does offer coverage for prescription drugs.
Medigap policies generally don’t cover long-term care, vision, dental care, hearing aids, eyeglasses, or private nursing. (Source: medicare.gov)
What It Takes To Be In the Top 1% Of Earners – Fiscal Policy
According to the most recent data released by the IRS, it took earnings of $515,371 to be part of the top 1% of earners in 2017. It took an additional 7.2% to crack the 1% mark from the prior year, equal to an additional $37,106 in income.
Of the 138,945,000 individual tax returns filed in 2017, 1,432,952 returns fell into the top 1% category. The top 50% tax earners were, on the other hand, more representative of taxpayers across the country, with an income threshold of $41,740. There were over 71 million taxpayers that fell into the top 50% in 2017.
(Source: IRS, www.irs.gov/statistics/soi)
U.S. Agricultural Exports To China Decline – Trade Policy Review
China is the largest export market for U.S. agricultural products, with over $28 billion of exports in 2017. Agricultural exports to China have steadily increased over the past few years, with a 700% increase from 2000 to 2017.
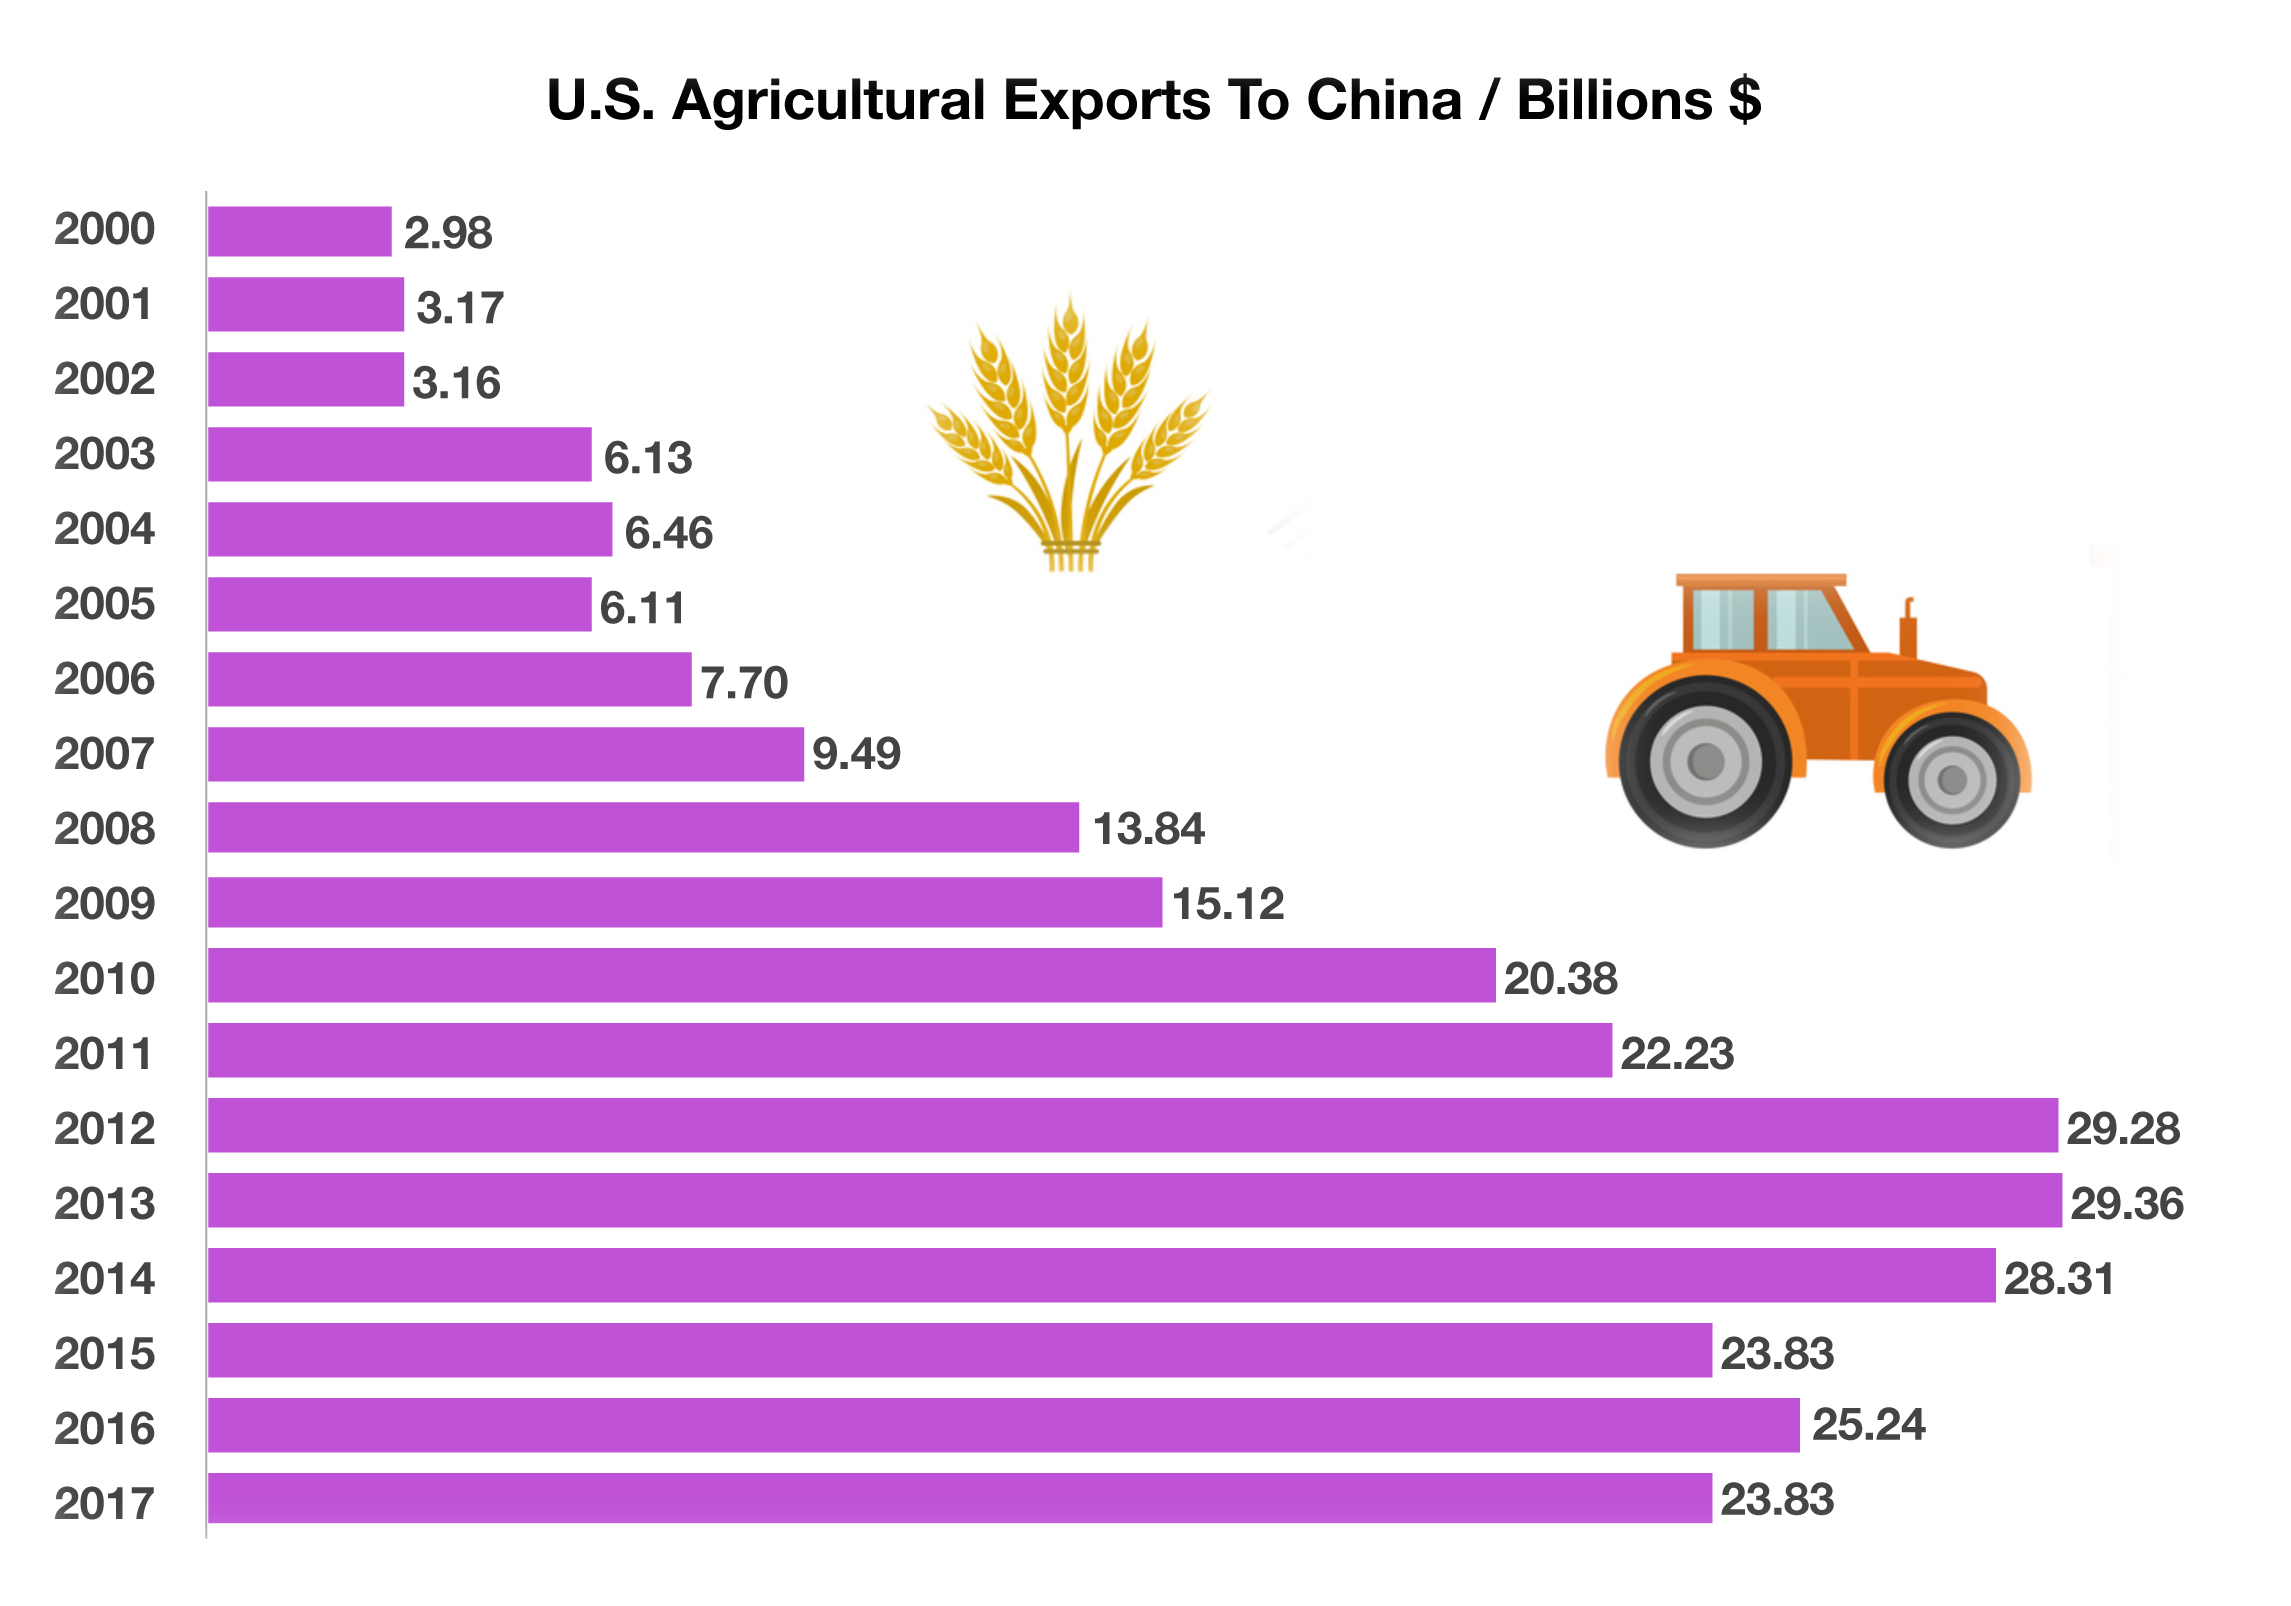
Agricultural products exported to China include soybeans, cotton, pork, corn, and wheat. Soybeans account for the single largest agricultural export, representing over 50% of China’s soybean imports in 2017 alone.
Fallout from the trade disputes have recently given other countries the opportunity to capture agricultural market share from the U.S. Agricultural producing countries including Brazil, Australia, Canada, and Ukraine, which have all been able to increase exports to China as U.S. exports have fallen. The risk to U.S. exporters is that these alternate suppliers may take permanent market share away from the U.S.
Demand for U.S. exports may also be affected by slowing global growth. The IMF is estimating a 3% growth rate for the global economy in 2019, a drop from 3.6% in 2018. Among those countries expected to see a decline in growth are China, Japan and the United States. China’s forecast is primarily due to trade tensions and a drop in exports. India continues to grow at a favorable rate among both the emerging and developed economies.
(Sources: U.S. Department of Agriculture, IMF)
CORPORATE BOND MARKET
This week the “Bond God” Jeffrey Gundlach appeared on CNBC to discuss the economy and to warn investors about the corporate debt bubble. We have written extensively about the debt bubble and the inevitable carnage that is coming and how it will affect fixed income investors for some time and feel it is time to once again review this ticking time bomb. Here are just a few points that Mr. Gundlach made that should alert investors to the dangers in the corporate bond market:
Regular readers know that we have been echoing this sentiment since we began the newsletter 2 years ago and much like Mr. Gundlach, we are surprised the damn has not yet burst but are confident it is coming. Below is a chart of U.S. non-financial corporate debt:
CONTINUED ON NEXT PAGE
DEBT EXPLOSION
Looking at the chart on the previous page you can see that from the 1940’s to the mid 1980’s we accumulated approximately $1 trillion in corporate debt. Over the next 35 years the debt has exploded as we are now closing in on $7 trillion in corporate debt. It is not a coincidence that the debt rocket took off in the 1980’s which was when the “junk bond” market was created. Another important takeaway from this chart is that corporate debt has doubled since the great recession, moving from $3 trillion in the mid 2000’s to over $6 trillion today. Today many analyst and economist justify the debt bubble by saying the economy is doing well, that corporate earnings are good and that the debt is not a problem. The chart below shows total public debt as a percentage of GDP:
Total debt is now over 100% of GDP and growing rapidly. Many analyst point to Japan where debt to GDP has been running at 200% for years but the difference is the Japanese people are savers and most of the debt is owned by their citizens who are unlikely to force the government into bankruptcy any time soon. This allows the Japanese government to keep rates artificially low and hence keeps the debt service manageable. Clearly the Fed is in the same position, they can’t afford to allow interest rates to rise too much because debt service would become too large and eat up too much of the budget. Unfortunately, American’s are not savers and most of our debt is owned by foreign countries and institutional investors (or the Fed itself). What happens if China gets tired of our “trade wars” and decides to become a net seller of U.S. Treasuries? The CBO projects that interest payments on the debt will rise from $389 billion in 2019 to $914 billion in 2028 and it is easy to envision scenarios where it could top $1 trillion (rising interest rates). That would mean the 1/4 of the governments revenue would be going to pay interest on the debt. By 2023 debt service will total more than the entire defense budget!!
The point of all of this is that it isn’t just corporate debt but debt of every type that has ballooned and it will begin to consume more and more of the budgets of not just governments but all entities (including households) and will ultimately become a huge drag on economic growth. The proof is the fact the during the last round of “economic tightening” the Fed could only raise rates to 2.4% before the economy began to falter and investors started to revolt (historically it has been able to raise rates to well over 5%).
BOND MARKET LIQUIDITY
We have discussed the lack of liquidity in the bond market in past issues but since we are discussing the debt bubble and the poor quality of the existing debt felt it appropriate delve into this subject once again. This is from the St. Louis Fed’s own website:
“An asset is said to be “liquid” if traders can convert it quickly to cash without materially affecting its market price. The market for large cap stocks is liquid because equity claims are relatively homogeneous and there are normally large numbers of buyers and sellers trading on centralized exchanges. Most bond markets are highly illiquid, primarily because bonds are highly idiosyncratic. Even bonds issued by the same entity normally differ along several dimensions, including maturity, coupon rate, and covenants. Because this is so, bonds typically trade over-the-counter (OTC)—that is, in a decentralized trading environment where idiosyncratic bonds must be matched with willing buyers. These markets are typically very thin, and most bonds do not even trade on secondary markets.”
“There has been a growing concern as of late that liquidity conditions in even relatively liquid bond markets have deteriorated in recent years. If this is so, then even modest events may trigger an unexpected and undesirable disruption in financial markets. In the summer of 2013, for example, when Fed chair Ben Bernanke hinted at a possible slowdown in the pace of Fed bond purchases, the bond market reacted violently in what was described as a “taper tantrum.” Another example is the Oct. 15, 2014, “flash rally” in which the 10-year on-the-run U.S. Treasury experienced an incredible 40 basis point movement in a single day for no apparent reason. According to a report released by the U.S. Treasury Department, it seems that for a brief period of time there were far more trades to buy Treasuries than trades to sell. That this happened in the most liquid of all bond markets raises a concern with other less-liquid bond markets. Might a modest increase in the Fed policy rate induce a “rush to the exits,” forcing a fire sale of bonds into an illiquid market to meet redemption payments?”
” Standard measures, such as bid-ask spreads, are of little help because historically narrow bid-ask spreads can widen suddenly in a liquidity event. Some commentators have pointed to the post-financial-crisis behavior of the 22 primary dealers, who play an important role as market makers for bonds. In fact, primary dealer inventories in corporate bonds have declined from over $250 billion in 2007 to about $50 billion in 2015. Since 2007, the supply of U.S. corporate bonds has increased from about $3.2 trillion to almost $5.0 trillion (see graph above), so that the dealer inventory relative to outstanding debt has dropped precipitously. Moreover, prior to 2007, dealers were net long in corporate bonds and net short in U.S. Treasuries. Dealers are now net long in Treasuries. This, together with their reduced holdings of corporate securities, suggests that dealers’ willingness and/or ability to take on risk has diminished greatly since 2008. Many commentators blame the Volcker rule, which was designed to curtail the proprietary trading activities of dealer banks.”
Obviously these numbers were from 2015 and the reality is that things have gotten even worse. As we pointed out, corporate debt is now over $6 trillion (vs. the $5 trillion mentioned by the Fed) and dealer inventories have continued to decrease. On the next page we will tie this all together and hopefully illustrate why now is not the time to take risk in the bond market.
RECAP
So we have a corporate bond market that is out of control – exploding with mis-rated low quality debt. Debt of every type from personal to government and corporate debt reaching all time highs. Interest on the debt consuming more and more of the budgets of these entities which is a drag on the economy. Insatiable investor demand has pushed credit spreads too all time historic lows. Bond market liquidity has decreased dramatically since the great recession as new regulations have made it increasingly difficult for investment banks and dealers to carry risk. What could possibly go wrong?
CONCLUSION
Clearly this is going to end badly the question is the timing. In his interview, Mr. Gundlach was vague and said “it will happen in the next decade” but hinted he thought in the next 5 years. We have been echoing Mr. Gundlach’s warnings for some time and have been surprised how long the Fed has been able to push the inevitable recession, stock market crash and bond implosion into the future but at some point the piper will be paid. Given the massive amount of low quality debt and the lack of liquidity this event will almost certainly dwarf past credit events. Low quality companies will be defaulting on their debt, ratings agencies will once again scramble to play catch-up and quickly lower ratings of marginal companies. This will trigger massive institutional selling and there will be few buyers (remember, many of these large institutions have strict guidelines as to how much junk rated debt they can carry and when the are force to sell in unison on downgrades it will send prices plummeting).
While this all sounds scary the truth is for those prepared it will create a generational opportunity to create wealth. Investors with liquidity will find no shortage of opportunities to purchase solid corporate, mortgage and asset backed debt at distressed prices not seen since the great recession (probably even better). Most retail investors will get left out of the opportunity since their adviser likely has very little knowledge of or access to the bond markets. Some investors will simply sit and wait it out while others will just buy the beaten down stock indexes waiting for the recovery but the big money will be made in the bond market. Remember, bonds tend to fall faster (due to liquidity) and savvy investors can actually purchase securities for below their true value in a rush to the exits scenario. Bonds also tend to recover far more quickly than stocks. In one of our previous newsletter we demonstrated this phenomenon during the oil crisis of 2016, where oil bonds plummeted 50% or more but recovered almost all their losses in a matter of months while the stocks languished for years. During the credit crisis, it took years for stocks to recover, the S&P returned 23.45%, 12.78%, 0% and 13.48% in 2009, 2010, 2011, 2012 respectively after falling 38.49% in 2008. However, many solid mortgage backed bonds fell by 80% or more and many rallied back to $80+ in just a 2-3 year period (plus interest) generating 40%+ annualized returns for a 3 year period. Savvy bond investors more than doubled their money in 3 years and we believe a similar situation is setting up now and whether it happens in 1, 3, or 5 years it will pay to be ready.
We suggest income investors keep short durations and purchase high quality bonds that will lose very little value in a sell-off. Monthly cash-flow abs and mbs are ideal because when the crash comes the monthly cash-flow can be re-invested at higher levels. There are plenty of opportunities to earn 5% safely in today’s bond market for those who know where to look and we believe the patience will pay off in spades in the not so distant future.