Ocean Park Capital Management

2503 Main Street

Santa Monica, CA 90405

Main: 310.392.7300

Daily Performance Line:  310.281.8577

November 2023
Market Update
(all values as of 03.29.2024)

Stock Indices:

Dow Jones 39,807
S&P 500 5,254
Nasdaq 16,379

Bond Sector Yields:

2 Yr Treasury 4.59%
10 Yr Treasury 4.20%
10 Yr Municipal 2.52%
High Yield 7.44%

YTD Market Returns:

Dow Jones 5.62%
S&P 500 10.16%
Nasdaq 9.11%
MSCI-EAFE 5.06%
MSCI-Europe 4.60%
MSCI-Pacific 5.82%
MSCI-Emg Mkt 1.90%
 
US Agg Bond -0.78%
US Corp Bond -0.40%
US Gov’t Bond -0.72%

Commodity Prices:

Gold 2,254
Silver 25.10
Oil (WTI) 83.12

Currencies:

Dollar / Euro 1.08
Dollar / Pound 1.26
Yen / Dollar 151.35
Canadian /Dollar 0.73

Portfolio Overview

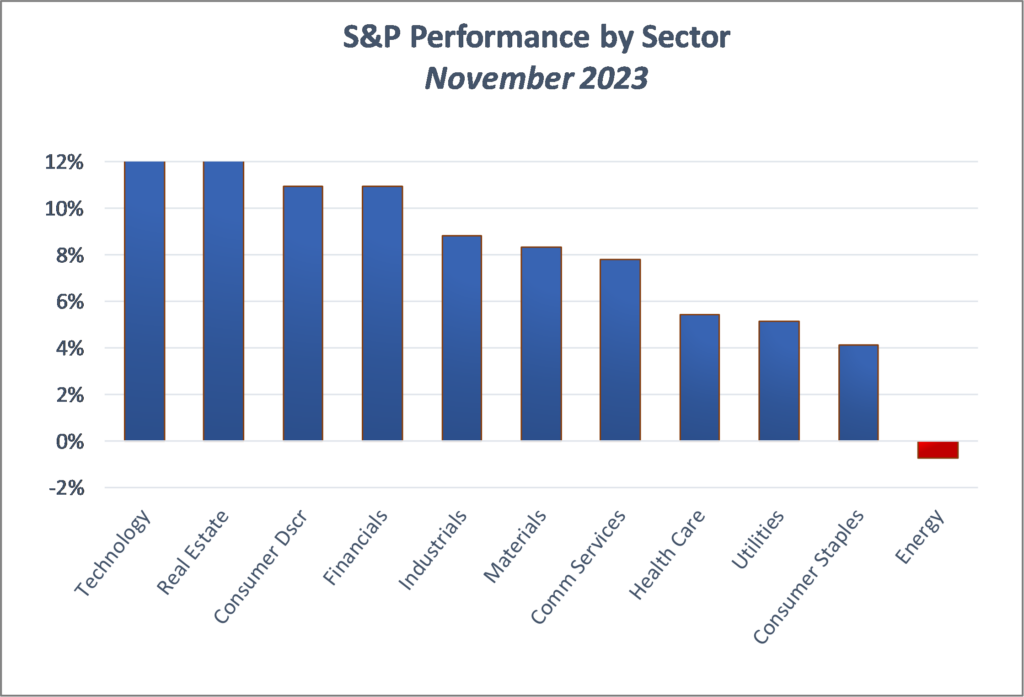
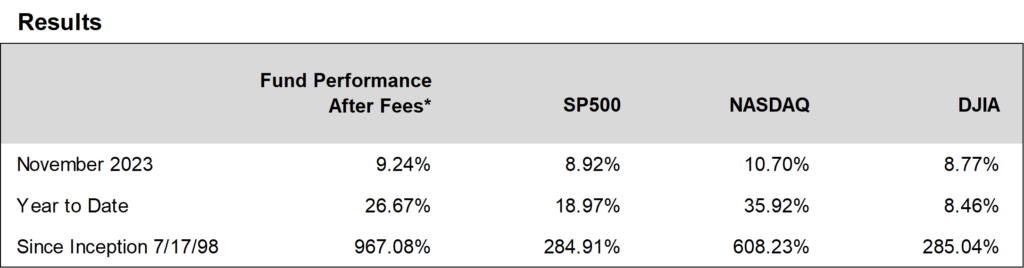
Ocean Park Investors Fund gained 9.24%* in November, while the S&P 500 gained 8.92% and the NASDAQ Composite gained 10.70%.  Portfolio holdings in technology stocks led the way, with standouts including Palo Alto Networks (up 21%), Advanced Micro Devices (up 23%), Salesforce (up 25%), and Crowdstrike (up 34%).

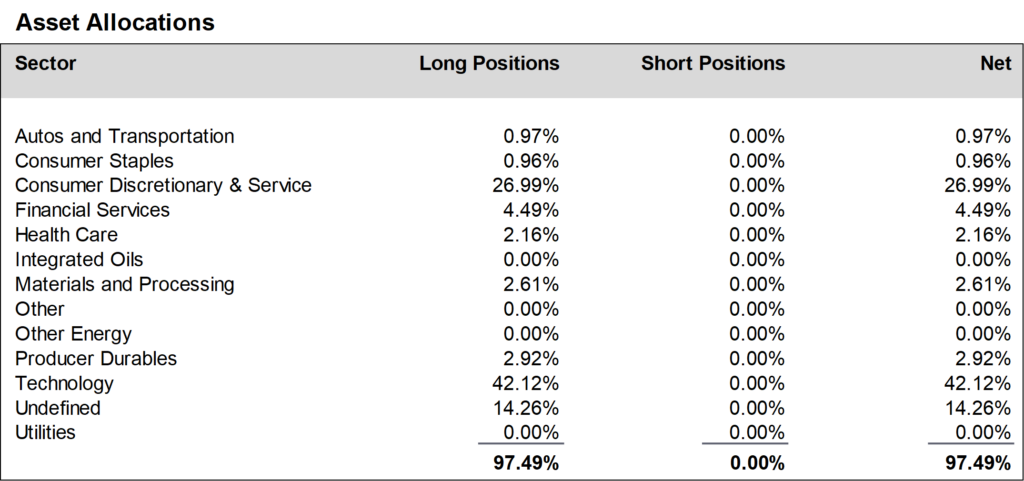
During the month, we reduced positions in the health care and consumer discretionary sectors and increased exposure to the technology sector and the QQQ ETF.  About half of our stocks reported earnings in November, and most of those reports were strong.  We closed several positions ahead of (or after) reporting disappointing earnings, including Deere, Emerson Electric, Ulta Beauty, and Walmart.  We replaced them with stocks with a likelihood of good earnings and positive guidance such as Intuit, TJX, and Xylem.  We finished the month at about 97% net long, unchanged from October.


Daily updates on our activity are available on our Results Line, at 310-281-8577, and current information is also maintained on our website at www.oceanparkcapital.com. To gain access to the site enter password opcap.

*These results are pro forma. Actual results for most investors will vary. See additional disclosures on page 4. Past performance does not guarantee future results.

 
Equity Overview

Equity Overview

Stocks rebounded smartly in November as ten of eleven sectors in the S&P 500 rose.  Technology was the big winner and energy was the only loser.  Volatility moderated as the S&P 500 moved more than 1% on 4 of 21 trading days, as compared with 8 of 22 trading days in October.  Value stocks narrowly outperformed growth stocks.

The recent theme in corporate earnings reports—strong earnings but moderate revenue growth—continued in November.  With 94% of S&P 500 companies reporting, 82% have beaten consensus earnings expectations which is better than the one-year and five-year averages.  But only 62% have beaten consensus revenue expectations, which is below the one-year and five-year averages.  The market rewarded third quarter earnings beats more than usual and punished misses much more than usual.  Beats resulted in average gains of 1.1% from the period two days before the report to two days after the report, which was slightly better than the 5-year average.  Misses resulted in average losses of 4.6% during that period, which was far worse than the 5-year average.

Even with the strong gains in stock prices, the 12-month forward price/earnings ratio for the S&P 500 only inched up to 18.6, still a touch below the 5-year average of 18.7 and still reasonable.


Macro Overview

Macro Overview

Economic data released in November was promising.  The Consumer Price Index increased 3.2% year-over-year, down from 3.7% the previous month and the lowest rate since July.  Producer prices dropped 0.5% month-over-month which was the first decline since May and the largest decline since April 2020.  The Commerce Department’s second estimate of third quarter GDP growth was 5.2% annualized, even higher than its initial estimate of 4.9%.  The Fed kept interest rates unchanged.  Job growth slowed modestly and unemployment ticked up but this was viewed positively as it suggested that the economy was not in danger of overheating—which could cause the Fed to reverse course and raise interest rates.

The bond market reacted positively to indications that inflation is abating.  Interest rates on the 10-year US Treasury fell to 4.35% from a peak of 5% in October—the largest one-month decline since 2008.  And the US aggregate bond index rose almost 5% in November which was its largest monthly gain in 35 years.

At the last possible minute, Congress extended government funding until mid-January, narrowly avoiding the shutdown threatened for November 17.  Unfortunately, the deal came too late for Moody’s.  It kept the US government’s AAA bond rating but lowered the outlook from Stable to Negative, citing a worsening fiscal position and political polarization.  This followed the more serious downgrade by Fitch, which lowered the rating in August from AAA to AA+.


Additional Disclosures and Privacy Notice

Additional Disclosures

Performance data for OPI reflect the reinvestment of dividends and other earnings on the fund’s assets.  Performance data for the major indices reflect only changes in the value of those indices, and would be higher if dividends were included. However, the index data do not reflect fees that would be paid to index fund managers and transaction costs that would be incurred when their component stocks are bought or sold, while OPI’s data do reflect quarterly fees and expenses incurred by the fund.  The information provided is believed to be reliable, but its accuracy or completeness is not warranted. This material is not intended as an offer or solicitation for the purchase or sale of any stock, bond, mutual fund, or any other financial instrument. The views and strategies discussed herein may not be appropriate and/or suitable for all investors. This material is meant solely for informational purposes, and is not intended to suffice as any type of accounting, legal, tax, or estate planning advice. Any and all forecasts mentioned are for illustrative purposes only and should not be interpreted as investment recommendations.


Privacy Notice

Federal privacy laws require that we explain to you how we handle “nonpublic personal information.”  This is information we receive or develop about you in the course of our relationship with you.  It includes information you provide to us orally or in the Confidential Investor Questionnaire or other forms, and information we learn about you in the course of providing services to you.

We do not disclose nonpublic personal information about you to third parties, except in certain limited circumstances.  These circumstances include (a) disclosure to our attorneys, auditors, prime brokers, or custodians in the course of providing services to you, (b) disclosure with your consent, or (c) disclosure where required by law or judicial process, such as a court order.

We also restrict your nonpublic personal information to those employees who need to know such information in order to provide services to you.  And we maintain physical, electronic, and procedural safeguards to protect your nonpublic personal information.

Please call us at (310) 392-7300 if you have any questions.