Stock Indices:
| Dow Jones | 40,669 |
| S&P 500 | 5,569 |
| Nasdaq | 17,446 |
Bond Sector Yields:
| 2 Yr Treasury | 3.60% |
| 10 Yr Treasury | 4.17% |
| 10 Yr Municipal | 3.36% |
| High Yield | 7.69% |
YTD Market Returns:
| Dow Jones | -4.41% |
| S&P 500 | -5.31% |
| Nasdaq | -9.65% |
| MSCI-EAFE | 12.00% |
| MSCI-Europe | 15.70% |
| MSCI-Pacific | 5.80% |
| MSCI-Emg Mkt | 4.40% |
| US Agg Bond | 3.18% |
| US Corp Bond | 2.27% |
| US Gov’t Bond | 3.13% |
Commodity Prices:
| Gold | 3,298 |
| Silver | 32.78 |
| Oil (WTI) | 58.22 |
Currencies:
| Dollar / Euro | 1.13 |
| Dollar / Pound | 1.34 |
| Yen / Dollar | 142.35 |
| Canadian /Dollar | 0.72 |
Macro Overview
A change in sentiment was prevalent throughout the markets as new rules and regulatory reversals began to take effect. Volatility rose as markets tried to discern President Trump’s policies.
Equity markets propelled to new highs in January as optimism fueled U.S. equities, sending the Dow Jones Industrial Average to a new milestone level of 20,000. The S&P 500 Index and the Nasdaq Composite Index also reached new highs during the month.
Executive orders undertaken by the President were able to derail several rules signed into law by the Obama administration, yet fiscal policy initiatives proposed by President Trump such as tax cuts and tax reform need Congressional approval. The Congressional Review Act (CRA) will allow the Republican led Congress to reverse a number of regulations enacted by the prior administration.
Fiscal concepts presented by the President may encourage companies with ample cash to invest in capital rather than buying back their own stock or issuing heftier dividend payouts. A lagging key component of GDP has been capital spending.
The National Federation of Independent Business released their survey of small business optimism, which soared 7.5% to its fifth highest level in over 40 years of survey results. (Sources: Fed, NFIB, Dow Jones, S&P)
Increase In Bond Yields Stall – Fixed Income Update
Demand for bonds increased towards the end of January following a pull back in equities. The rise in bond demand brought bond yields lower from their elevated levels earlier in the month. An inverse relationship exists with bonds, as bond prices rise, bond yields fall.
Analysts believe that the anticipation of increased infrastructure spending and government borrowing might lead to a significant boost in Treasury borrowing, which could push up borrowing costs for the government in the form of higher interest rates.
Remarks by Fed Chairperson Janet Yellen signaled that the Fed intends to increase rates throughout 2017, contingent on economic and employment growth. Janet Yellen’s term as Fed chief ends in June 2018, allowing the President to appoint a new Fed boss then. (Sources: Federal Reserve, Bloomberg)
ERVS – Price Timing vs. Market Timing
We have remained heavily weighted in cash since before the Presidential election in our core strategy. This is very unusual for us, and less a response to macroeconomics and market volatility than to the high equity prices. The Elite Relative Value Strategy (EVRS) makes use of our proprietary internally calculated relative value price model applied to a small target universe of common equities. Said simply, we buy good companies when the the price is low and sell when it is high. For the most part, we are unconcerned with the vicissitudes of the market. Those interested in learning more about our strategy should request our 17 page Owner’s Manual.
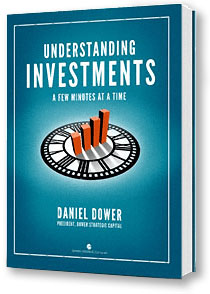 Want to become a better investor? Our advice is to learn all you can. Toward this end our Chief Portfolio Manager, Daniel Dower, has made his book “Understanding Investments a Few Minutes at a Time” available for free in ebook form. To register for Daniel’s book just click on the link below:
 eral Reserve. The Quantitative Easing programs, aka Q.E. 1 & Q.E. 2, provided tremendous liquidity for nearly eight years as the Fed bought debt and placed it on its balance sheet.
 More than 61 million people participate in employer-sponsored retirement programs like 401(k), 403(b), 457 and Thrift plans. But many investors simply do not feel qualified or comfortable selecting and managing investments within their employer-sponsored retirement accounts. You, like many others, may need help choosing how to invest 401k from among the investments your employer’s plan offers and allocating those choices appropriately. Unless you work for a retirement investment firm or a very large company, chances are your options for plan investments are limited. Properly managing your employer-sponsored retirement account may have a profound impact on your retirement goals. Regardless of whom you work for if you are invested in a company plan Our 401K planning partner can provide you with comprehensive investment advice. Click on the following link to learn more.