February 2017
Market Update
(all values as of 04.30.2025)

Stock Indices:

Dow Jones 40,669
S&P 500 5,569
Nasdaq 17,446

Bond Sector Yields:

2 Yr Treasury 3.60%
10 Yr Treasury 4.17%
10 Yr Municipal 3.36%
High Yield 7.69%

YTD Market Returns:

Dow Jones -4.41%
S&P 500 -5.31%
Nasdaq -9.65%
MSCI-EAFE 12.00%
MSCI-Europe 15.70%
MSCI-Pacific 5.80%
MSCI-Emg Mkt 4.40%
 
US Agg Bond 3.18%
US Corp Bond 2.27%
US Gov’t Bond 3.13%

Commodity Prices:

Gold 3,298
Silver 32.78
Oil (WTI) 58.22

Currencies:

Dollar / Euro 1.13
Dollar / Pound 1.34
Yen / Dollar 142.35
Canadian /Dollar 0.72


Macro Overview

A change in sentiment was prevalent throughout the markets as new rules and regulatory reversals began to take effect. Volatility rose as markets tried to discern President Trump’s policies.

Equity markets propelled to new highs in January as optimism fueled U.S. equities, sending the Dow Jones Industrial Average to a new milestone level of 20,000. The S&P 500 Index and the Nasdaq Composite Index also reached new highs during the month.

Executive orders undertaken by the President were able to derail several rules signed into law by the Obama administration, yet fiscal policy initiatives proposed by President Trump such as tax cuts and tax reform need Congressional approval. The Congressional Review Act (CRA) will allow the Republican led Congress to reverse a number of regulations enacted by the prior administration.

Among President Trump’s first actions as president was to withdraw the U.S. from the Trans-Pacific Partnership, strengthen border parameters with Mexico and temporarily disallow certain immigrants from entering the U.S. Two highly contested oil pipeline projects were granted the ability to advance, the Keystone Pipeline and the Dakota Access pipeline.

Pharmaceutical companies became a Presidential target, as President Trump approached drug makers to lower their prices and manufacture their products in the U.S. The President’s agenda of repealing portions of the Affordable Care Act may also affect premium and medical costs.

Fiscal concepts presented by the President may encourage companies with ample cash to invest in capital rather than buying back their own stock or issuing heftier dividend payouts. A lagging key component of GDP has been capital spending.

The National Federation of Independent Business released their survey of small business optimism, which soared 7.5% to its fifth highest level in over 40 years of survey results. (Sources: Fed, NFIB, Dow Jones, S&P)


It Took The Dow Jones 120 Years To Reach 20,000


Increase In Bond Yields Stall – Fixed Income Update

Demand for bonds increased towards the end of January following a pull back in equities. The rise in bond demand brought bond yields lower from their elevated levels earlier in the month. An inverse relationship exists with bonds, as bond prices rise, bond yields fall.

Analysts believe that the anticipation of increased infrastructure spending and government borrowing might lead to a significant boost in Treasury borrowing, which could push up borrowing costs for the government in the form of higher interest rates.

Remarks by Fed Chairperson Janet Yellen signaled that the Fed intends to increase rates throughout 2017, contingent on economic and employment growth. Janet Yellen’s term as Fed chief ends in June 2018, allowing the President to appoint a new Fed boss then. (Sources: Federal Reserve, Bloomberg)


Dow Jones Reaches 20,000 – Domestic Equity Update

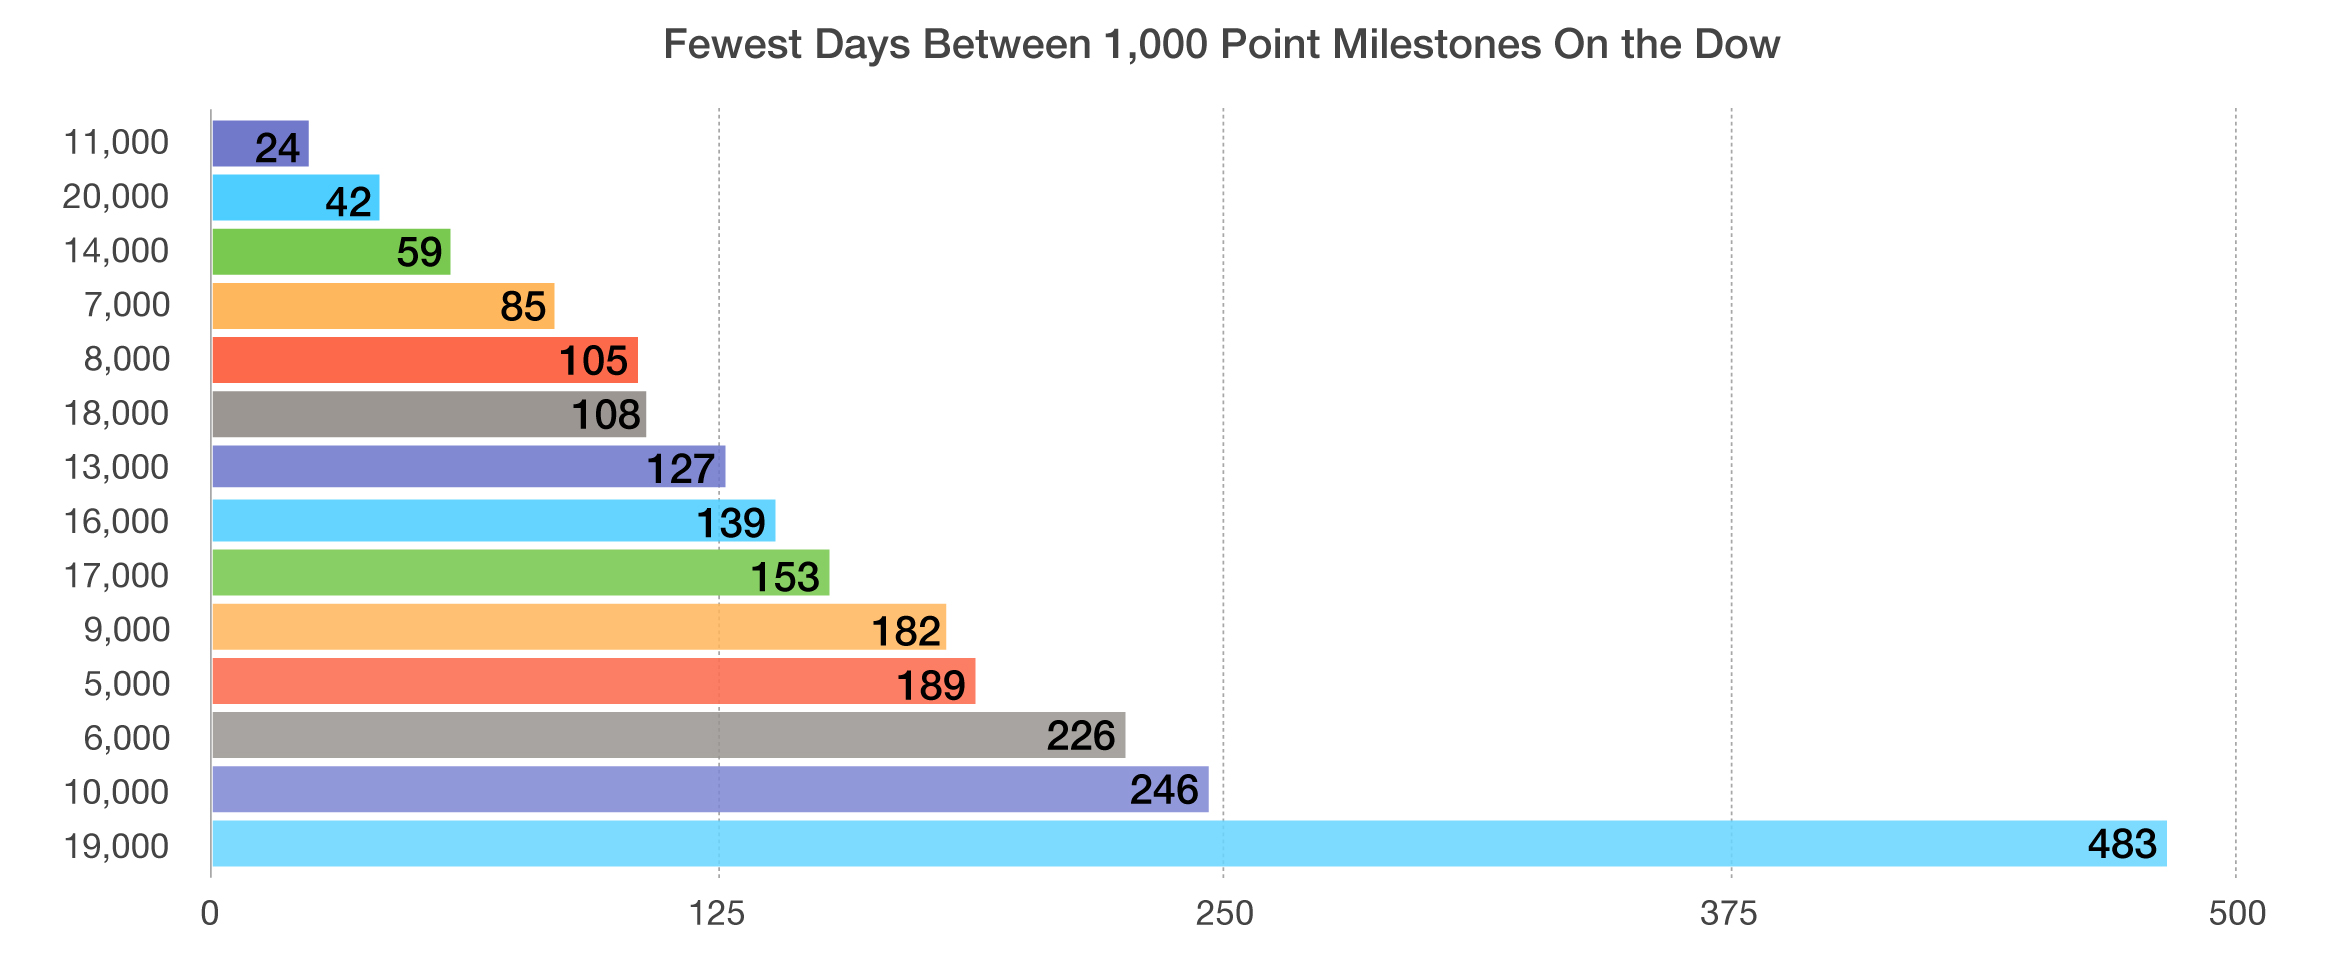
The Dow Jones Industrial Average hit the milestone 20,000 mark in January. The 120-year old index took 103 years to reach 10,000 in March 1999, then another 18 years to reach 20,000 in January 2017. The move from 19,000 to 20,000 took just 42 trading days, the second quickest 1,000 point gain in history for the index. The single fastest 1,000 gain occurred during the dot com boom in 1999 when the index jumped from 10,000 to 11,000 in only 24 days. Two other notable equity indices also reached new highs in January, the S&P 500 and the Nasdaq.

Equity markets pulled back at the end of January as uncertainty surrounding various administrative policies and some disappointing corporate earnings fueled a retraction of major indices. Earnings were mixed in January as earnings were reported for various companies across different sectors.

A common complaint about stock market growth has been the fact that most companies found it easier to simply issue debt at low interest rates and buy back their own stock, rather than investing in capital with the constant tide of regulatory resistance discouraging expenditures. (Sources: Dow Jones, S&P)


Homes Become Less Affordable


Homes Become Less Affordable As Rates Move Up – Housing Market

The recent rise in rates has led to a drop in the Housing Affordability Index as tracked by the Federal Reserve. Both existing and new home sales slowed towards the end of 2016 as a rise in rates pushed mortgage rates higher. Rising interest rates tend to increase the cost factor when purchasing a home with a mortgage loan.

The two most feasible methods of raising the Affordability Index is by either having an increase in wages or by having a drop in housing prices. Historically, home prices tend to fall much faster than wages rise, since pay raises take time.

The Housing Affordability Index is negatively correlated to the 10-year Treasury Bond yield, meaning that as yields rise, the Affordability Index declines. (Source: St Louis Federal Reserve Bank)


Largest Trade Deficits

Largest Trade Deficits With U.S. By Country – International Trade

The United States has provided a tremendous consumer market for countries all over the world, with an abundance of products imported from a variety of areas.

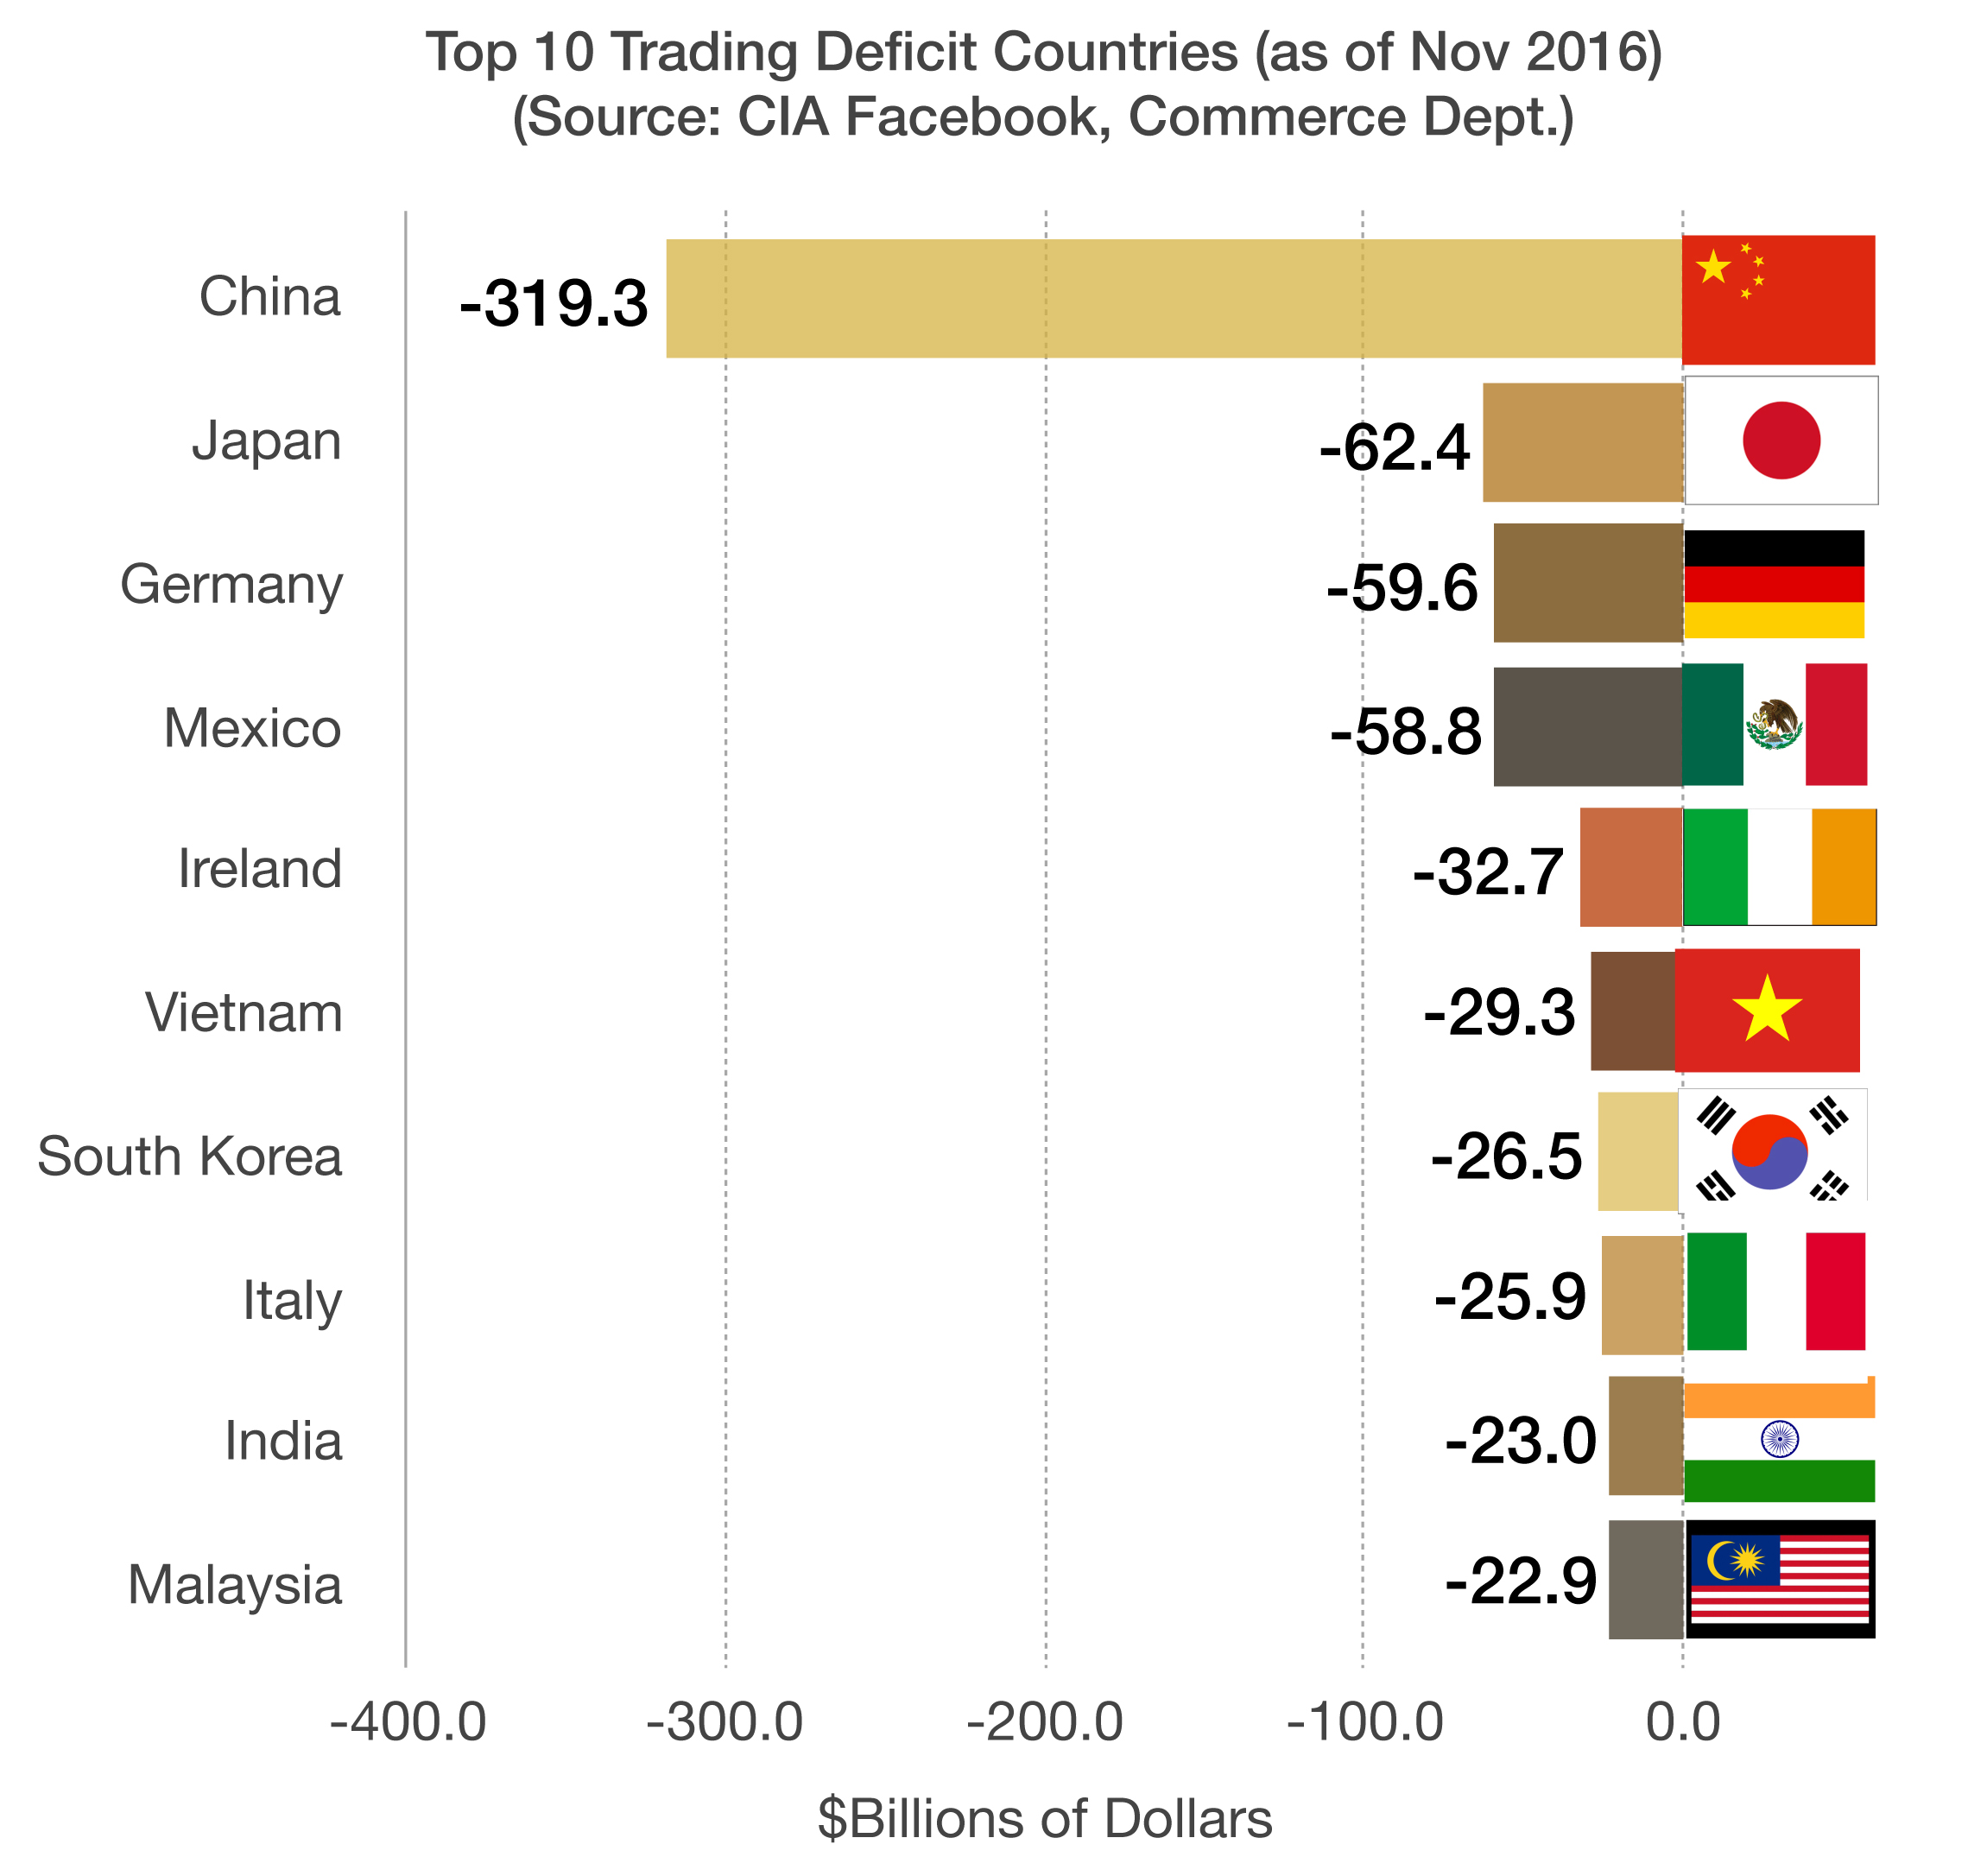
Growing U.S. consumer demand over the decades along with advanced electronic manufacturing facilities in China and throughout Asia have given American consumers cheap products. Ambitious consumer behavior has created a trade deficit with China of over $319 billion dollars, followed by smaller deficits with Japan, Germany and Mexico.
The current deficits with Japan and Germany are primarily comprised of automobiles and machinery, while the deficit with China mostly consists of electronics.

Appreciation of the U.S. dollar versus other major currencies has made foreign products relatively cheap for American consumers, including automobiles, computers, and televisions. (Source: CIA Factbook)


Change At The Helm – Market Fact

When President Obama assumed the presidency on January 20, 2009, the financial markets were in the midst of turmoil and tremendous uncertainty. Economic growth and prosperity had reversed from earlier years of expansion during the 2000’s.

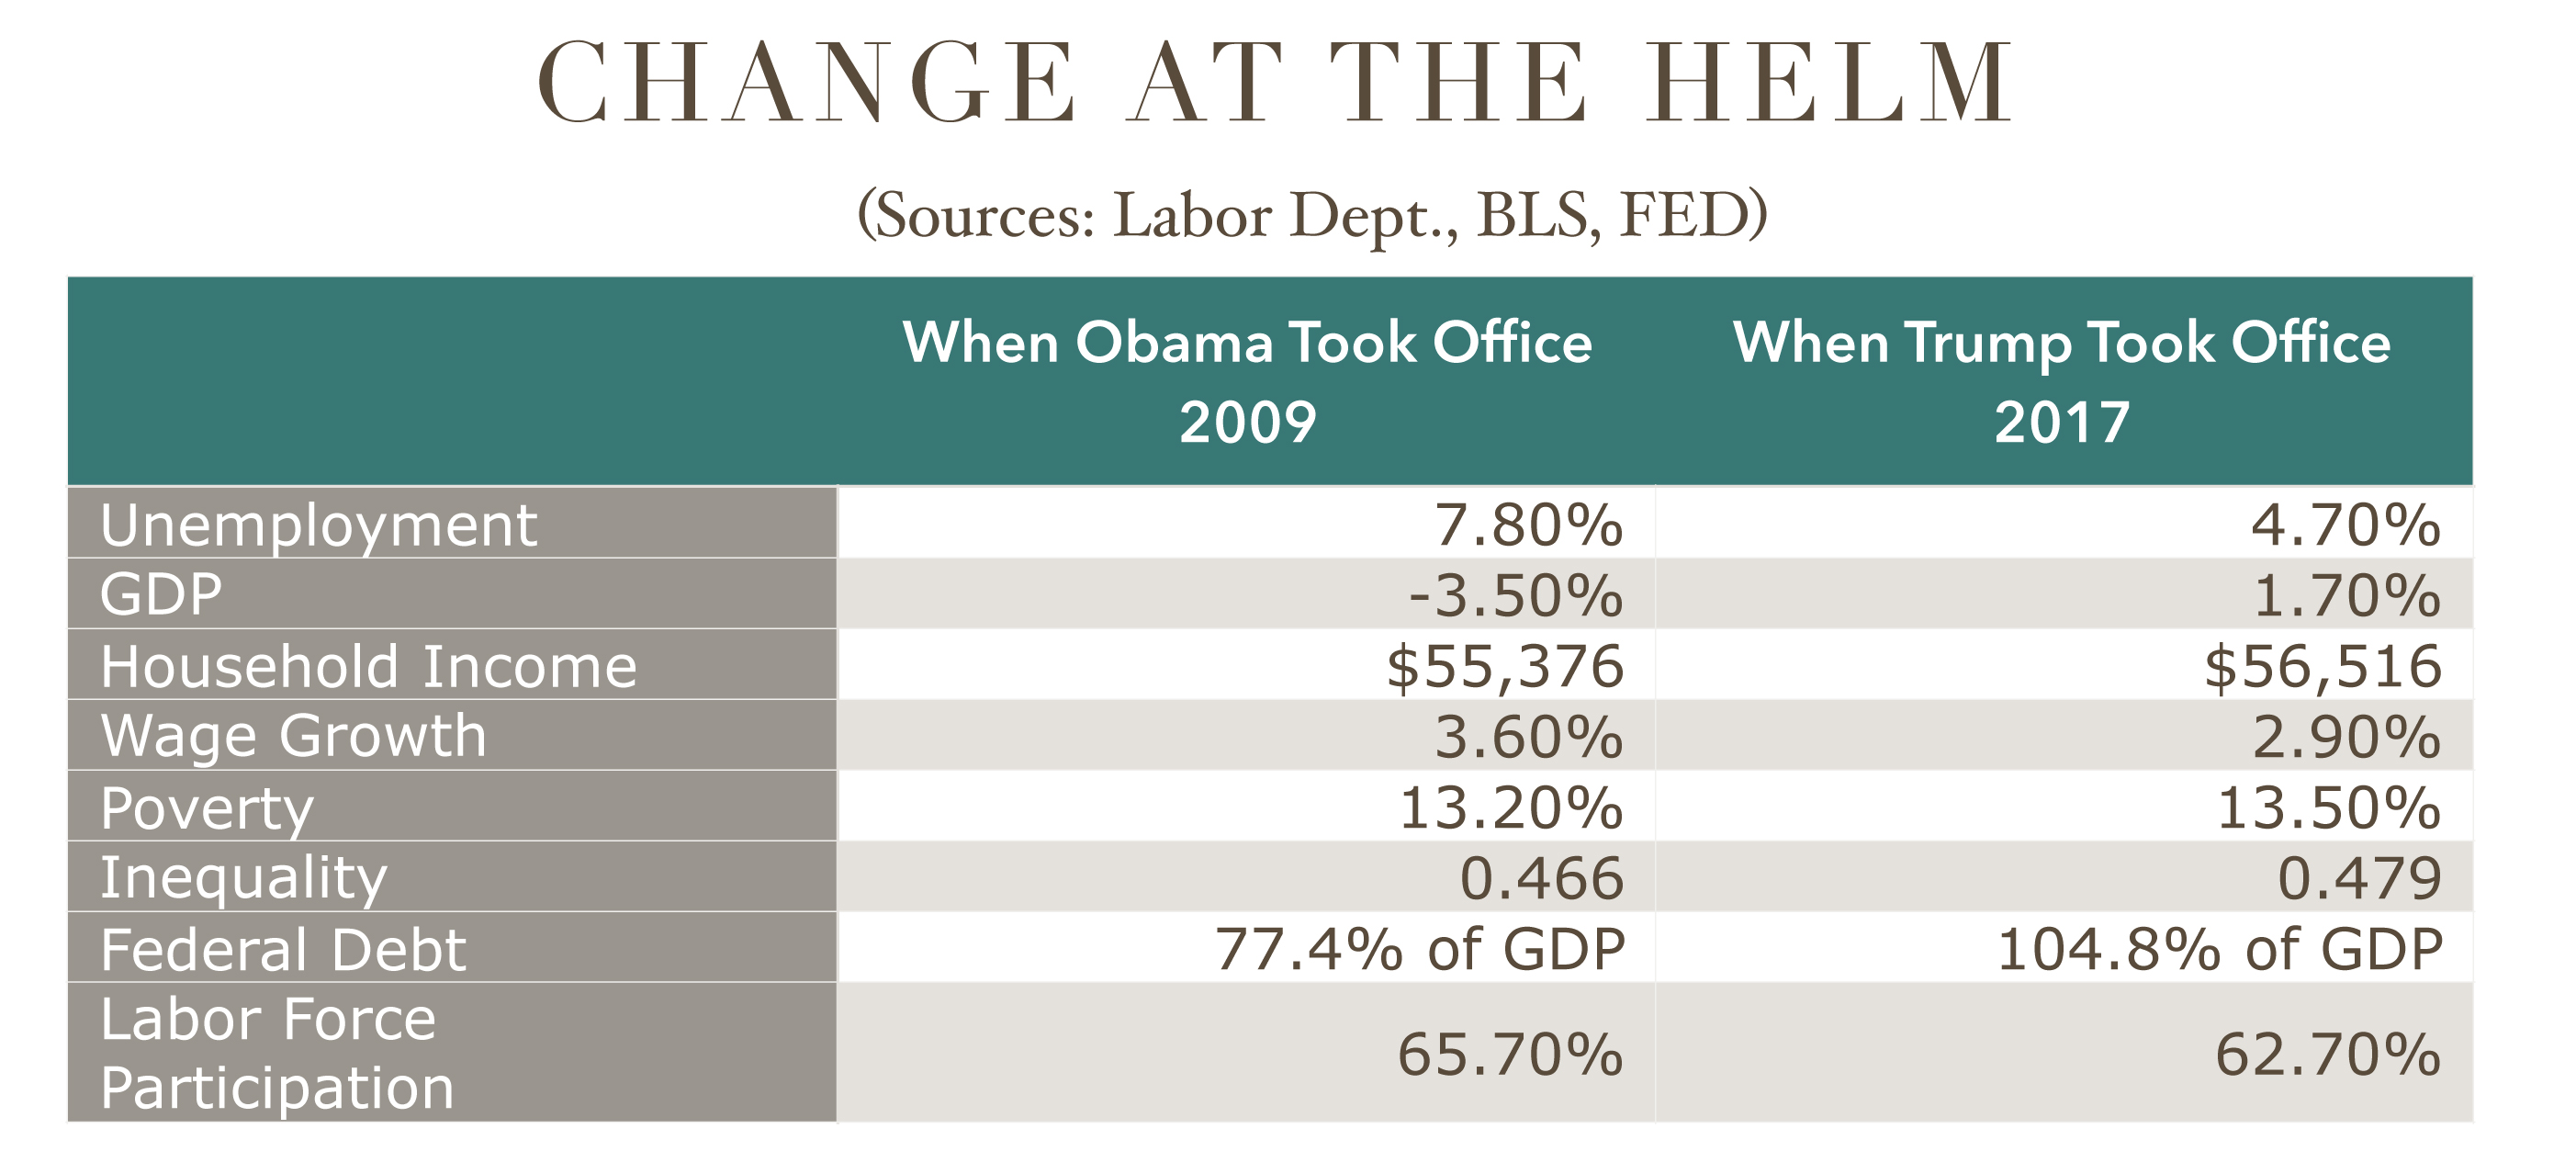
Unemployment stood at 7.8% in 2009, and fell to 4.7% by the time President Trump took office. Yet average annual household income remained stagnant for eight years, increasing a dismal $1,140 per year from $55,376 to $56,516, resulting in a drop of wage growth from 3.6% per year to 2.9% per year.

 
GDP Growth Lackluster for 8 Years

Change at the Helm Continued…

The economic environment that President Trump assumed requires assistance from the administration to garner any fundamental improvement. GDP stood at 1.7% when Trump took office on January 20, 2017, lagging due to minimal capital investing by companies.

The one item that may continue to offer headwinds is the amount of debt as a percentage of GDP. The increase in Federal debt from 77.4% of GDP to 104.8% of GDP can be alleviated with an increase in GDP, since Federal debt is expected to rise under Trump’s fiscal policies.


Why GDP Growth Was Lackluster For 8 Years – Domestic Economy

A key component of GDP growth has been lagging for years, as a lack of incentives for companies to invest in capital has been an issue.

Many believe that economic growth since the financial crisis in 2008/2009 has been driven primarily by the monetary stimulus efforts enacted by the Federal Reserve. The Quantitative Easing programs, aka Q.E. 1 & Q.E. 2, provided tremendous liquidity for nearly eight years as the Fed bought debt and placed it on its balance sheet.

The problem is that what the Fed did was considered a form of “artificial stimulus”. Rather than investing in capital equipment for long-term economic growth, companies instead borrowed money at historically low rates via issuing debt, then bought back a portion of their stock. This in turn helped send stock prices higher without any tangible economic growth strategy in place. As this transpired, GDP growth lagged and companies basically became complacent with anemic rates of growth. (Source: BLS)


What The U.S. Imports From Mexico


What The U.S. Imports From Mexico – Trade Overview

The Trump administration has proposed a 20% tariff on imported products from Mexico in order to better balance the trade deficit with the country. Some argue that imposing such a tariff would make certain imported products more expensive for American consumers.

The U.S. imported over $21 billion worth of vehicles from Mexico in 2016, with auto parts accounting for the single largest type of product imported from Mexico valued at over $51 billion in 2016, making the automotive industry an integral component of trade with Mexico. Interestingly enough, exports headed from the U.S. to Mexico are primarily for use in the automotive industry, with machinery, fuels, and plastics making up the largest portions.

Agricultural and food products imported from Mexico, such as tomatoes and beer, totaled over $21 billion in 2015, the most recent data available. (Sources: Dept. of Commerce, BLS)