Ocean Park Capital Management

2503 Main Street

Santa Monica, CA 90405

Main: 310.392.7300

Daily Performance Line:  310.281.8577

January 2017 Results
Market Update
(all values as of 03.31.2023)

Stock Indices:

Dow Jones 33,274
S&P 500 4,109
Nasdaq 12,221

Bond Sector Yields:

2 Yr Treasury 4.06%
10 Yr Treasury 3.48%
10 Yr Municipal 2.11%
High Yield 8.31%

YTD Market Returns:

Dow Jones 0.38%
S&P 500 7.03%
Nasdaq 16.77%
MSCI-EAFE 7.65%
MSCI-Europe 9.89%
MSCI-Pacific 3.61%
MSCI-Emg Mkt 3.55%
 
US Agg Bond 2.95%
US Corp Bond 3.50%
US Gov’t Bond 3.16%

Commodity Prices:

Gold 1,977
Silver 24.01
Oil (WTI) 80.60

Currencies:

Dollar / Euro 1.08
Dollar / Pound 1.23
Yen / Dollar 132.60
Canadian /Dollar 0.73

Fund Overview

Equities continued to rally in January, with the major indices and the Ocean Park funds posting substantial gains.  Outperformance in our consumer and technology stocks, particularly in the so-called FANG quartet (Facebook, Amazon, Netflix, and Google) bolstered our results.

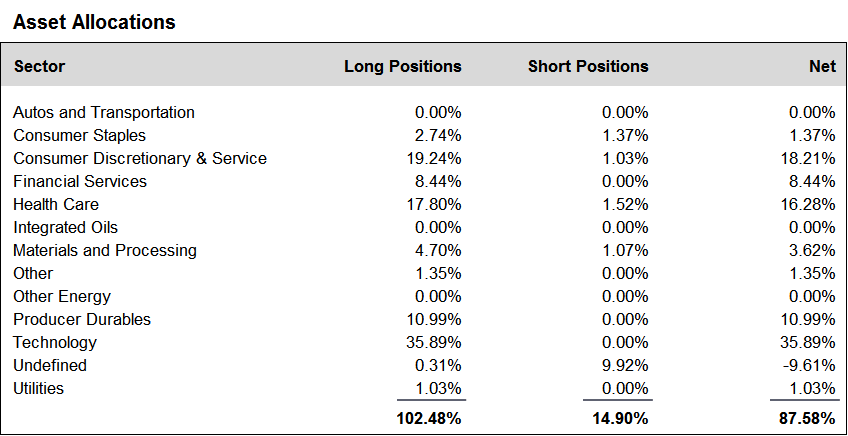
During the month, we increased positions in the financial services, health care and producer durables sectors and decreased positions in the technology sector.  To maintain balance in the portfolio, we also initiated a significant hedging position by shorting SPYs and QQQs, which appears in the Undefined category in the asset allocation chart.  We finished the month at about 88% net long, unchanged from the end of December.

A schedule showing the performance of the Investors Fund is included below, along with our Asset Allocation Chart. Daily updates on our activity are available on our Results Line, at
310-281-8577, and current information is also maintained on our website at www.oceanparkcapital.com. To gain access to the site enter password opcap.


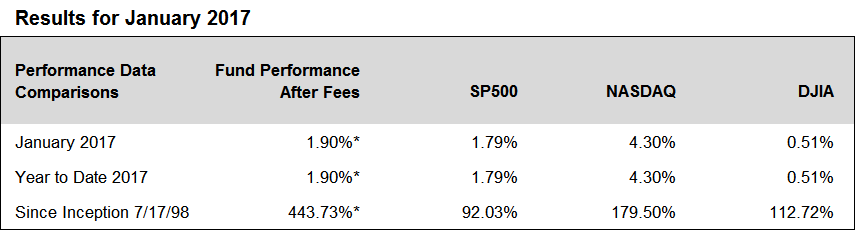
*These results are pro forma.  Actual results for most investors will vary.  See additional disclosures on page 4.
Past performance does not guarantee future results.

 
January 2017 - Equity Overview

Equity Overview

The major indices reached new highs in January, with the Dow Jones Industrial Average passing the milestone level of 20,000.   Small business optimism showed an increase of 7.5%, rising to its fifth highest level in over 40 years.  The gains reflected a change in sentiment as the markets reacted positively to the anti-regulatory stance of the new administration.    However, market volatility also rose, as many of the details of that stance remain unknown.

As 4th quarter earnings reports progressed in January, market gains began to moderate.  On the positive side, at month’s end the blended growth rate for 4th quarter S&P 500 earnings was 4.6%, significantly higher than the 3.1% projected at the end of December.  And, with 55% of S&P 500 companies reporting, 65% beat consensus earnings estimates and 52% beat consensus revenue estimates.  On the other hand, the earnings beat rate was below the one-year average of 71% and the revenue beat rate was only in line with the one-year average.  And the average earnings beat was 2.5% above expectations, compared with the one-year average of 4.4%.  However these results are incomplete as almost half of the S&P 500 companies were yet to report.


January 2017 - Macro Overview


Macro Overview

Anticipation of changes by the new administration provided the backdrop to market action in January.

Among the administration’s first actions were executive orders designed to reverse Obama-era policies.  These included the withdrawal of the U.S. from the Trans-Pacific Partnership trade agreement, an increase in border parameters with Mexico, and approval of two highly contested oil pipeline projects (the Keystone Pipeline and the Dakota Access pipeline).   Also included was a far-reaching immigration ban which was quickly halted by the courts.

While the president can implement some policy changes through executive order, substantive fiscal initiatives such as tax cuts and tax reform will need Congressional approval.  And, although the new treasury secretary has set August of this year for congressional passage of tax reform, most analysts believe that deadline is unrealistic.

For example, among the tax changes under consideration is the so-called border adjustment tax, which would benefit exporters but would impose significant new costs for companies importing goods from abroad.  Because importers and exporters each comprise major and competing elements of the economy, congressional approval of such a bill will be difficult.

Similarly, changes to the Affordable Care Act, which the president and Republicans suggested during the campaign could be accomplished immediately, are proving somewhat more difficult to achieve.  As the president remarked, “Nobody knew that health care could be so complicated.”

Pharmaceutical companies, already in the spotlight, became more of a target as the president met with drug makers to encourage lower prices and more U.S.-based manufacturing.

Brexit hit a stumbling block in January as the highest court in the U.K. ruled that Prime Minister Theresa May must seek parliamentary approval before negotiating Britain’s departure from the European Union.

Continuing strength in the dollar is creating headwinds for U.S. multinationals which generate a large portion of their earnings from overseas sales.  A weaker dollar would be beneficial to U.S. exporters making their products less expensive internationally.


January 2017 - Additional Disclosures


 Additional Disclosures

Performance data for OPI reflect the reinvestment of dividends and other earnings on the fund’s assets.  Performance data for the major indices reflect only changes in the value of those indices, and would be higher if dividends were included. However, the index data do not reflect fees that would be paid to index fund managers and transaction costs that would be incurred when their component stocks are bought or sold, while OPI’s data do reflect quarterly fees and expenses incurred by the fund.  The information provided is believed to be reliable, but its accuracy or completeness is not warranted. This material is not intended as an offer or solicitation for the purchase or sale of any stock, bond, mutual fund, or any other financial instrument. The views and strategies discussed herein may not be appropriate and/or suitable for all investors. This material is meant solely for informational purposes, and is not intended to suffice as any type of accounting, legal, tax, or estate planning advice. Any and all forecasts mentioned are for illustrative purposes only and should not be interpreted as investment recommendations.