Dow Jones | 33,274 |
S&P 500 | 4,109 |
Nasdaq | 12,221 |
2 Yr Treasury | 4.06% |
10 Yr Treasury | 3.48% |
10 Yr Municipal | 2.11% |
High Yield | 8.31% |
Dow Jones | 0.38% |
S&P 500 | 7.03% |
Nasdaq | 16.77% |
MSCI-EAFE | 7.65% |
MSCI-Europe | 9.89% |
MSCI-Pacific | 3.61% |
MSCI-Emg Mkt | 3.55% |
US Agg Bond | 2.95% |
US Corp Bond | 3.50% |
US Gov’t Bond | 3.16% |
Gold | 1,977 |
Silver | 24.01 |
Oil (WTI) | 80.60 |
Dollar / Euro | 1.08 |
Dollar / Pound | 1.23 |
Yen / Dollar | 132.60 |
Canadian /Dollar | 0.73 |
Macro Overview
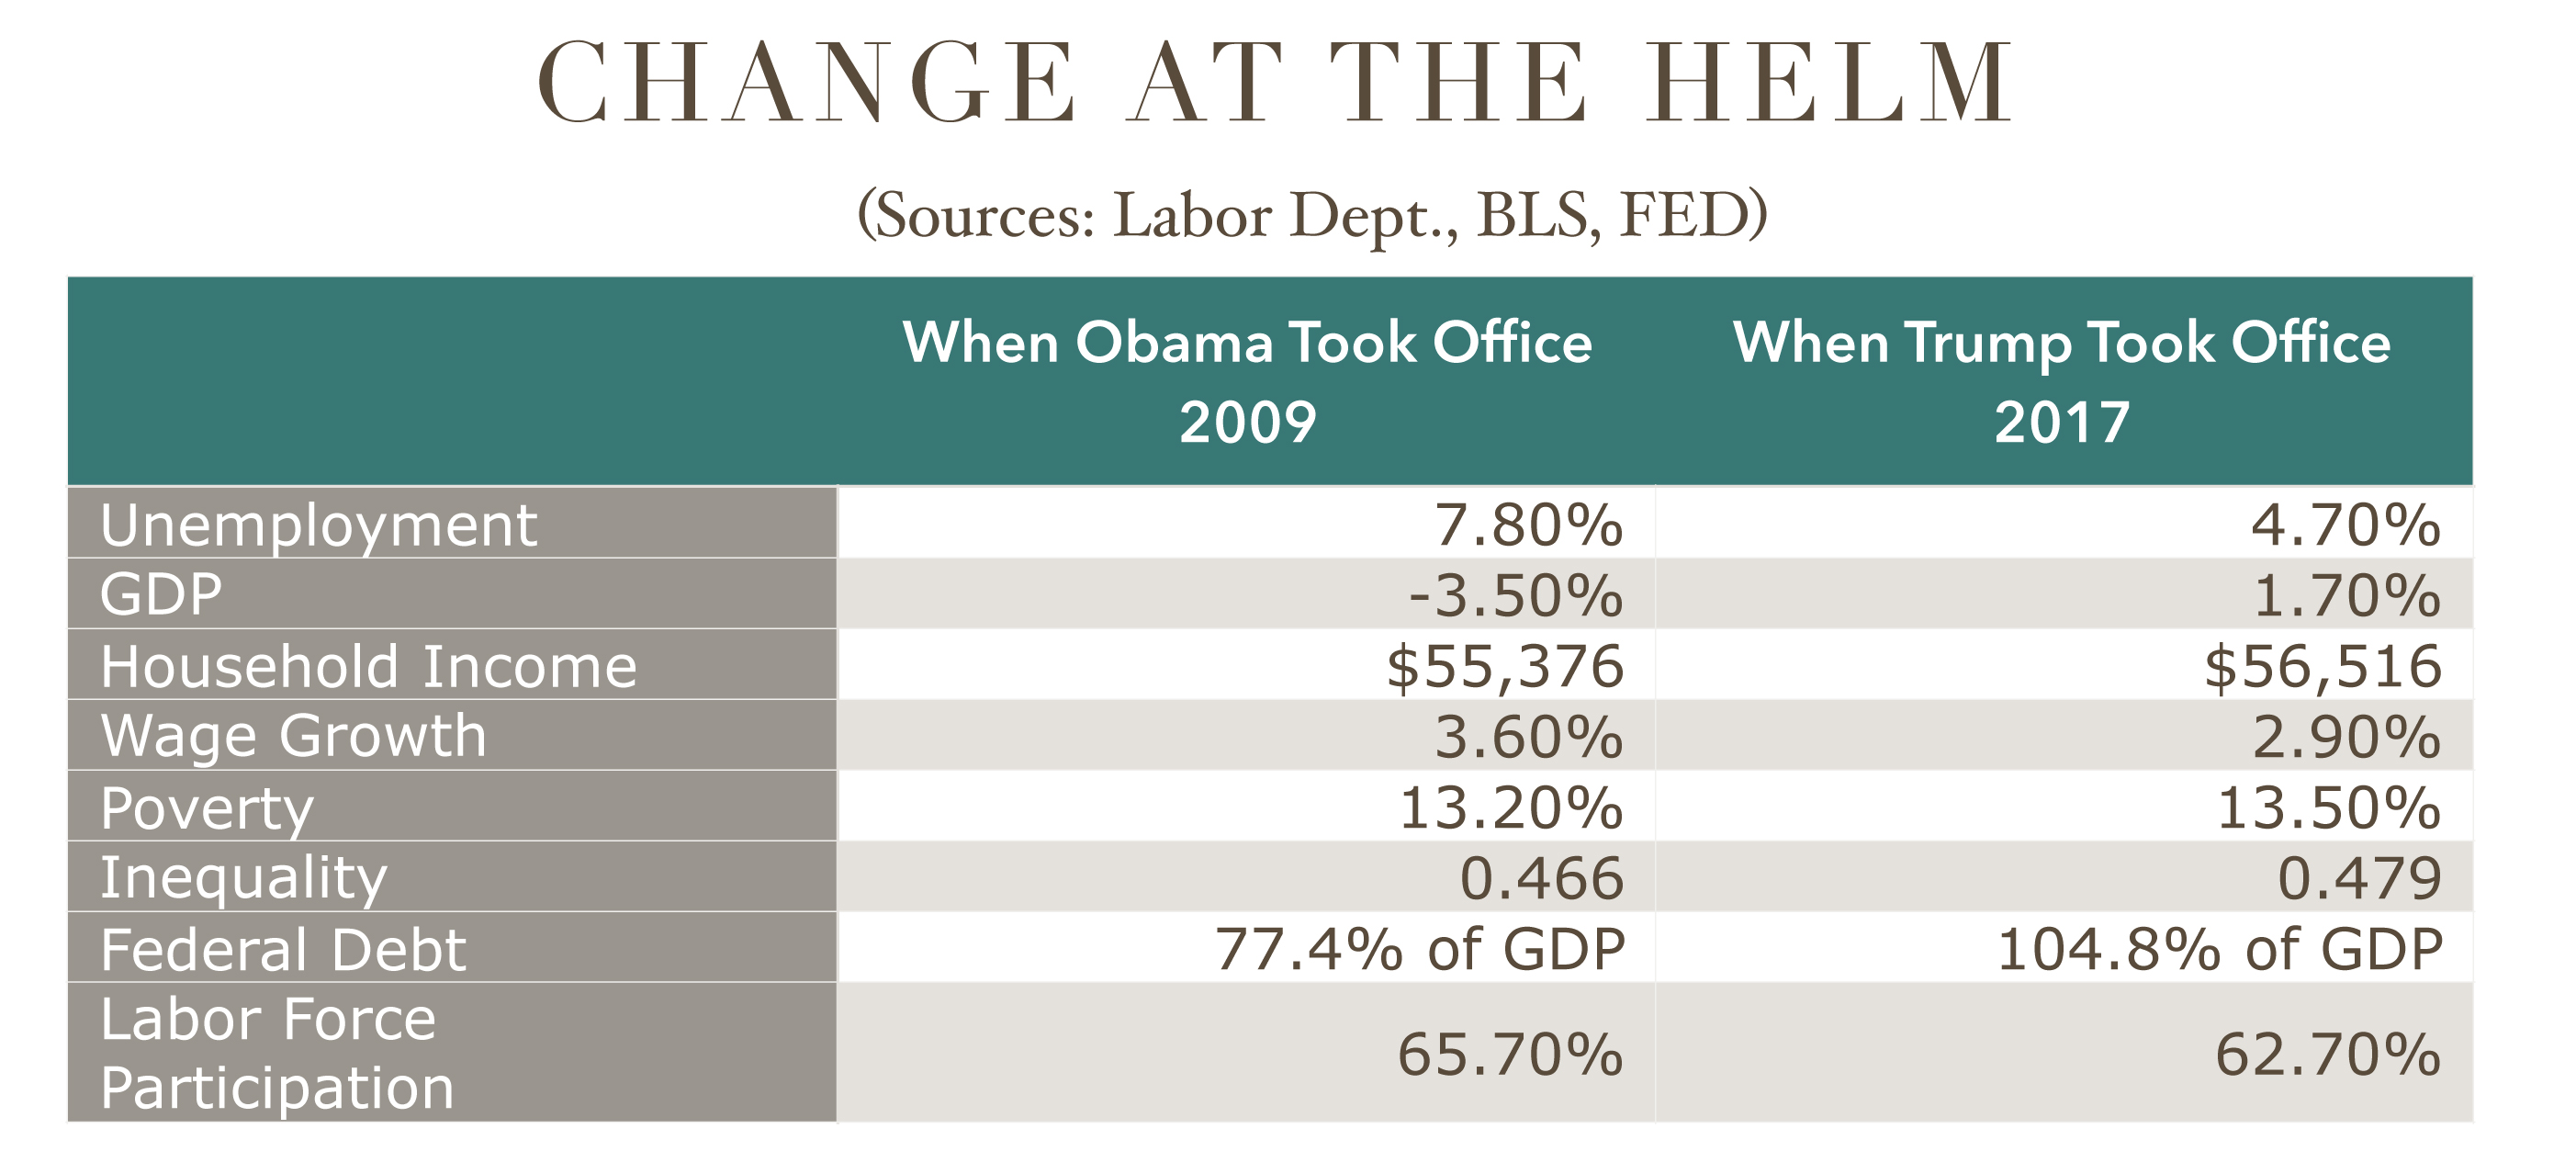
A change in sentiment was prevalent throughout the markets as new rules and regulatory reversals began to take effect. Volatility rose as markets tried to discern President Trump’s policies.
Equity markets propelled to new highs in January as optimism fueled U.S. equities, sending the Dow Jones Industrial Average to a new milestone level of 20,000. The S&P 500 Index and the Nasdaq Composite Index also reached new highs during the month.
Executive orders undertaken by the President were able to derail several rules signed into law by the Obama administration, yet fiscal policy initiatives proposed by President Trump such as tax cuts and tax reform need Congressional approval. The Congressional Review Act (CRA) will allow the Republican led Congress to reverse a number of regulations enacted by the prior administration.
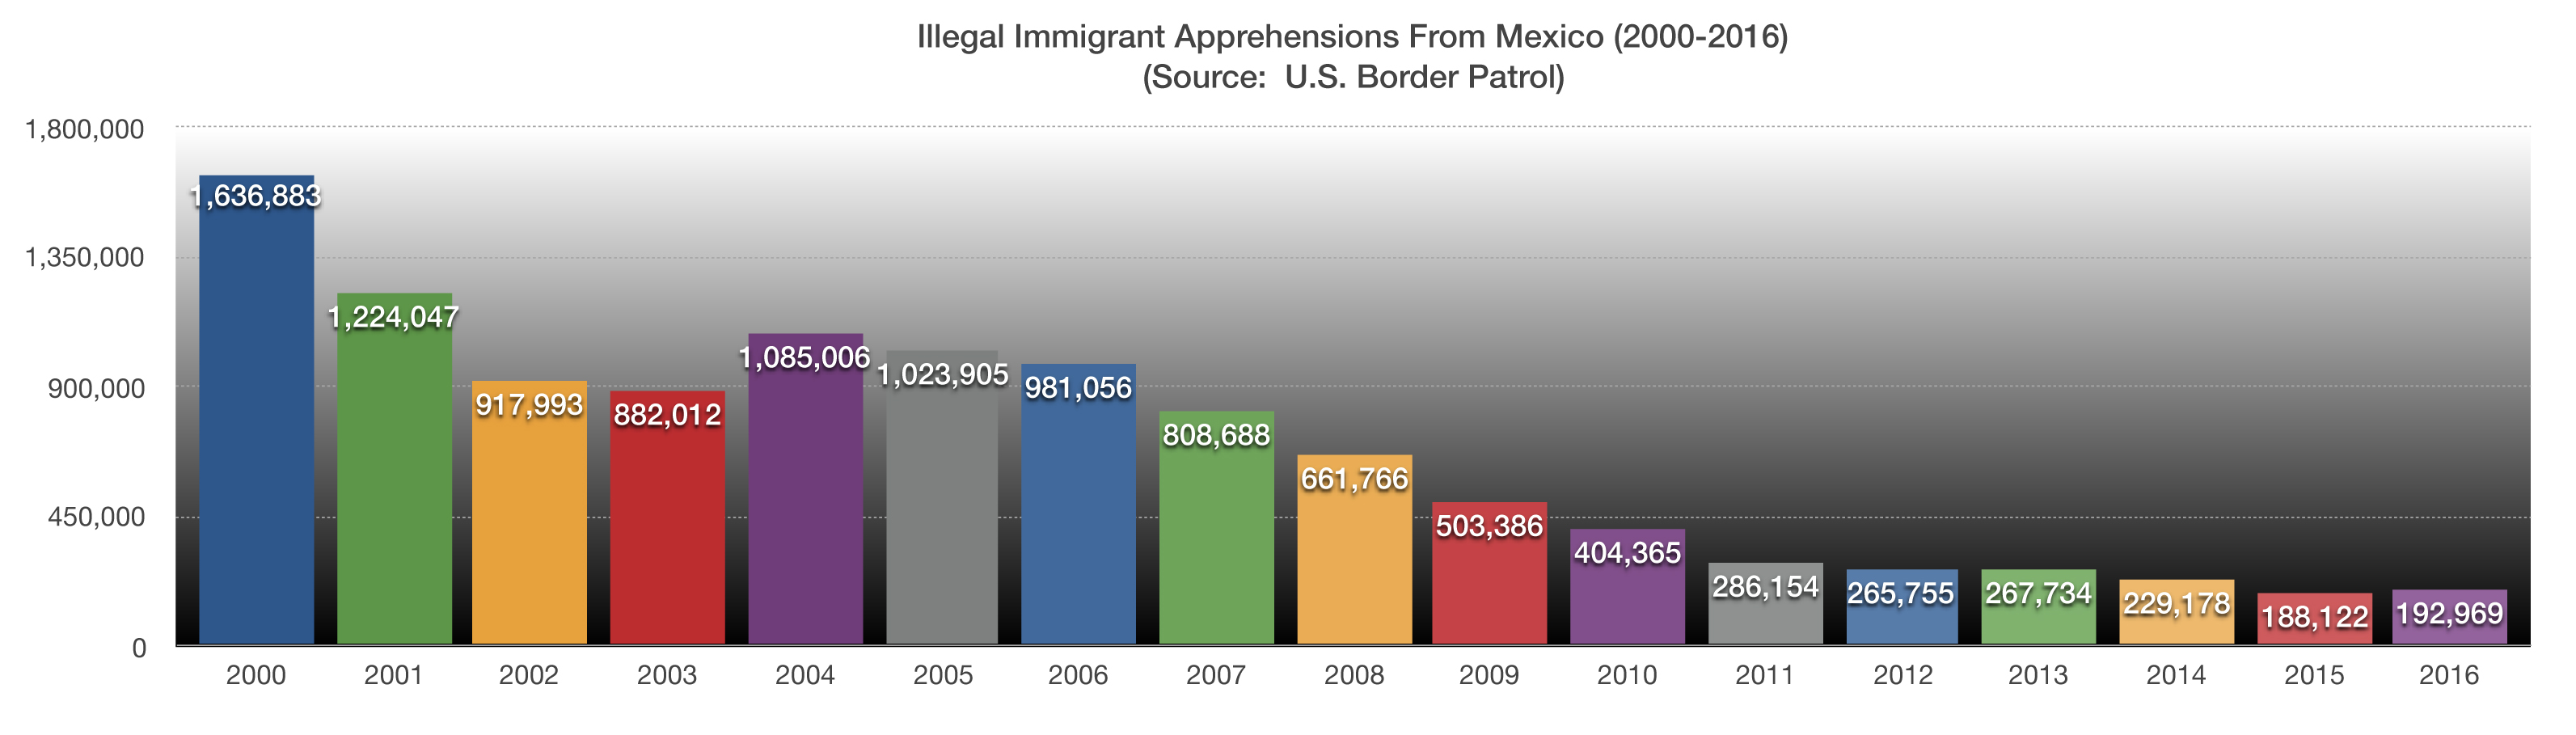
Among President Trump’s first actions as president was to withdraw the U.S. from the Trans-Pacific Partnership, strengthen border parameters with Mexico and temporarily disallow certain immigrants from entering the U.S. Two highly contested oil pipeline projects were granted the ability to advance, the Keystone Pipeline and the Dakota Access pipeline.
Pharmaceutical companies became a Presidential target, as President Trump approached drug makers to lower their prices and manufacture their products in the U.S. The President’s agenda of repealing portions of the Affordable Care Act may also affect premium and medical costs.
Fiscal concepts presented by the President may encourage companies with ample cash to invest in capital rather than buying back their own stock or issuing heftier dividend payouts. A lagging key component of GDP has been capital spending.
The National Federation of Independent Business released their survey of small business optimism, which soared 7.5% to its fifth highest level in over 40 years of survey results. (Sources: Fed, NFIB, Dow Jones, S&P)
Increase In Bond Yields Stall – Fixed Income Update
Demand for bonds increased towards the end of January following a pull back in equities. The rise in bond demand brought bond yields lower from their elevated levels earlier in the month. An inverse relationship exists with bonds, as bond prices rise, bond yields fall.
Analysts believe that the anticipation of increased infrastructure spending and government borrowing might lead to a significant boost in Treasury borrowing, which could push up borrowing costs for the government in the form of higher interest rates.
Remarks by Fed Chairperson Janet Yellen signaled that the Fed intends to increase rates throughout 2017, contingent on economic and employment growth. Janet Yellen’s term as Fed chief ends in June 2018, allowing the President to appoint a new Fed boss then. (Sources: Federal Reserve, Bloomberg)
Dow Jones Reaches 20,000 – Domestic Equity Update
The Dow Jones Industrial Average hit the milestone 20,000 mark in January. The 120-year old index took 103 years to reach 10,000 in March 1999, then another 18 years to reach 20,000 in January 2017. The move from 19,000 to 20,000 took just 42 trading days, the second quickest 1,000 point gain in history for the index. The single fastest 1,000 gain occurred during the dot com boom in 1999 when the index jumped from 10,000 to 11,000 in only 24 days. Two other notable equity indices also reached new highs in January, the S&P 500 and the Nasdaq.
Equity markets pulled back at the end of January as uncertainty surrounding various administrative policies and some disappointing corporate earnings fueled a retraction of major indices. Earnings were mixed in January as earnings were reported for various companies across different sectors.
A common complaint about stock market growth has been the fact that most companies found it easier to simply issue debt at low interest rates and buy back their own stock, rather than investing in capital with the constant tide of regulatory resistance discouraging expenditures. (Sources: Dow Jones, S&P)
Homes Become Less Affordable As Rates Move Up – Housing Market
The recent rise in rates has led to a drop in the Housing Affordability Index as tracked by the Federal Reserve. Both existing and new home sales slowed towards the end of 2016 as a rise in rates pushed mortgage rates higher. Rising interest rates tend to increase the cost factor when purchasing a home with a mortgage loan.
The two most feasible methods of raising the Affordability Index is by either having an increase in wages or by having a drop in housing prices. Historically, home prices tend to fall much faster than wages rise, since pay raises take time.
The Housing Affordability Index is negatively correlated to the 10-year Treasury Bond yield, meaning that as yields rise, the Affordability Index declines. (Source: St Louis Federal Reserve Bank)
Change At The Helm – Market Fact
When President Obama assumed the presidency on January 20, 2009, the financial markets were in the midst of turmoil and tremendous uncertainty. Economic growth and prosperity had reversed from earlier years of expansion during the 2000’s.
Unemployment stood at 7.8% in 2009, and fell to 4.7% by the time President Trump took office. Yet average annual household income remained stagnant for eight years, increasing a dismal $1,140 per year from $55,376 to $56,516, resulting in a drop of wage growth from 3.6% per year to 2.9% per year.
The economic environment that President Trump assumed requires assistance from the administration to garner any fundamental improvement. GDP stood at 1.7% when Trump took office on January 20, 2017, lagging due to minimal capital investing by companies.
The one item that may continue to offer headwinds is the amount of debt as a percentage of GDP. The increase in Federal debt from 77.4% of GDP to 104.8% of GDP can be alleviated with an increase in GDP, since Federal debt is expected to rise under Trump’s fiscal policies. (Sources: BLS, Labor Dept, Federal Reserve)
International Markets React – International Update
Markets throughout the world reacted to the various orders and actions executed by President Trump with caution, meaning that foreign companies and governments need time to see how such proposals would unfold.
The dollar’s strength continues to weigh on emerging markets that essentially compete with the dollar in attracting capital. The euro staged a minor comeback at the end of January as Brexit became more of a challenge when the highest court in the U.K. ruled that Prime Minister Theresa May must seek a parliamentary vote in order to continue on with exiting the EU. Britain’s expected exit from the EU has devalued the British pound since the passage of the vote to exit the EU.
Asian markets were in a quandary as the U.S. withdrew from the Trans-Pacific Partnership (TPP), a free trade agreement among 12 countries (including the U.S.) signed in 2016. Comprised mostly of Asian countries, the TPP excludes China and consists of countries bordering the Pacific Ocean. (Sources: EuroStat)
Largest Trade Deficits With U.S. By Country – International Trade
The United States has provided a tremendous consumer market for countries all over the world, with an abundance of products imported from a variety of areas.
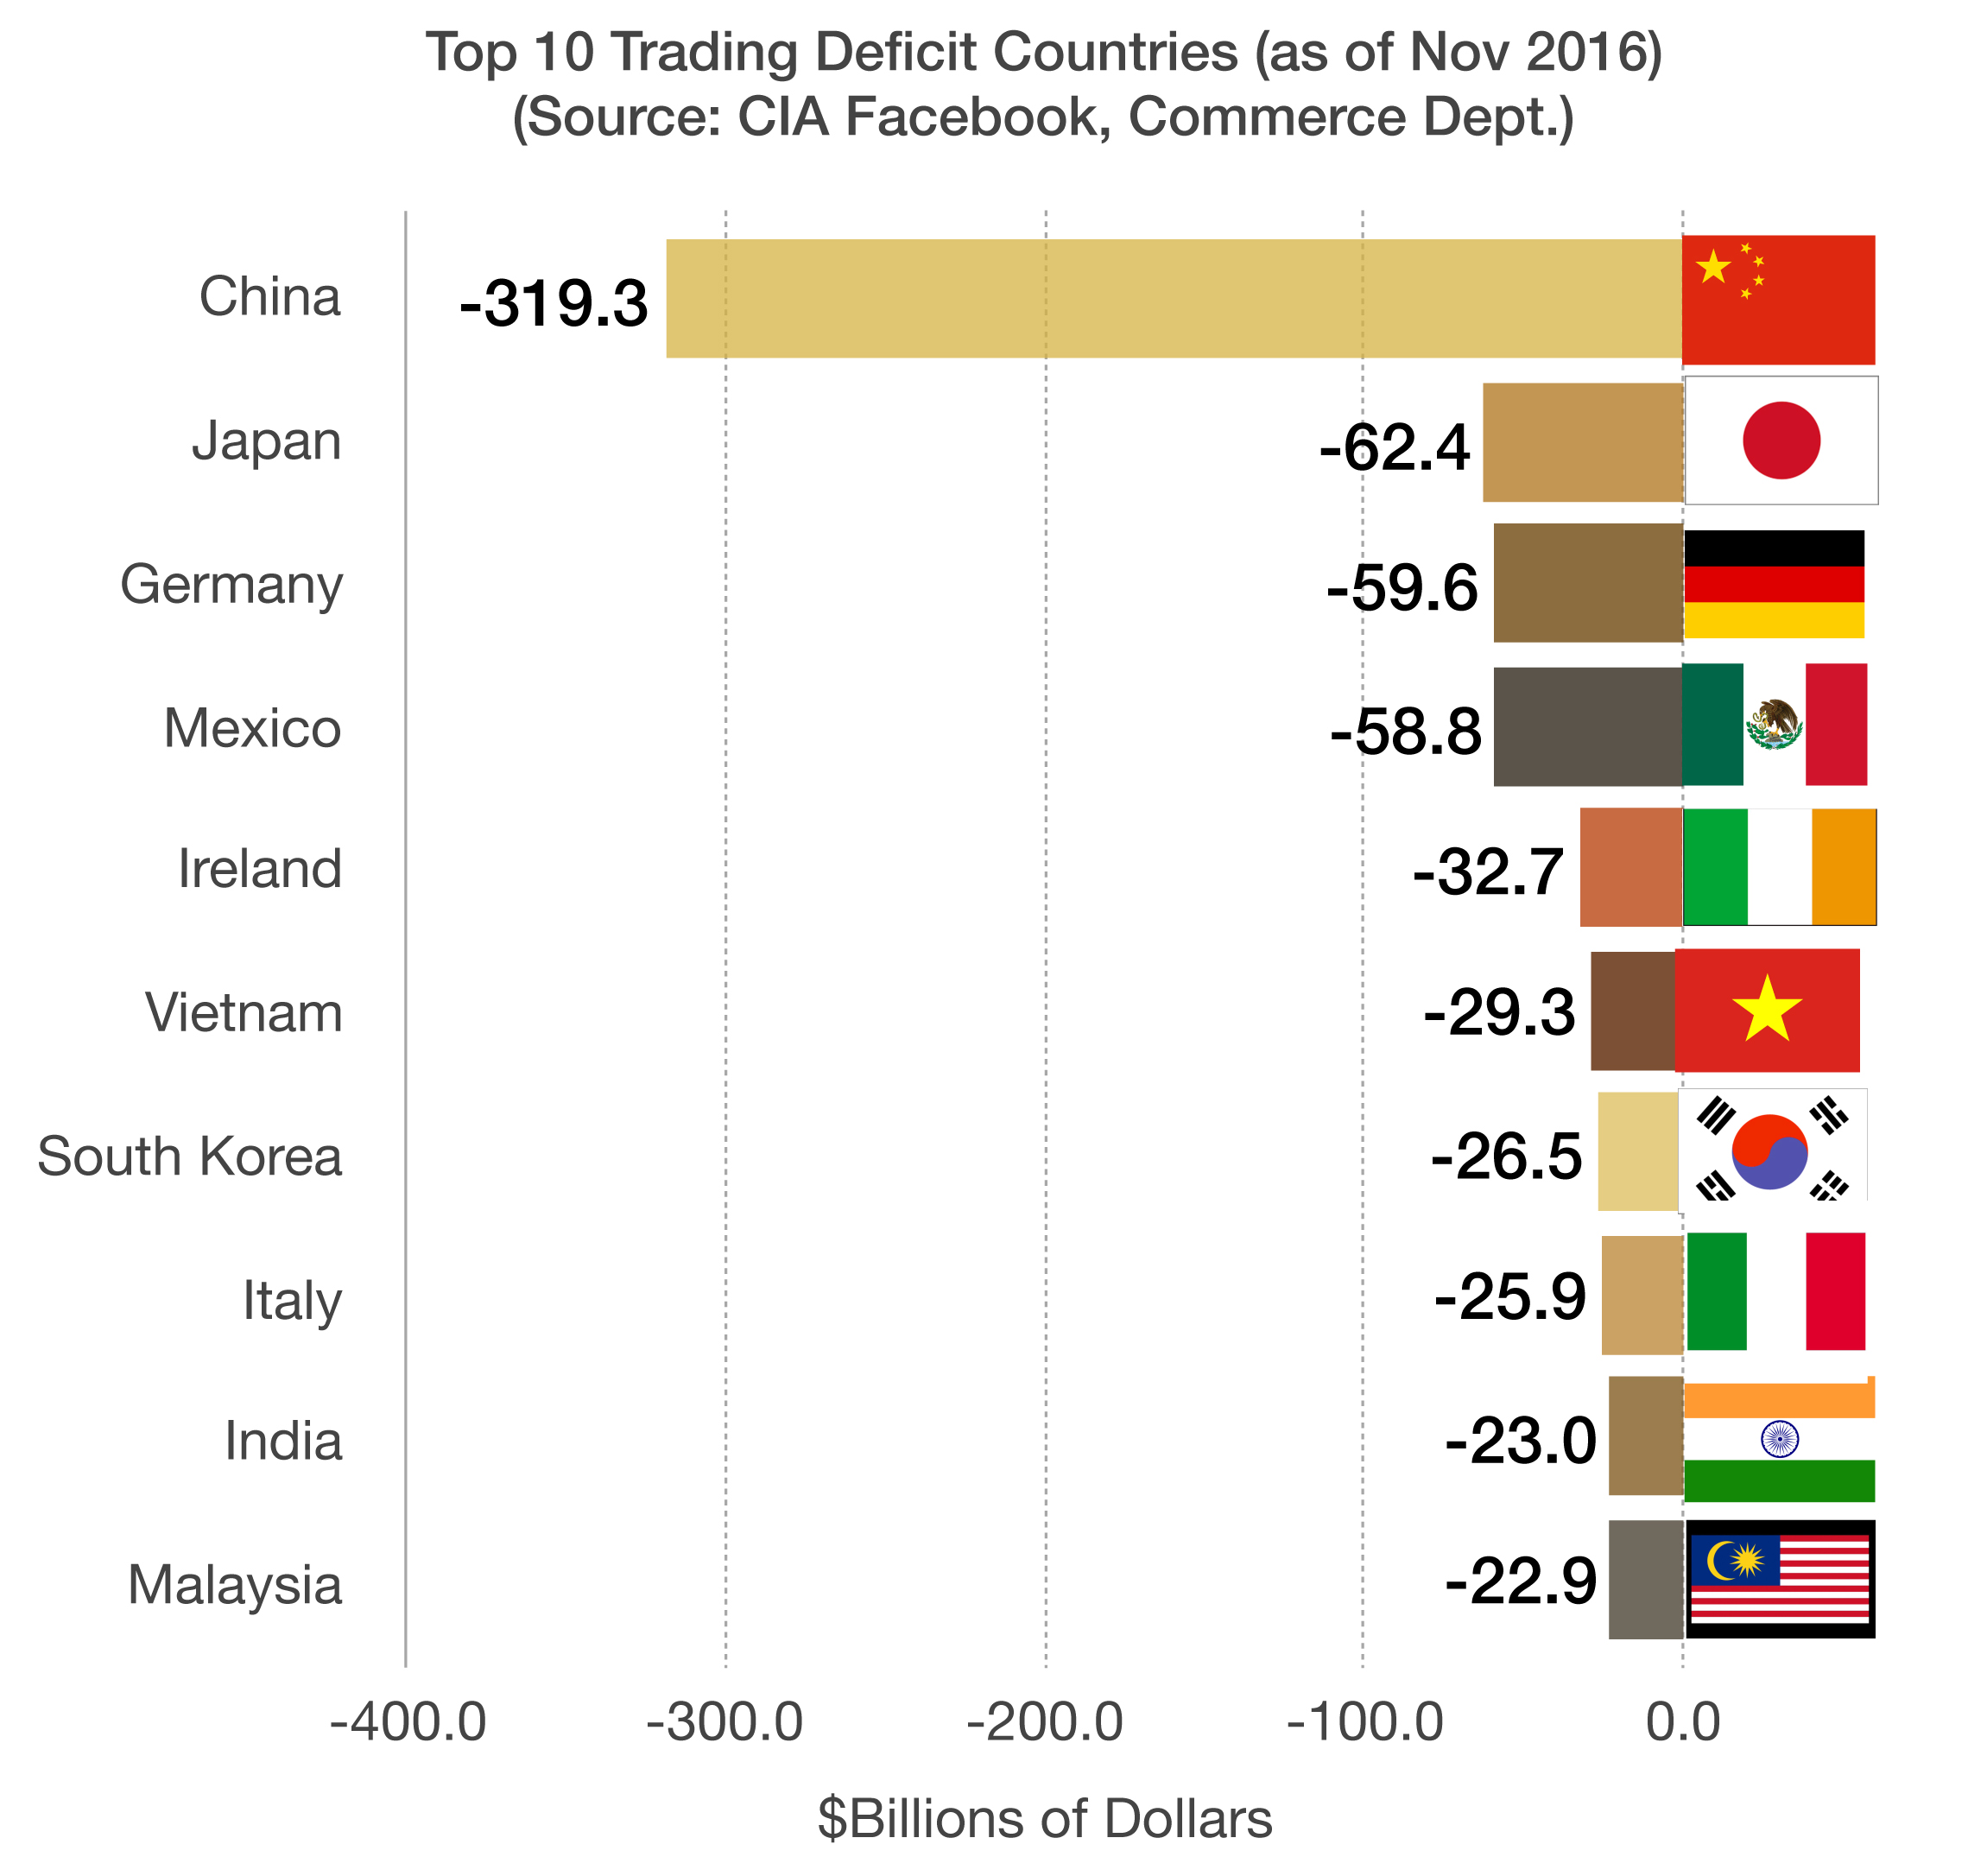
Growing U.S. consumer demand over the decades along with advanced electronic manufacturing facilities in China and throughout Asia have given American consumers cheap products. Ambitious consumer behavior has created a trade deficit with China of over $319 billion dollars, followed by smaller deficits with Japan, Germany and Mexico.
The current deficits with Japan and Germany are primarily comprised of automobiles and machinery, while the deficit with China mostly consists of electronics.
Appreciation of the U.S. dollar versus other major currencies has made foreign products relatively cheap for American consumers, including automobiles, computers, and televisions. (Source: CIA Factbook)
How Many Immigrants Actually Get Caught At The Border – Demographics
The struggle to maintain and enforce the protection of U.S. borders from illegal immigration has been an ongoing task for years. As the U.S. continues to be a safe haven for people fleeing countries with corruption and chaos, U.S. borders from Canada to Mexico and from the West Coast to the East Coast are bombarded consistently.
Numerous smaller port of entries exist along the U.S. parameter, ranging from Spokane, Washington, to Buffalo, New York, yet nearly half of all immigrant apprehensions are along the Mexican border.
Some argue that the onset of NAFTA in the early 1990’s along with numerous jobs created south of the border, have actually stemmed the flight of immigrants crossing the border with Mexico. Others argue that it’s not that there are fewer arrests, it’s that there are more illegal immigrants actually crossing and making it to the U.S. (Source): U.S. Border Patrol)
You’re starting to hear people talk about “if” there’s a bear market during the Trump Administration, when the real truth is they should be talking about “when.” And it won’t necessarily be triggered by a poorly-worded tweet, a global-trade-stopping new tariff regime or tax and entitlement reform. Every presidential cycle has its share of market drawdowns, seemingly regardless of presidential policies.
You don’t believe it? The accompanying chart shows the worst stock market drawdowns for every president since Herbert Hoover in the 1930s, and you can see that good president or bad, Republican or Democrat, they all eventually experienced significant down markets. Some might be surprised to see Ronald Reagan’s 25% and 33% drop from high to low, or the nearly 52% drawdown experienced during George W. Bush’s presidency. Weren’t these pro-business Presidents?
What the chart doesn’t show, but you know already, is that after every single one of these scary drops, the markets recovered to post new highs, which we’re experiencing today. So don’t listen to anybody who talks about “if” the markets are eventually going to go down sometime in the next four years. We’re going to experience a bear market—time, date, duration and extent unknown. And then, if history is any indication, we’ll see new highs again eventually.
Source:
Over the last few weeks, professional financial planners have been fielding calls from clients who are asking the kinds of questions that every professional investor hates to hear. The Dow has reached (and then fallen back below) 20,000. Should I take money off the table?
My preferred candidate didn’t win the election, and I think the world is going to hell in a handbasket. Don’t you think I should sell my stocks now before it’s too late?
The first question is the easier one to answer. It seems to be human nature to have a strange fascination with round numbers. Why should Dow 20,000 be any different, from a pure investing standpoint, than Dow 19,774.83 or Dow 20,093.65? The questions about this magic number become even sillier when you realize that the Dow is made up of just 30 out of many thousands of American-based companies.
As to the second question, the real issue is the eternal question: what’s coming next in the markets? The only truthful answer to that question, however it’s phrased, is: we don’t know. As investors, we need to take that answer very seriously.
After President Obama was elected, financial planners were fielding questions from their angry and frightened conservative clients, who were asking to bail on their stock portfolios in anticipation of the country going to hell in a handbasket. But ask yourself: how did that work out? Those investors would have missed the longest running bull market in memory.
Then, for the last five years at least, the experts were certain that bond rates were just about to rise dramatically, and many professional investors stayed ultra-short to avoid the losses. How did that work out? Bonds stayed where they were for five more years, and those investors missed out on percentage points of additional yield.
For the last four years at least, people have been saying that the current bull market is long in the tooth, what with the markets testing new highs. Over and over they felt like it was a good time to take their winnings off the table. How did that work out? They would have bailed before the markets repeatedly broke record highs.
So now we have a situation where the other half of the country is still reeling from the election results and predicting that the country is going to hell in a handbasket. Advisors are doing everything they can to keep clients from acting emotionally rather than rationally.
The rational way to frame the question about taking money off the table is: can you afford to lose some percentage of your assets—and that percentage figure depends on how aggressive is your asset allocation—before the markets recover? Will you have time to recover?
If you’re decumulating in retirement, or just approaching retirement, that percentage you can afford to lose will be lower than it would be for a millennial investor or somebody late in retirement. Whatever that amount is, you should look back historically, take a hard look at the darkest days for your particular mix of assets, and note the times it breached that floor. (Hint: check out early 2009.) Then see if you want to change your allocations to something more conservative.
If you CAN afford to dip down as far as your current portfolio would seem to allow, then you will inevitably be rewarded by new market highs at some point after the bear (and there will be a bear) is over. There will inevitably be a 100% swing in the markets, and you know with absolute certainty in which direction that will be.
People reach their peak decision-making abilities sometime in their 50s, and then decline slowly until after age 70, when the decline starts to take off more dramatically. This helps explain why sweepstakes frauds, Nigerian investment schemes and other scams target seniors and retirees.
What can you do to protect yourself—or your parents—from fraud and bad financial decisions? An article in NerdWallet suggests that parents and children can start by drafting powers of attorney, one for health care decisions and the other for financial decisions. This lists who the retirees want to speak for them in case they become incapacitated.
You can also simply the financial lives of aging parents, by consolidating the checking accounts at one bank, and the investments at a single advisor or brokerage account. If there are many credit cards, cut up all but two: one for daily purchases and one for automatic bill payment.
The adult children should also make a habit of communicating with their aging parents. Scam artists do their best work when their victims are isolated, without family and friends looking for signs of exploitation. A weekly visit might help you spot the variable annuity salesman who’s getting too friendly.
Some places to learn about the more creative elder fraud schemes include StopFraud.gov, AARP’s Fraud Watch Network and the IRS, which offers consumers alerts and an annual list of the “Dirty Dozen” top tax-related scams. Adult children can discuss common frauds, such as telephone imposters pretending to be IRS agents or Microsoft tech support.
Meanwhile, many financial institutions offer text or email alerts to notify their customers (and their advisors) of unusual account activity. People over 65 can have these automatically forwarded to an adult child who functions as an extra pair of eyes on what’s going on in the account.
For many older retirees, there comes a point when the financial issues become too complex and overwhelming. That’s the time to have a trusted successor or advisor take over the management of finances. The best advice here is: don’t resist giving up the day-to-day financial minutia. Experts report that most older Americans don’t recognize their gradual impairment, and often try to hang onto financial control beyond their capacity—and then hide the fact that they fell for a scam out of embarrassment until the next one comes along.
Source: