Ocean Park Capital Management

2503 Main Street

Santa Monica, CA 90405

Main: 310.392.7300

Daily Performance Line:  310.281.8577

January 2018
Market Update
(all values as of 06.28.2024)

Stock Indices:

Dow Jones 39,118
S&P 500 5,460
Nasdaq 17,732

Bond Sector Yields:

2 Yr Treasury 4.71%
10 Yr Treasury 4.36%
10 Yr Municipal 2.86%
High Yield 7.58%

YTD Market Returns:

Dow Jones 3.79%
S&P 500 14.48%
Nasdaq 18.13%
MSCI-EAFE 3.51%
MSCI-Europe 3.72%
MSCI-Pacific 3.05%
MSCI-Emg Mkt 6.11%
 
US Agg Bond -0.71%
US Corp Bond -0.49%
US Gov’t Bond -0.68%

Commodity Prices:

Gold 2,336
Silver 29.43
Oil (WTI) 81.46

Currencies:

Dollar / Euro 1.06
Dollar / Pound 1.26
Yen / Dollar 160.56
Canadian /Dollar 0.73

Fund Overview

Equities rallied strongly in January, with the major indices and the Ocean Park funds posting mid-single digit gains and reaching all-time highs.  The funds continue to outperform the HFRI Equity Hedge Index, which rose 3.04%.  Once again, consumer and technology stocks led the way.  Standouts included Amazon, Alphabet (a.k.a. Google), Netflix, and the semiconductor chipmaker Nvidia.

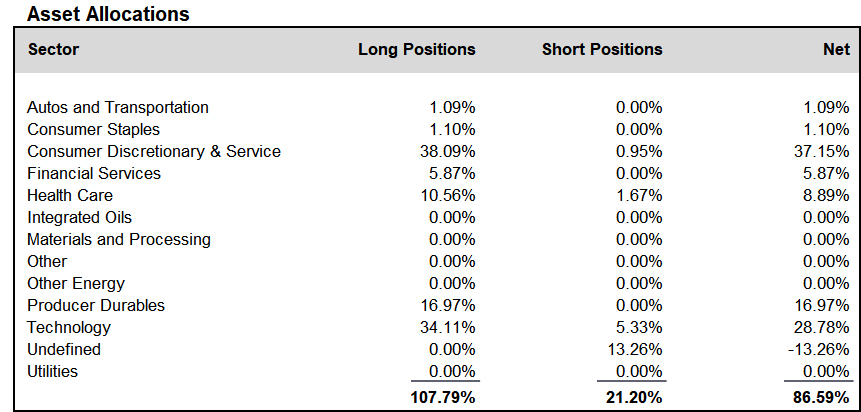
During the month, we added to positions in the consumer discretionary and service and financial services sectors, and reduced positions in the health care and producer durables sectors. We finished the month at about 87% net long, up from about 85% at the end of December.

A schedule showing the performance of the Investors Fund is included below, along with our Asset Allocation Chart. Daily updates on our activity are available on our Results Line, at
310-281-8577, and current information is also maintained on our website at www.oceanparkcapital.com. To gain access to the site enter password opcap.


*These results are pro forma.  Actual results for most investors will vary.  See additional disclosures on page 4.
Past performance does not guarantee future results.

 
Equity Overview - January 2018

Equity Overview

As noted in the Fund Overview, the major indices posted all-time highs in January.  But in the last few trading days, the yield on the 10-year Treasury bond rose to 2.71%, its highest level in almost 4 years, which dampened investor sentiment and caused stocks to retreat somewhat.  Market volatility, which had been benign, also spiked.

Continuing the recent trend, growth stocks outpaced value stocks.

4th quarter earnings reported in January were impressive.  With 50% of S&P 500 companies reporting, the blended growth rate for earnings was 13.4%, an outstanding number and even higher than the 11.0% projected at the end of December.  In addition, 75% of companies beat consensus earnings estimates, better than the 72% one-year average; and, remarkably, 80% beat consensus revenue estimates, much better than the 64% one-year average.


Macro Overview - January 2018

Macro Overview

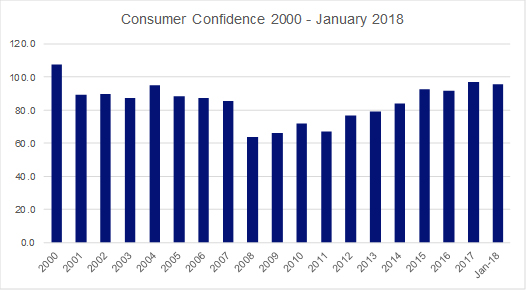
Economic data reported in January were generally positive, with strong results in manufacturing, employment, and retail sales.  Consumer confidence rose more than expected and approached a 17-year high.  However, the Commerce Department reported that its initial estimate of annualized fourth quarter growth was 2.6%, moderately lower than expected.

At the Federal Reserve, Janet Yellen chaired her last meeting, which resulted in no increase to interest rates.  However, analysts concluded from language in the Fed post-meeting statement that it would be raising rates at least three times, and possibly four times, this year.  Yellen’s successor, Jerome Powell, is expected to continue her policies.

Proponents of the dramatic corporate tax cut last year argued that it would cause companies to pass the savings along to workers.  Opponents argued that companies would use the savings to increase dividends and buy back stock.  So far it appears that the opponents were correct.  While some companies have increased wages, and some have provided one-time bonuses that will not result in permanent increases, it is unclear whether the motivating factor in either case was the tax cut or the increasingly competitive labor market.  Moreover, the ratio of wage increases to buybacks has been eye-opening.  Proponents have pointed to bonuses totaling $2.5 billion, while opponents have pointed to buybacks of $88 billion—which was more than double the amount of buybacks during the same period in 2017.


Additional Disclosures - January 2018

Additional Disclosures

Performance data for OPI reflect the reinvestment of dividends and other earnings on the fund’s assets.  Performance data for the major indices reflect only changes in the value of those indices, and would be higher if dividends were included. However, the index data do not reflect fees that would be paid to index fund managers and transaction costs that would be incurred when their component stocks are bought or sold, while OPI’s data do reflect quarterly fees and expenses incurred by the fund.  The information provided is believed to be reliable, but its accuracy or completeness is not warranted. This material is not intended as an offer or solicitation for the purchase or sale of any stock, bond, mutual fund, or any other financial instrument. The views and strategies discussed herein may not be appropriate and/or suitable for all investors. This material is meant solely for informational purposes, and is not intended to suffice as any type of accounting, legal, tax, or estate planning advice. Any and all forecasts mentioned are for illustrative purposes only and should not be interpreted as investment recommendations.