Advanced Income Solutions February 2018 Newsletter
Market Update
(all values as of 06.28.2024)

Stock Indices:

Dow Jones 39,118
S&P 500 5,460
Nasdaq 17,732

Bond Sector Yields:

2 Yr Treasury 4.71%
10 Yr Treasury 4.36%
10 Yr Municipal 2.86%
High Yield 7.58%

YTD Market Returns:

Dow Jones 3.79%
S&P 500 14.48%
Nasdaq 18.13%
MSCI-EAFE 3.51%
MSCI-Europe 3.72%
MSCI-Pacific 3.05%
MSCI-Emg Mkt 6.11%
 
US Agg Bond -0.71%
US Corp Bond -0.49%
US Gov’t Bond -0.68%

Commodity Prices:

Gold 2,336
Silver 29.43
Oil (WTI) 81.46

Currencies:

Dollar / Euro 1.06
Dollar / Pound 1.26
Yen / Dollar 160.56
Canadian /Dollar 0.73

Macro Overview

Rising interest rates weighed on equity momentum as the expectation of increased borrowing costs and inflation accelerated market volatility. Markets retreated from gains established earlier in the year as higher global yields precipitated a pullback in domestic and international equities.

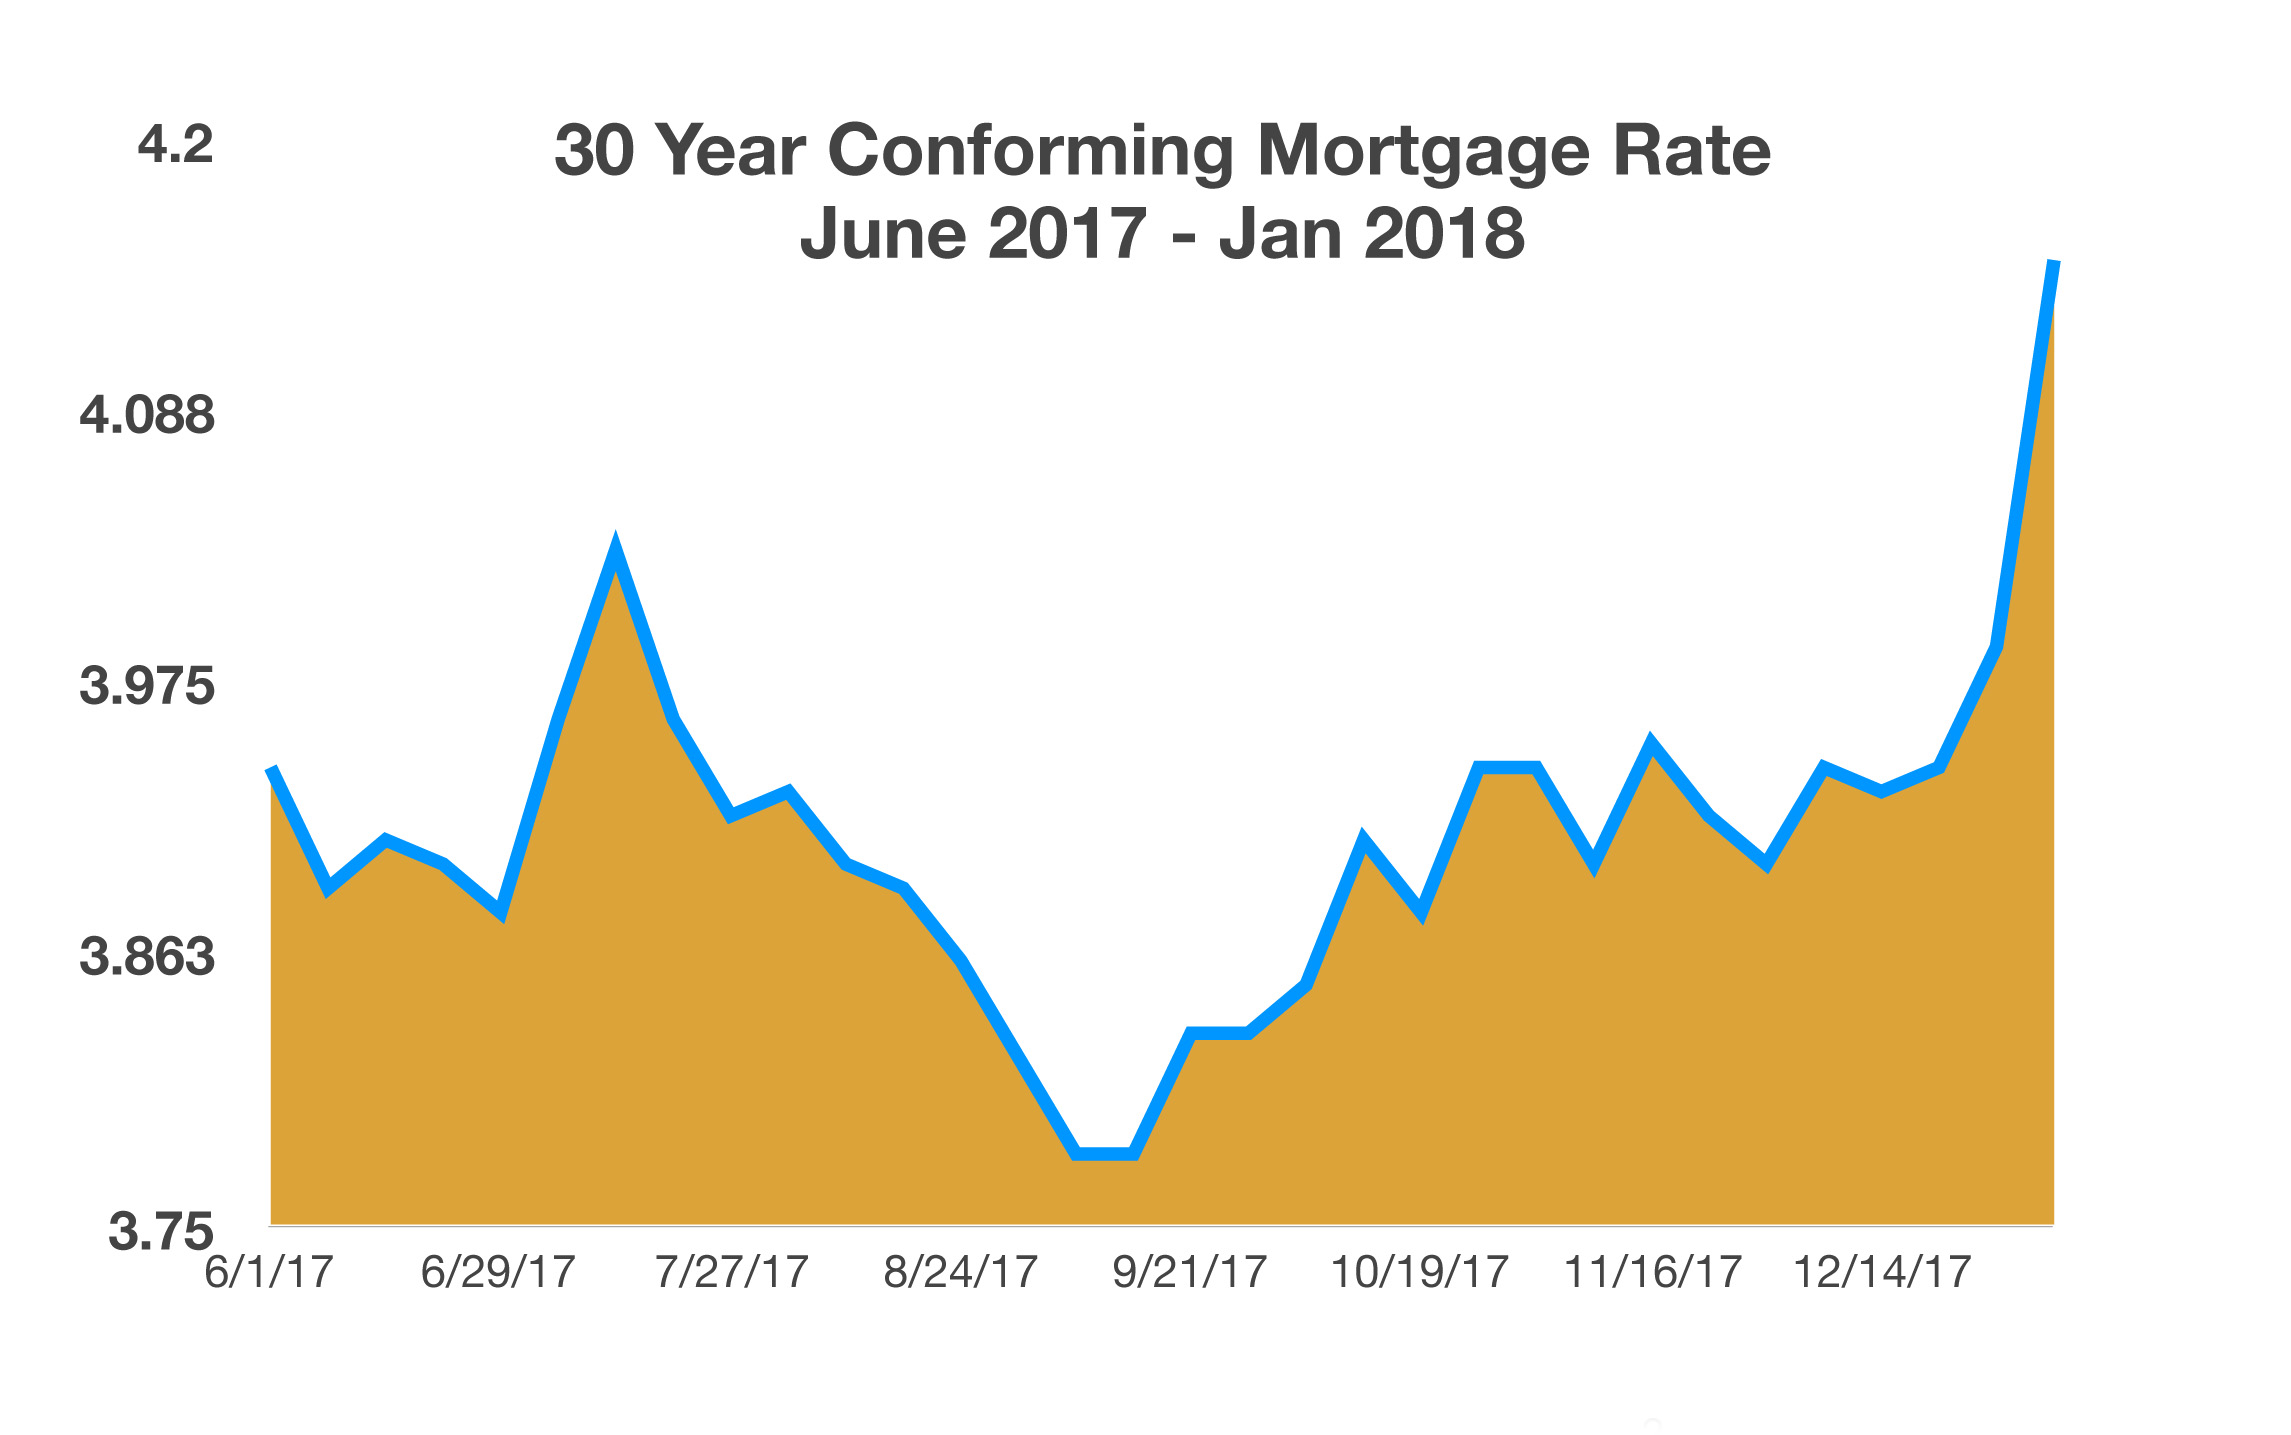
A synchronized global recovery has become the catalyst for increases in commodity prices, inflation and economic growth. Recent oil demand increases by emerging countries have stoked inflation pressures internationally, while news of higher wages in the U.S. fueled further acceleration of inflation fears, driving down bond prices and elevating bond yields. The rise in rates is affecting a broad spectrum of loans from auto and personal to mortgages. The ascent of interest rates in January is expected to continue throughout the year as the Fed slowly starts to unwind its expansive stimulus efforts.

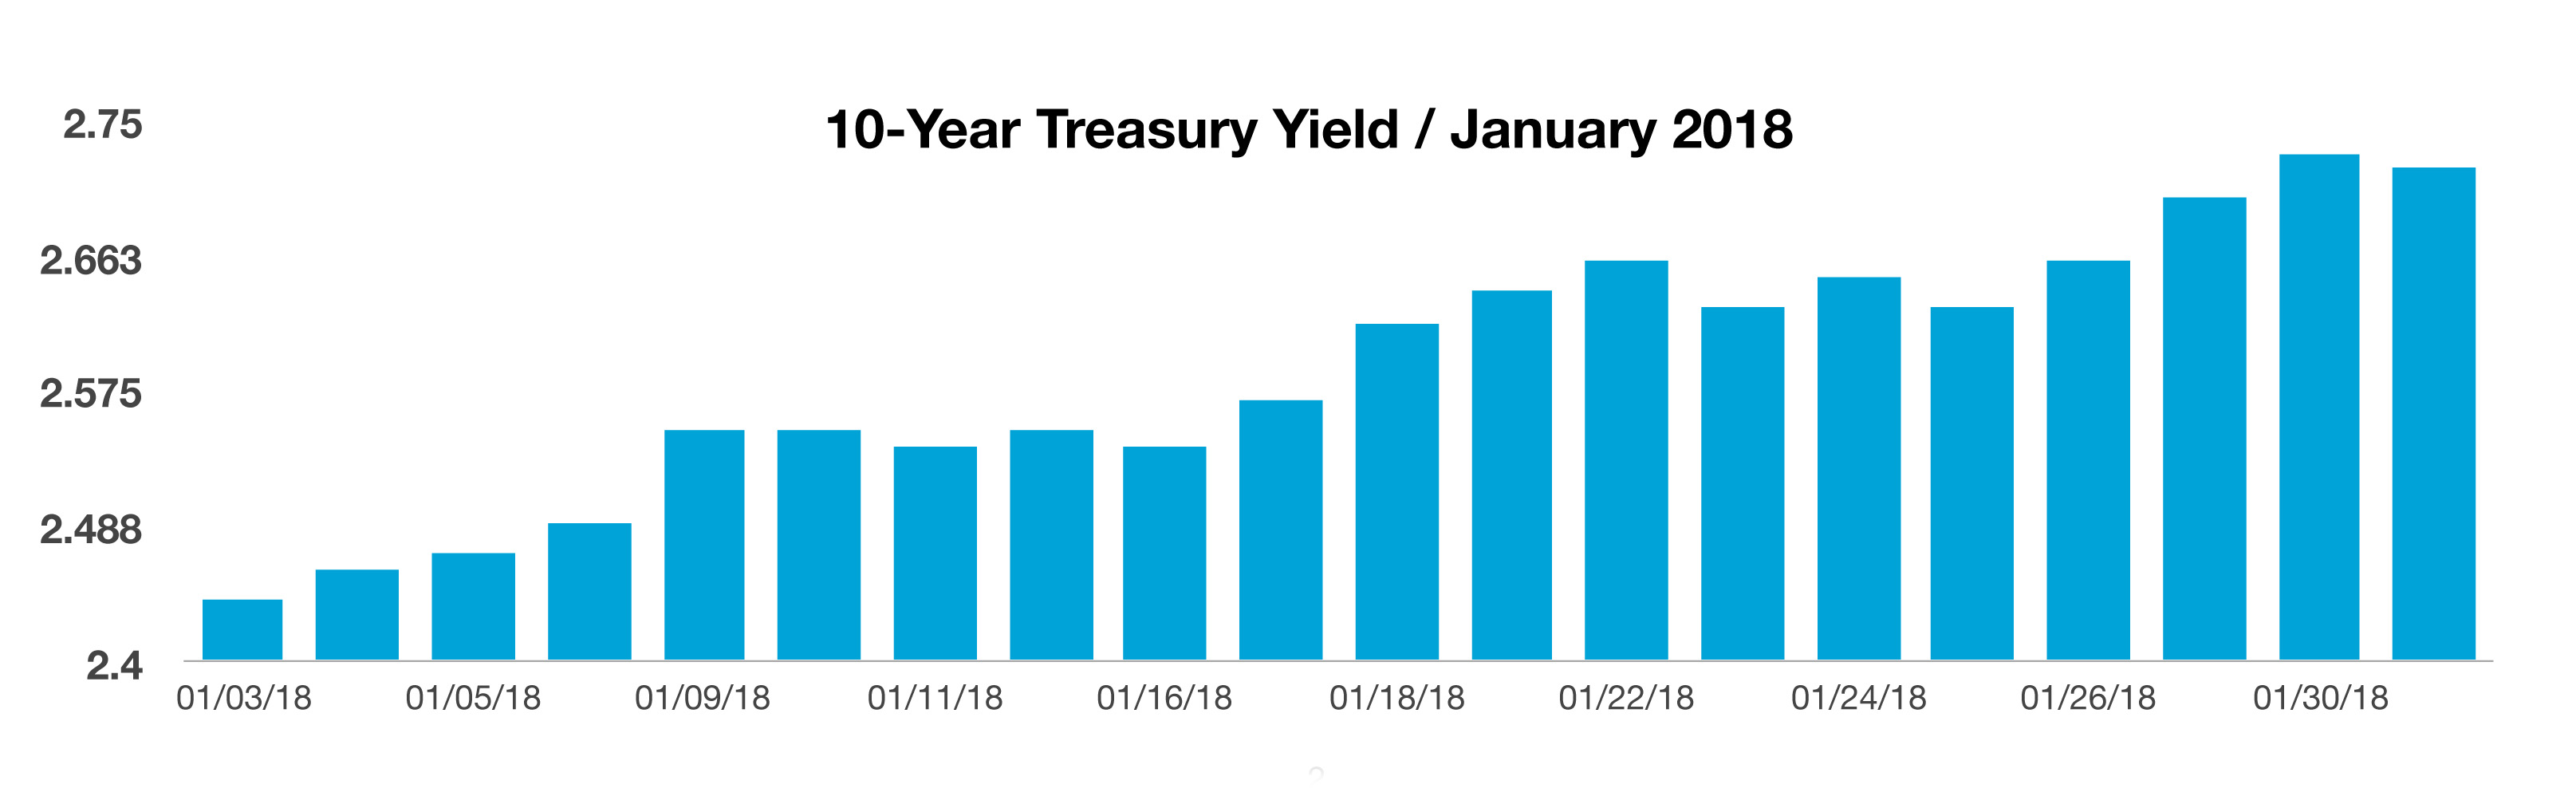
The 10-year Treasury bond yield recorded its steepest monthly increase since November 2016 with short-term and long-term Treasury yields remaining in the tightest range in a half-century. Low rates have allowed companies to borrow cheaply and have forced investors to seek out riskier assets to meet return objectives.

The recent tax changes now allow U.S. corporations to repatriate cash funds overseas and pay a 15.5% tax rather than 35%. An estimated $300 billion is expected to slowly start returning to the United States over the next few months, leading to stock buybacks, hiring, capital investment, and dividend payout increases.

World financial, political and intellectual leaders gathered in Davos, Switzerland, for the annual World Economic Forum. President Trump was the first U.S. president to attend since Bill Clinton in 2000. U.S. representatives discussed plans of establishing revised business and trade arrangements with several nations in attendance.

The Federal Reserve Bank of Atlanta revised its economic growth forecast to 5.4% for the first quarter of 2018, an optimistic revision following improving economic data. The forecast is generated by a model, known as the GDPNow model, which takes various factors into account. The model is also forecasting an increase in consumer spending from 3.1% to 4.0% and an increase in real private fixed investment growth from 5.2% to 9.2%, both significant components for sustainable economic growth.

Sources: Atlanta Fed Bank, Treasury Dept.,www.weforum.org/

 
The Return of Volatility

Volatility Returns To The Market – Equity Overview

Optimism and positive sentiment surrounding earnings and growth estimates fueled equities in January, lifting equity indices to new highs. The S&P 500 achieved its 10th consecutive monthly gain in January, the longest 11-month winning streak for the index since January 1959.  It was also the best January for stocks since 1997.  How quickly things can change.  Since the end of January the Dow has lost 2000 points and the S&P has declined over 250 points.  The decline began with the February 2nd jobs report which showed wages had risen 2.9%, the most since 2009.  Investors took the sharp, unexpected rise to mean that inflation could be coming back and that the Fed may begin to raise interest rates more aggressively than previously thought.

We have been writing for some time that the markets had become wound too tightly and that volatility had been too low for too long.  That became apparent on Monday when an exchange traded note (ETN) that tracks the inverse performance of the VIX completely unraveled.  The XIV ETN hit a high of $145 on January 11th and began a steady downtrend as volatility began to creep higher.  On Monday February 5th it closed at $99 but as the fund scrambled to meet redemptions and Credit Suisse, the issuer of the note began to contemplate redemption of the note the note plummeted to close on February 6th at a price of $7.35.  This in turn sent the VIX skyrocketing to $50 which caused stocks to accelerate their downward trajectory.  Late day trading sent the Dow down nearly 1200 points and for the first time in a year gave investors a reason to re-evaluate their risk positions.

We have been warning investors that a move like this was coming and that investors should use the historically low volatility to purchase protection on their portfolios in the form of put options.  We only hope our advice was heeded as put prices skyrocketed throughout the week.  Our current view is that the shorter term economic outlook is still positive, this is likely not the beginning of a bear market and once this speed bump plays out the “melt-up” we have written about will likely continue.  We have not seen obscene euphoria that generally accompanies the end of a bull market but investors should certainly remain cautious.  Just because something has happened in the past (melt-up) doesn’t mean it will happen this time and we should remind investors that this bull market has been fueled by Global Central Bank’s unprecedented intervention and nobody really knows how that experiment will end as central banks begin to pull back on liquidity.

However, the real story in the equity markets is what has gone on in the bond and credit markets and that story begins on the next page!


Fixed Income Update

Yields Head Higher – Fixed Income Update

Rising global bond yields precipitated a sell off in stocks as the cost to borrow for companies and governments rose. A host of factors are contributing to rates rising including: the ECB, Japan, and Federal Reserve all ending years of stimulus efforts; rising wages; and global economic growth. International bond yields rose in tandem with rising U.S. treasury yields, elevating the 10-year German bund out of negative yields.

As with companies, municipalities may be hit with higher interest rates resulting in saddling state and local government budgets producing increased borrowing costs. Further yet, rising rates may also prevent certain municipalities from taking steps to shore up their underfunded pension plans.

In its January meeting, the Fed did nothing to discourage expectations that it will continue to tighten monetary policy when it meets again in March. The Fed has officially begun to unwind its post financial crisis stimulus process, which entails raising short-term rates and reducing its $4.4 trillion balance sheet.

The Fed is now on track to raise short-term rates three times this year, since it has met its dual mandate of maximum employment with stable inflation. Any additional growth resulting from the recent tax cuts may entice the Fed to raise rates a fourth time this year should it be warranted.

The Treasury Department plans to increase the size of its bond and note auctions by $42 billion in order to meet funding requirements for the government. It also stated that it would only be able to fund government operations through the end of February unless congress raises the debt ceiling.  (Sources: Fed, US Treasury)

The above chart looks scary enough, however since January 30th rates have skyrocketed from 2.72% to 2.85%, an incredible rise in only 7 trading days.  Readers will remember from previous newsletters that with global debt reaching $233 trillion a 1% move in interest rates equates to a loss of approximately $1.2 trillion for bond investors.  As you can see from the chart, rates have risen approximately 50 basis points (1/2 percent) in a little over a month meaning there are actual losses of around $600 billion in bond investors portfolios.

 
Credit Markets

Another potential problem is the tremendous amount of leverage in the bond market as many investors have been borrowing at sub 1% short-term rates and investing in longer term bonds with yields of 3-4% leveraging that into longer term bonds often leveraging their longer term bonds multiple times. This trade works well as long as rates stay low but as rates rise it can trigger significant losses. As an example, if I am a hedge fund and I can borrow $100 million in short-term funds at 1% my cost for the $100 million is a mere $1mm/year. If I take the $100mm and leverage it 5X and purchase $500mm in 10 year corporates at 4% I am earning $20mm in interest on $100mm in capital giving me an annualized return of 19% ($20mm interest – $1mm borrowing cost = $19mm net on $100mm in capital). As readers know, prices in long-term bonds move more significantly as rates rise meaning these investors are sustaining tremendous losses on the long term bonds at the same time my cost of capital is increasing as short-term rates rise. This is an overly simplistic example and there are factors such as hedging that can help stem losses but it should illustrate that rising rates could mean some real losses for some very large institutional investors and it wouldn’t surprise us to see some of these funds forced to liquidate should rates continue to rise (further exacerbating stock and bond losses).

One the bright spot in the markets has been credit spreads which have held in surprisingly well.

As the chart shows, U.S. High Yield Option Adjusted Spread Index increased 30 basis points from approximately 3.29% to 3.59% – a big move in a week to be sure but far from the bloodletting we would expect to see when volatility spike from low teens to 50.  This could be an indication that this is not the end of the bull market but likely a speed bump.  This index should be watched closely by investors as it is a good indicator of liquidity in the bond market and if it really starts to crack then it will likely be time to head for the exits.

Monthly Tesla Update:

Regular readers know we like to track the Tesla corporate bonds that were issued last August at a yield of 5.3%.  We stated at the time that we felt like this issue represented the utter disregard investors had for risk and might be remembered as the high mark of the current credit orgy.  After having stabilized around $95 for the last 2 months, the recent market volatility sent the bonds rocketing south with prices closing on Friday at $92.95.  Investors who purchased these bonds at issue last August are down a little over 7% now (not counting interest payments).  As we have written, we believe that ultimately prices on this issue could fall significantly from here.  More importantly, these bonds represent investors overall willingness to take risk and could spell trouble down the road for the credit markets as issuers find it harder to refinance debt.


Mortgage Rates Rising


Mortgage Rates Starting To Rise – Mortgage Market Update

Optimism about economic growth has led to higher inflationary expectations, which eventually translate into higher interest rates. Over the past few months, the yield on the 10-year U.S. Treasury has increased from a historical low of 1.35% in 2016 to 2.72% at the end of January. As a gauge for mortgage rates nationally, the increase in the 10-year Treasury has also led to an overall increase in mortgage rates. According to data made available by Freddie Mac, the average rate on a 30-year fixed mortgage loan increased to 4.15% at the end of January. The concern economists have is that as mortgage rates continue to increase, home sales and affordability may begin to falter.

Thirty-year mortgage rates have surged to the highest levels in nearly a year, increasing borrowing costs at a time when the housing market is strengthening and prices have been rising. The 4.15% rate at the end of January was the highest rate since March 2017 and above 4 percent for the first time since May 2017. The average 15-year mortgage rate climbed to 3.62 percent from 3.39 percent.

Even with the recent rise in mortgage rates, rates are still low on a historical basis. As of this past month, the average mortgage rate since 1971 has been 8.16%. Over the past 46 years, mortgage rates have transitioned from the 5% range in the early 70s to over 14% in the late 70s and early 80s, with the 30-year conforming rate hitting a record high of 16.63% in 1981. (Sources: Freddie Mac, Bloomberg, U.S. Treasury)


Delinquencies Rise

And in a not so surprising turn of events, the FHA reported that as underwriting standards have eased delinquencies have begun rising.  The share of borrowers who are late on their FHA loans, which primarily go to first-time homebuyers, rose to 10.4% in the fourth quarter from 9% a year earlier.  While delinquencies are still historically low, this jump is surprising given that employment is strong and home prices are steadily increasing.

 
Decreasing Dollar and Exports

How A Decreasing Dollar Is Good For U.S. Exports – Currency Overview

The dollar fell in January to its lowest levels since 2014 as central banks around the world started to reduce monetary stimulus efforts and raise rates.

As the economies and circumstances of individual countries change, so does their ability to export and import. A country’s ability to buy goods and services from other countries is based on the strength of its currency, while a country’s ability to export goods and services is based on the weakness of its currency.

As a nation’s currency lowers in value, relative to another nation’s currency, that country will be able to export more. This may sound counterintuitive, but devaluing a country’s currency is in itself a form of stimulus. The benefits of a devaluing currency for a nation’s economy include an increase in exports, which may result in additional manufacturing and employment.

A significant hindrance of a devaluing currency would be imports becoming more expensive, thus indirectly causing inflationary pressures within an economy.

Since 1995, as the U.S. dollar has devalued, exports have been steadily increasing. As the U.S. dollar has been dropping, U.S. manufactured products have become less expensive for other countries worldwide. This dynamic is an important component for many U.S. companies operating globally.

Sources: Fed, Bloomberg, Commerce Dept

 
New IRS Withholding Tables

New IRS Tax Withholding Tables – Tax Planning

Because of the new tax law provisions this past month, 90% of wage earners will see an increase in their paychecks due to revised withholding rates, according to the administration. The effect of the revisions will be noticeable in early February, or as soon as employers adopt the new withholding tables, which are required to be in place no later than February 15th.

Withholding tables are used by payroll services and employers to determine how much tax to withhold on employee checks. The new tables reflect the increase in the standard deduction, repeal of personal exemptions and tax rate modifications.

According to the IRS, the new tables should produce more precise tax withholding, thus reducing overpayments that result in excessive tax refunds. The idea is to have just the right amount withheld, not too much and not too little. The IRS is also suggesting that form W-4 be revised to account for changes with itemized deductions, child tax credit, dependent credit, and repeal of dependent exemptions.

The IRS is also updating its withholding calculator on IRS.gov to reflect the new tables https://www.irs.gov/individuals/irs-withholding-calculator. (Source: IRS)


Summary

As we predicted, volatility has returned.  Investors should remain optimistically cautious.  Overall, the positive economic picture remains in tact but tightening credit could be the impetus which turns this correction into a bear market.  Given the historical increase in debt levels (of every type) and the massive amount of leverage in the system if this bond/credit bubble finally burst it has the potential to make 2008 look like a walk in the park.

We continue to prefer fixed income securities backed by hard assets and would avoid taking credit risk in high yield corporate bonds as the risk/return profile is extremely unattractive at this point.  It would take significant spread widening for us to change our view on the corporate bond sector and a widening of that magnitude would mean a real bloodletting among all asset sectors.

With the yield curve (and credit curve) at historically low levels, investors concerned with total returns should avoid longer-term fixed income securities.  We are currently keeping our duration between 2-3 years which means we should have lower price volatility if things begin to get really ugly.  

We recommend keeping some liquidity and staying hedged and flexible.  Don’t be the last guy heading for the exits when the house starts to burn!

Happy Investing,

David Dellinger