AIS FEBRUARY 2019 NEWSLETTER
Market Update
(all values as of 06.28.2024)

Stock Indices:

Dow Jones 39,118
S&P 500 5,460
Nasdaq 17,732

Bond Sector Yields:

2 Yr Treasury 4.71%
10 Yr Treasury 4.36%
10 Yr Municipal 2.86%
High Yield 7.58%

YTD Market Returns:

Dow Jones 3.79%
S&P 500 14.48%
Nasdaq 18.13%
MSCI-EAFE 3.51%
MSCI-Europe 3.72%
MSCI-Pacific 3.05%
MSCI-Emg Mkt 6.11%
 
US Agg Bond -0.71%
US Corp Bond -0.49%
US Gov’t Bond -0.68%

Commodity Prices:

Gold 2,336
Silver 29.43
Oil (WTI) 81.46

Currencies:

Dollar / Euro 1.06
Dollar / Pound 1.26
Yen / Dollar 160.56
Canadian /Dollar 0.73

Macro Overview

A resilient U.S. economy drove equity markets to the best January in 30 years, propelling stock indices to new year gains which had not been seen since January 1989.

Job and wage growth skirted the government shutdown as the number of employed increased in January along with rising wages. The unemployment rate ticked up to 4.0% in January due to 800,000 federal employees furloughed during the month, a temporary effect of the shutdown. The onslaught of increased hiring by companies and higher wages translates into stronger consumer spending throughout the economy.

Federal government offices and agencies were reopened after the 35-day partial shutdown, but only until February 15th, the day when temporary funding ends for federal agencies. The Congressional Budget Office (CBO) released downward revised GDP numbers following the shutdown. The extent of the federal government shutdown has drawn concern from economists and analysts about what effects on economic growth it may produce. Economic affects from prior shutdowns weren’t recognized for months following past shutdowns.

U.S. trade tensions with China continued as negotiators hashed out how to address the excessive trade imbalance between the two countries. U.S. trade representatives have set a deadline for negotiations with China for March 1st, at which point all imported Chinese goods will be subject to a 25% tariff if a compromise isn’t achieved.

The Fed decided to leave rates unchanged during its January 30th announcement, adopting what it called a “patient rate stance” interpreted by the markets that it would hold off on raising rates for the time being. It also mentioned that it would be flexible in reducing its balance sheet, an indirect method of altering short-term rates.

Congressional leaders have until a March 1st deadline to raise the federal debt limit. The Treasury department, though, can use “extraordinary measures” to continue to finance governmental operations. Congressional decisions to increase the debt limit have become a common political debate over the years.

Britain’s vote two years ago to exit the European Union (EU) has been vigorously contested by the British parliament leading to no formal plan in place to exit. March 29th is the formal date set for Britain to exit the EU, whether or not the country has any plans in place or not.

Some presidential candidates for 2020 have announced higher taxes for top tier American earners, with the notion of possibly lifting tax rates back to pre-Reagan tax levels. Among the tax concepts floated include a wealth tax and raising the top marginal tax rates.

Consumer confidence is being carefully monitored by economists to see if sentiment was hindered by the market pullback and government shutdown. Some economists expect the effect of the polar vortex in late January to result in downward revisions on GDP growth as frozen waterways, cancelled flights, business closures and loss of income lessened productivity.

(Sources: Federal Reserve, CBO, BLS, Dept. of Labor)
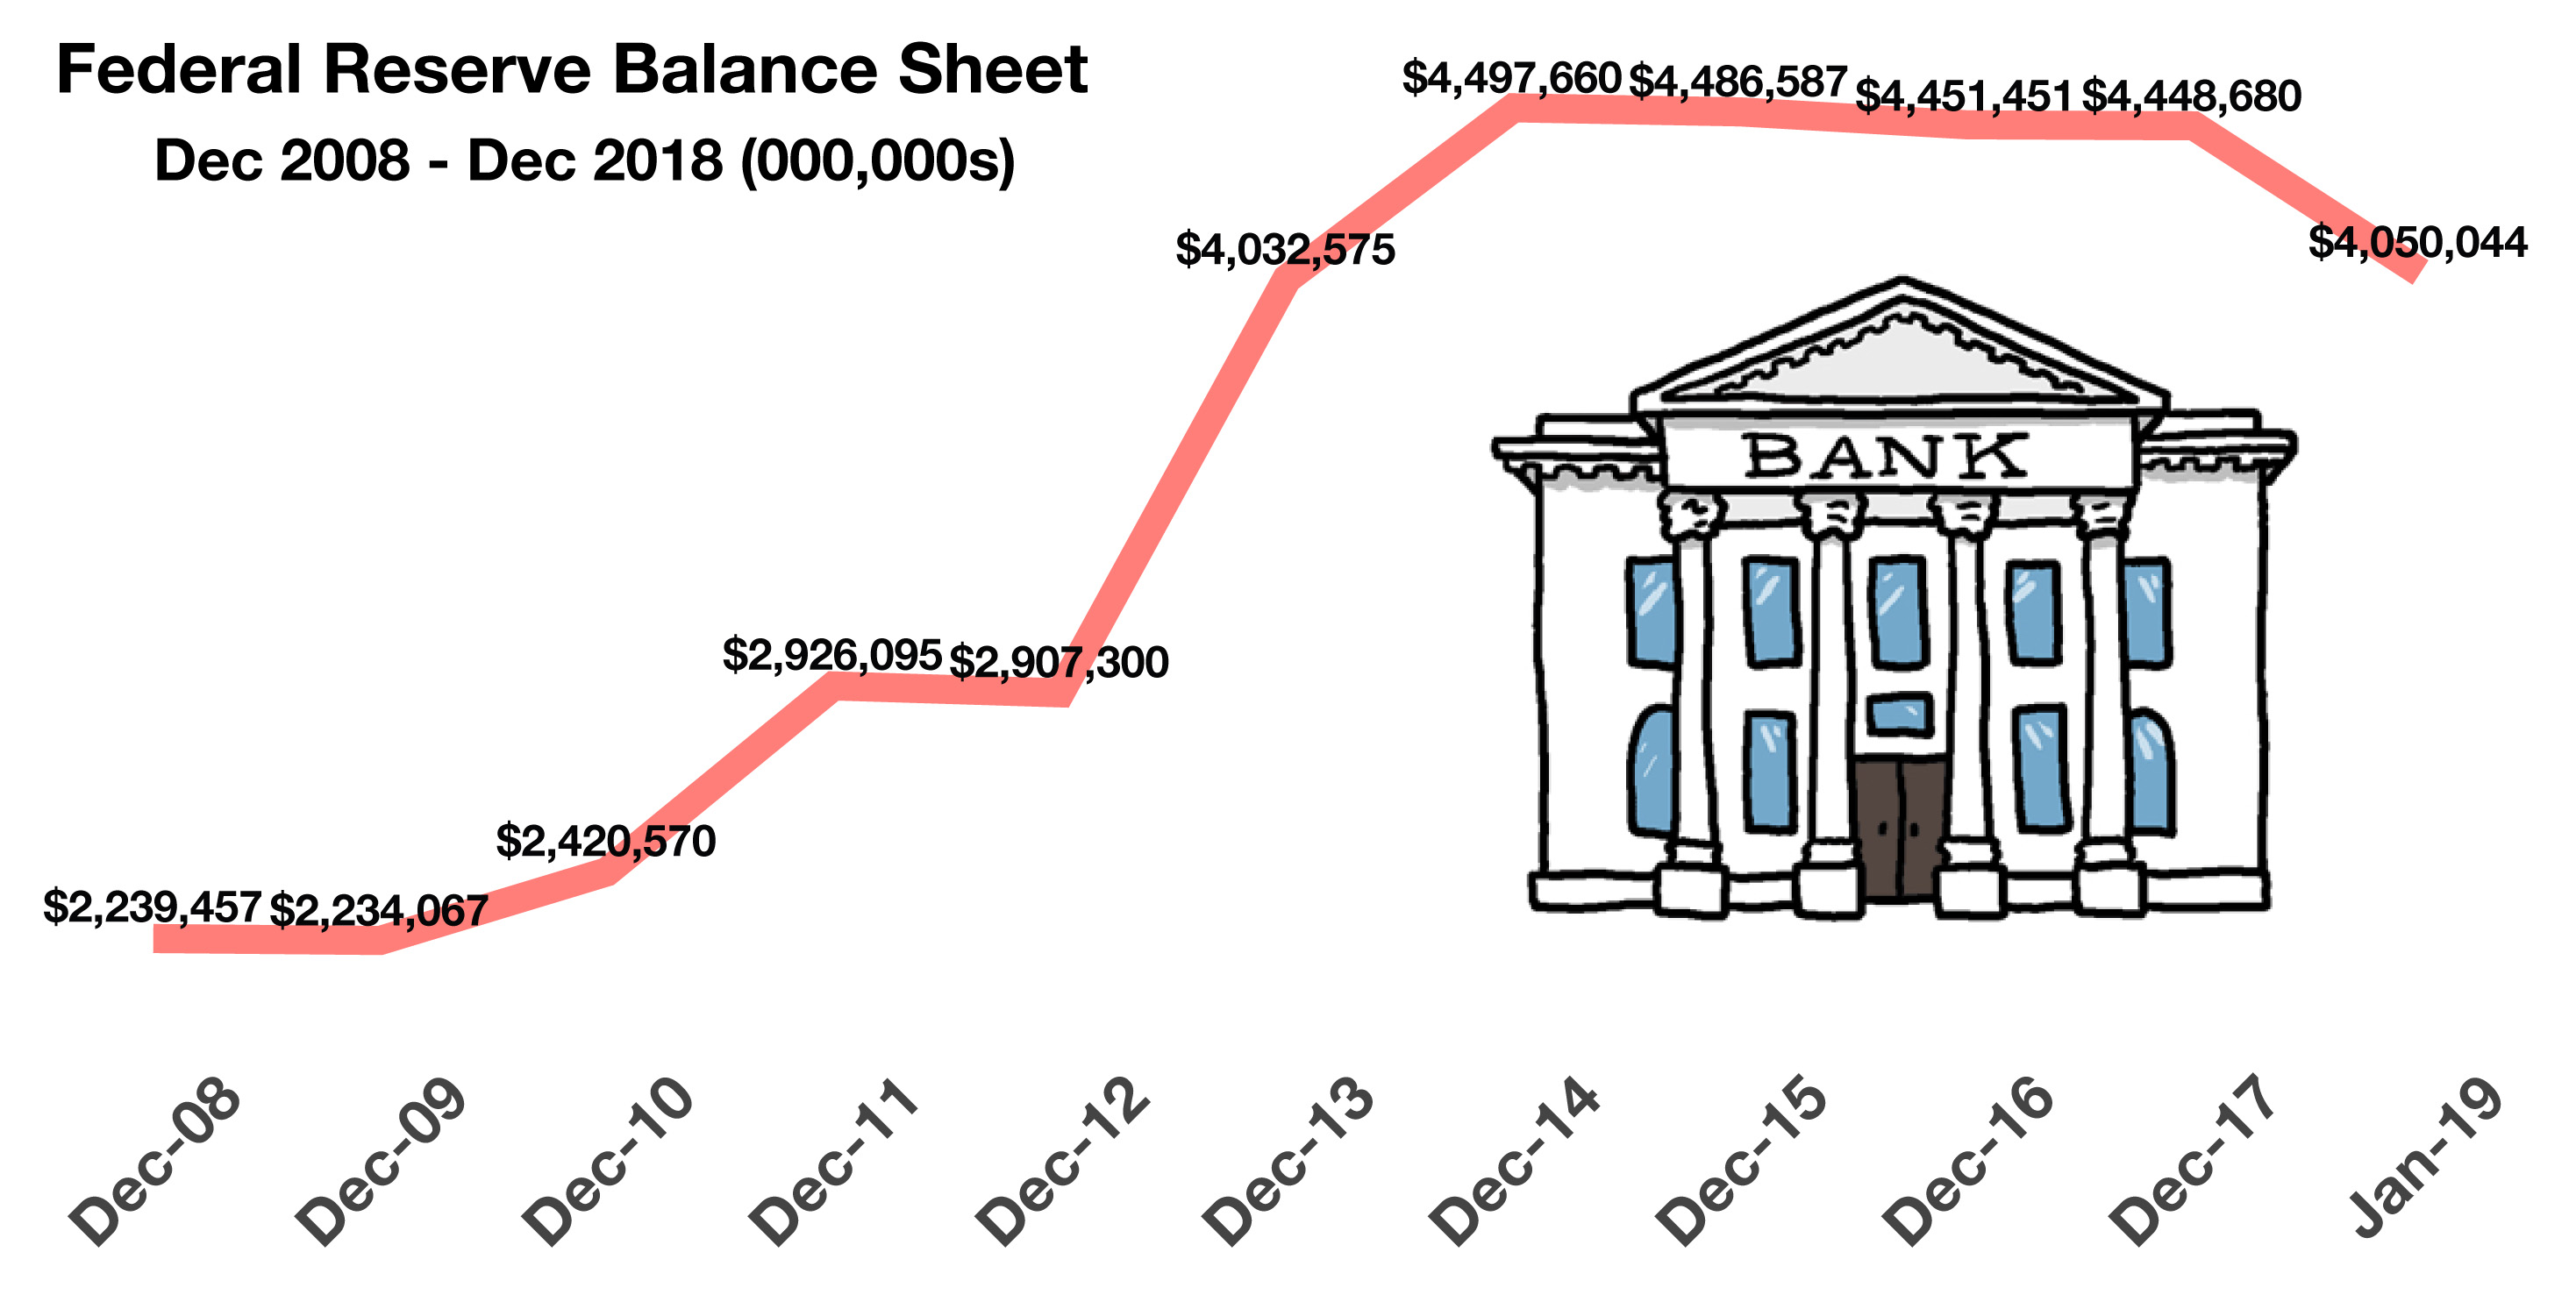
 
the Fed’s balance sheet has fallen from a peak of $4.5 trillion to $4 trillion

Equities Have Best January Since 1989 – Equity Market Update

Equity markets rebounded in January erasing volatility residue from the end of 2018. Earnings released during the month were mixed but yielded optimism for various sectors and industries. January results posted the best beginning of any year since 1989, a dramatic reversal from what was the worst December since 1931.

Major stock indices experienced among the most dramatic daily point swings ever in January as major indices were driven by bearish sentiment to bullish sentiment in a matter of hours. Such extremes create confusion among traders and analysts, making it difficult to determine where valuations and stock prices might be headed.

Some analysts believe that equities are being driven by stock selection versus economic data as a focus on earnings intensifies with economic data becoming muted. A growing demand for value stocks occurred in January as dividends and balance sheets became sought after rather than growth. (Sources: Reuters, Bloomberg)

Rates Head Lower While Fed Holds Steady – Fixed Income Update

Overall bond prices rose in January as the prospect of the Fed raising rates in 2019 considerably lessened. The Fed announced that it would refrain from its previous strategy of increasing short-term rates as well as hold off on shrinking its balance sheet. Both monetary tactics are expected to keep interest rates at current levels without any additional increases just yet.

Interest rates fell in January as the Federal Reserve signaled that it would hold off on additional rate increases until economic data warranted a rise. Bond prices, which move inversely to bond yields, rose across all fixed income sectors, alleviating concerns of further rate increases.

It is expected that the Fed won’t raise again until it has validation about economic and wage growth producing inflationary pressures.

Central banks from around the globe continue to shrink their balance sheet, emulating the latest actions by the Federal Reserve in the United States. Shrinking or reducing a central bank balance sheet is a form of monetary tightening, thus an indirect method of raising short term rates. So far, the Fed’s balance sheet has fallen from a peak of $4.5 trillion four years ago in January 2015 to $4 trillion in January 2019. (Sources: U.S. Treasury, Federal Reserve, Bloomberg)

 
the U.S. went from a trade balance in 1985 to a trade deficit of $375 billion in 2017

China Trade Deficit Reaches Largest Ever In 2018 – International Commerce

China’s trade deficit with the U.S. rose to the largest difference ever in the last quarter of 2018 as ongoing trade disputes continue. In October 2018 alone, U.S. exports to China were valued at $9.13 billion versus imports from China were valued at $52.23 billion, resulting in a $43 billion trade deficit for the month.

Over the past twenty-five years, China has evolved from a heavy equipment and machinery exporter to a prominent leader in technology product exports. Large international conglomerates have established an enormous manufacturing presence throughout China, utilizing its cheap labor and quick turnaround times. China’s manufacturing plants are among the most modern in the world, producing large capacities almost entirely for export.

As the world’s appetite for electronic devices has grown, so has China’s ability to manufacture and export these devices. As a product exporter, China is able to manufacture and export finished products worldwide. In addition, China is also an exporter of components, which may be used in the manufacture and assembly of products in other countries, such as the United States. By exporting components in addition to finished products, China is able to hedge against tariff issues and labor costs should they become a factor.

Trade with China has grown tremendously over the past 30 years, from nearly a trade balance in 1985 to a trade deficit of $375 billion in 2017. Imports from China were $506 billion while U.S. exports to China were $130 billion, thus an ensuing trade deficit.

Ironically, China’s purchases of U.S. government debt has helped maintain a low interest rate environment, thus reducing loan rates allowing U.S. consumers to finance more expensive Chinese imports such as big screen TVs, cell phones and computers. (Sources: WTO, IMF, U.S. Dept. of Commerce, FRED)

IRS Waives Penalty For Not Withholding Enough – Tax Planning

The Tax Cuts and Jobs Act, which was enacted in December 2017, brought about a host of changes for taxpayers. Among the changes was the amount of withholdings as calculated by revised tax tables.

The IRS announced that it is waiving the estimated tax penalty for various taxpayers whose 2018 federal income withholding and estimated tax payments fell short of total taxes owed. The penalty will be waived for those taxpayers that have at least paid 85 percent of their total tax liability through withholdings and quarterly payments. When the revised tax brackets were released under the new tax plan, many taxpayers calculated lower withholdings assuming less taxes owed. But the problem that arose was that other factors such as dependency exemptions and itemized deductions didn’t factor into the revised withholding tables. (Source: IRS; www.irs.gov/newsroom)

 
Fixed Income Review - Interest Rates & Yield Curve

INTEREST RATES & YIELD CURVE

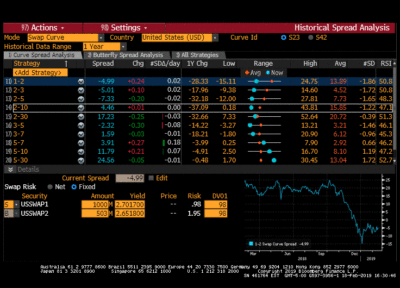
After reaching multi-year highs in November, rates across the curve have moved steadily lower.  After reaching over 3.20% in November the 10-year treasury now sits at 2.66%.  The 2-year treasury has moved from almost 3% to 2.52% and the 5-year is sitting at 2.49%.  Investors purchasing 10-year treasuries are currently receiving only 14 basis points (bps) over 2-year investors and 2-year investors are actually getting 3bps more than 5-year treasury investors.  The short and middle parts of the yield curve has inverted with 1’s to 2’s, 2’s to 3’s and 2’s to 5’s all inverted.  Astonishingly the widest curve is now the 5’s to 30’s which is trading at 24bps (in the swaps curve).

Despite the fact that 2’s to 5’s is inverted we like the 5-year area of the curve and have been weighting new purchases in this maturity area.  We like this part of the curve for several reasons – first with the fed pausing (and seemingly confused) it is quite possible that despite the recent stock market rally rates could be range bound near these levels for some time and there is significant credit spread to pick up by moving slightly further out the curve.  For instance, in CMBS investors can pick up 50bps or more by moving out an additional 3 years.   It is also quite possible that the Fed could be cutting rates as soon as 2020 and by buying in the 5-year range we can lock in decent rates now and reduce re-investment risk down the road.  We also feel that the 17bp difference between the 10-year and 5-year is not enough for taking the term or duration risk on 10-year maturities.  If we get surprised and rates actually rise over the next 1-2 years, our 5-year bonds will have rolled down the curve enough (become 3-4 year bonds) that their price decline will be minimal.  The chart below shows the swaps curve for all the major maturities:

Slightly to the right of center area there is a column titled “Range”.  This shows where each curve is vs. its 1-year average (red dot is average, blue is current).  You can see the 5’s t0 30’s at the bottom is the furthest from its 1-year average.  This is not a situation you see often and it may lead many investors to believe that they should be investing in the 30-year.  However, the amount of duration and credit risk in longer bonds makes this a poor idea for any investors that are not active traders – if you are wrong the price declines can be massive.  This phenomenon has worked out extremely well however for investors that purchased the yield curve steepening bonds we recommended last year.  We discuss that trade on the next page.

NEXT PAGE : THE YIELD CURVE STEEPENING TRADE


FIXED INCOME REVIEW - YIELD CURVE STEEPENING TRADE

YIELD CURVE STEEPENING TRADE

Last June we issued a special report on a specific type of bond that we thought was one of the best risk/return plays available in any investment asset class.  It was a special type of bond called a Yield Curve Steepening Bond or Yield Curve Notes (YCN’s).  YCN’s are bonds that have a coupon tied to the yield curve – as the yield curve steepens the coupon increases and as it flattens the coupon decreases.  We would encourage interested investors to view that report on our website but intuitively one would think that with many areas of the curve inverting that these bonds would have decreased in value.  At the time we wrote the report most of the YCN’s had coupons that had already gone to zero and the yield curve was moving lower across nearly all maturities.  We clearly stated at the time that we expected the yield curve to continue to flatten and that we may be getting into the trade early but that the mass exodus by retail investors had pushed these securities to distressed levels and that they were trading at below their true value and that they could rise in value once retail was done dumping.

We recommended bonds off 2’s to 30’s and 5’s to 30’s (which are the most common) and were  pleasantly caught off guard by what has happened not only in the yield curve but by how quickly YCN prices moved HIGHER as forecast for the yield curve quickly changed.  As we stated on the previous page, the widest part of the curve is the 5’s to 30’s which is now at 24bps.  Many of the bonds we purchased were priced to this curve and the coupons set at 4, 5, or 5.5 times the curve meaning our coupons have (or will shortly) reset at ~1%.  If you read the report we were pricing in a worst case of ZERO coupon for life and felt the coupons would be zero for at least a year so getting a 1% coupon this soon is a bonus (Since these bonds were priced in the $60’s, a 1% coupon moves the total return significantly).

While it does seem we were right regarding the supply dwindling as retail selling has slowed the biggest factor in the price increase of these bonds has been the sudden change in forecast for the yield curve by the big banks.  As the Fed began to waffle on raising rates most of the big banks began to revise their forecast for interest rates and began to project a sooner than expected steepening in the yield curve.  Since these bonds are issued by the largest banks and investment firms (BofA, GS, MS, Citi, etc.) and they were trading at discounts of 30-50% below their new issue price of par, many of these issuers began buying their bonds back in the open market to retire them.

The combination of owning the right part of the curve, dwindling supply and changing forecast pushed the prices of our bonds up over 10%.  The bid/ask spread is still very wide and secondary dealers have been slow to move their bids for stock up in the open market but the smart dealers have been purchasing odd-lots at bargain basement prices and selling the bonds back to the issuers up us much as 10%.  Not all issuers have come in to support their bonds and many of those are still trading near the lows – names like Nomura, Bank of Nova Scotia, Royal Bank of Canada and many other European can still be had at bargain prices though not quite the distressed levels of last year.

One name we like in the YCN space is Goldman Sachs.  Goldman issued a lot of bonds in with maturities in the 7-11 year range that can still be bought with yields as zero coupons in the 3.5% range but the bonus is that many of the issues have formulas that use the 30’s to 5’s yield curve and have no strike meaning they have a coupon of 1% or more.  This should not be construed as a recommendation, even if an individual investor wanted to buy these bonds it would be extremely difficult as the secondary market is limited and complex and interested investors would have a difficult time locating bonds or determining a fair market.  Interested investors should seek the counsel of a qualified investment professional that specializes in fixed income before venturing into this type of trade.

NEXT PAGE: CREDIT SPREADS

 
FIXED INCOME UPDATE - CREDIT SPREADS

CREDIT SPREADS

After blowing out in the last quarter of 2018 credit spreads have been plummeting in 2019.  From October to December high-yield spreads moved wider by over 200 basis points.  This meant a lot of fixed income investors took it in the shorts and saw big losses for year end.  High-yield spreads widened to a little over 500 basis points which by historical standards was still well below average.  With stocks rising again and volatility falling spreads have begun to tighten and are in a little over 100bps from December’s levels.

December was a gift for fixed income investors that had cash available to put to work and gave a glimpse into what we believe the future could hold.  We have written extensively about liquidity in the bond market and how spikes in volatility can lead to amazing bargains in bonds.  There were days in December that felt almost like 2008-2010 when forced sellers were happy just to get a bid on their bonds.  Many sellers looking to raise cash looked to their short holdings to raise cash and knowledgeable investors were able to pick up investment grade short bonds often at double digit yields.

Fast forward to today and it is like last quarter never happened.  It is once again a sellers market and the bargains have seemingly (temporarily) disappeared.  However we should note that the last quarter of 2018 wasn’t all that bad by historical standards and nothing like what is almost certain to come in the not so distant future.  If a 10% – 15% sell-off in stocks can send bond traders running scared and create massive opportunities, imagine what will happen when the next bear market comes or credit crisis hits.  Sean Mathews, formerly CEO of Cantor Fitzgerald was on CNBC and said something that I thought was quite telling – I am quoting from memory here but it was something to the effect of “We are on the verge of generating equity like returns in the bond market, something we haven’t seen in a decade”.  

I worked with Sean almost 30 years ago when he was my trader at Westcap in Houston and always have considered him to be extremely sharp.  Sharp enough in fact that he left his job as CEO of Cantor recently to start his own hedge fund that will look to take advantage of the coming bond market blow up.  His sentiment should not be news to regular readers of our newsletter as we have been echoing this sentiment for some time.  The Fed has been successful at holding back the coming debt tsunami and inevitable credit crisis for almost a decade but at some point it is going to blow – you can only hold your finger in the leak for so long before the dam burst.

If we (and Sean) are right, investors would be wise to keep some powder dry and be ready to take advantage of the next crisis.

 
GOVERNMENT SHUTDOWN

How A Government Shutdown May Affect The Economy – Fiscal Policy

The partial shutdown of the federal government came to a temporary end on January 25th, 35 days after it had begun on December 22, 2018. The administration agreed to reopen federal offices and agencies for three weeks, while negotiations continue with House and Senate leaders in Washington. The restoration of normal operations are scheduled until February 15th, when the deadline for an agreement on federal expenditures is decided on.

Affects of the partial shutdown were assessed by the Congressional Budget Office (CBO) in a report released late January. A primary casualty of the partial shutdown includes a drop in GDP. The CBO cites various factors in determining the drop in GDP. Among them are dampened economic activity mainly due to 800,000 federal employees left out of the consumer spending process for 35 days.

Some businesses within regulated industries were not able to obtain federal permits and certifications needed in order to conduct a normal course of business. Some of these effects may be very temporary or non-consequential while others may not be recognized in economic data for months. Vital economic data by various agencies and federal departments which were not released in January during the government shutdown, may produce some disparities in economic forecasts.

Industries affected by the shutdown include mortgage lending, where Fannie Mae gets involved in the approval process, and large construction projects, where federal permits need to be issued and are required. Other industries affected include pharmaceutical, energy and aviation.

The Labor Department reported that it had found “no discernible impacts” to the job market due to the shutdown in January, with the majority of temporary job losses attributable to the 800,000 furloughed government employees.

Sources: Labor Department, CBO

 
SUMMARY AND CONCLUSTIONS

For the time being it would seem that investors are once again becoming complacent.  After spiking to over 35 in December, the volatility index (VIX) has moved back to around 15.  As we have discussed the VIX affects credit spreads and the complacency has pushed spreads lower meaning once again fixed income investors are not being properly rewarded for credit risk.  We believe 2019 will remain volatile and we will likely see several more of these volatility events like we saw in the last quarter of 2018.  Stocks have seen a significant rally since December and are now pushing up against heavy resistance.  We have discussed the possible “melt-up” that the stock market usually experiences before a long-term rally ends.  This is essentially a period where investor greed takes over and retail pushes the markets to extreme new highs.  We still believe this is possible although there are a lot of significant headwinds that will have to be overcome.

In the short-term we would expect stocks to pull back before beginning a major move higher.  For most this is probably not a tradeable event although we would recommend that investors heavily weighted in stocks exercise extreme caution.  We previously recommended purchasing puts for any positions that were over-weighted for protection and investors that took that advice should have done very well in the fourth quarter and hopefully either rolled their positions down to monetize their put profits or outright sold their put positions.

We have remained extremely cautious in our fixed income positions and while we have moved out the curve slightly purchasing some 5-year paper when spreads blew out last quarter we still believe it is prudent to keep term risk at a minimum and would recommend investors keep their durations well below the 6+year duration of the Barclays Global Bond Index.  We still believe that asset-backed securities offer a far better risk/return profile over corporate bonds and there is still a significant gain in spread (yield) to be gained by owning ABS over corporate bonds.  ABS also have a far lower risk of default compared to similarly rated corporate bonds. Given the massive amount of corporate (IG and HY) debt that has been issued (record amounts) and the number of zombie companies  operating at the mercy of the FED this could be the difference between weathering the coming credit tsunami and being wiped out.


We would like to thank our increasing number of subscribers and welcome any feedback.  We are always available to discuss the topics we have discussed in the newsletters so feel free to email or call with any questions or to simply learn more about fixed income investing


David D Dellinger