January 2019 Market Update
Market Update
(all values as of 06.28.2024)

Stock Indices:

Dow Jones 39,118
S&P 500 5,460
Nasdaq 17,732

Bond Sector Yields:

2 Yr Treasury 4.71%
10 Yr Treasury 4.36%
10 Yr Municipal 2.86%
High Yield 7.58%

YTD Market Returns:

Dow Jones 3.79%
S&P 500 14.48%
Nasdaq 18.13%
MSCI-EAFE 3.51%
MSCI-Europe 3.72%
MSCI-Pacific 3.05%
MSCI-Emg Mkt 6.11%
 
US Agg Bond -0.71%
US Corp Bond -0.49%
US Gov’t Bond -0.68%

Commodity Prices:

Gold 2,336
Silver 29.43
Oil (WTI) 81.46

Currencies:

Dollar / Euro 1.06
Dollar / Pound 1.26
Yen / Dollar 160.56
Canadian /Dollar 0.73

Macro Overview

A resilient U.S. economy drove equity markets to the best January in 30 years, propelling stock indices to new year gains which had not been seen since January 1989.

Job and wage growth skirted the government shutdown as the number of employed increased in January along with rising wages. The unemployment rate ticked up to 4.0% in January due to 800,000 federal employees furloughed during the month, a temporary effect of the shutdown. The onslaught of increased hiring by companies and higher wages translates into stronger consumer spending throughout the economy.

Federal government offices and agencies were reopened after the 35-day partial shutdown, but only until February 15th, the day when temporary funding ends for federal agencies. The Congressional Budget Office (CBO) released downward revised GDP numbers following the shutdown. The extent of the federal government shutdown has drawn concern from economists and analysts about what effects on economic growth it may produce. Economic affects from prior shutdowns weren’t recognized for months following past shutdowns.

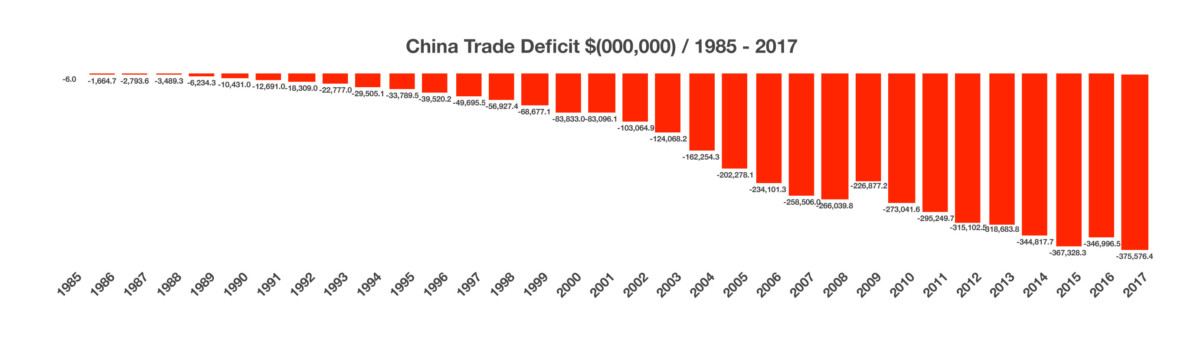
U.S. trade tensions with China continued as negotiators hashed out how to address the excessive trade imbalance between the two countries. U.S. trade representatives have set a deadline for negotiations with China for March 1st, at which point all imported Chinese goods will be subject to a 25% tariff if a compromise isn’t achieved.

The Fed decided to leave rates unchanged during its January 30th announcement, adopting what it called a “patient rate stance” interpreted by the markets that it would hold off on raising rates for the time being. It also mentioned that it would be flexible in reducing its balance sheet, an indirect method of altering short-term rates.

Congressional leaders have until a March 1st deadline to raise the federal debt limit. The Treasury department, though, can use “extraordinary measures” to continue to finance governmental operations. Congressional decisions to increase the debt limit have become a common political debate over the years.

Britain’s vote two years ago to exit the European Union (EU) has been vigorously contested by the British parliament leading to no formal plan in place to exit. March 29th is the formal date set for Britain to exit the EU, whether or not the country has any plans in place or not.

Some presidential candidates for 2020 have announced higher taxes for top tier American earners, with the notion of possibly lifting tax rates back to pre-Reagan tax levels. Among the tax concepts floated include a wealth tax and raising the top marginal tax rates.

Consumer confidence is being carefully monitored by economists to see if sentiment was hindered by the market pullback and government shutdown. Some economists expect the effect of the polar vortex in late January to result in downward revisions on GDP growth as frozen waterways, cancelled flights, business closures and loss of income lessened productivity.     (Sources: Federal Reserve, CBO, BLS, Dept. of Labor)

 
the Fed’s balance sheet has fallen from a peak of $4.5 trillion to $4 trillion

Equities Have Best January Since 1989 – Equity Market Update

Equity markets rebounded in January erasing volatility residue from the end of 2018. Earnings released during the month were mixed but yielded optimism for various sectors and industries. January results posted the best beginning of any year since 1989, a dramatic reversal from what was the worst December since 1931.

Major stock indices experienced among the most dramatic daily point swings ever in January as major indices were driven by bearish sentiment to bullish sentiment in a matter of hours. Such extremes create confusion among traders and analysts, making it difficult to determine where valuations and stock prices might be headed.

Some analysts believe that equities are being driven by stock selection versus economic data as a focus on earnings intensifies with economic data becoming muted. A growing demand for value stocks occurred in January as dividends and balance sheets became sought after rather than growth. (Sources: Reuters, Bloomberg)

Rates Head Lower While Fed Holds Steady – Fixed Income Update

Overall bond prices rose in January as the prospect of the Fed raising rates in 2019 considerably lessened. The Fed announced that it would refrain from its previous strategy of increasing short-term rates as well as hold off on shrinking its balance sheet. Both monetary tactics are expected to keep interest rates at current levels without any additional increases just yet.

Interest rates fell in January as the Federal Reserve signaled that it would hold off on additional rate increases until economic data warranted a rise. Bond prices, which move inversely to bond yields, rose across all fixed income sectors, alleviating concerns of further rate increases.

It is expected that the Fed won’t raise again until it has validation about economic and wage growth producing inflationary pressures.

Central banks from around the globe continue to shrink their balance sheet, emulating the latest actions by the Federal Reserve in the United States. Shrinking or reducing a central bank balance sheet is a form of monetary tightening, thus an indirect method of raising short term rates. So far, the Fed’s balance sheet has fallen from a peak of $4.5 trillion four years ago in January 2015 to $4 trillion in January 2019. (Sources: U.S. Treasury, Federal Reserve, Bloomberg)

 
the U.S. went from a trade balance in 1985 to a trade deficit of $375 billion in 2017

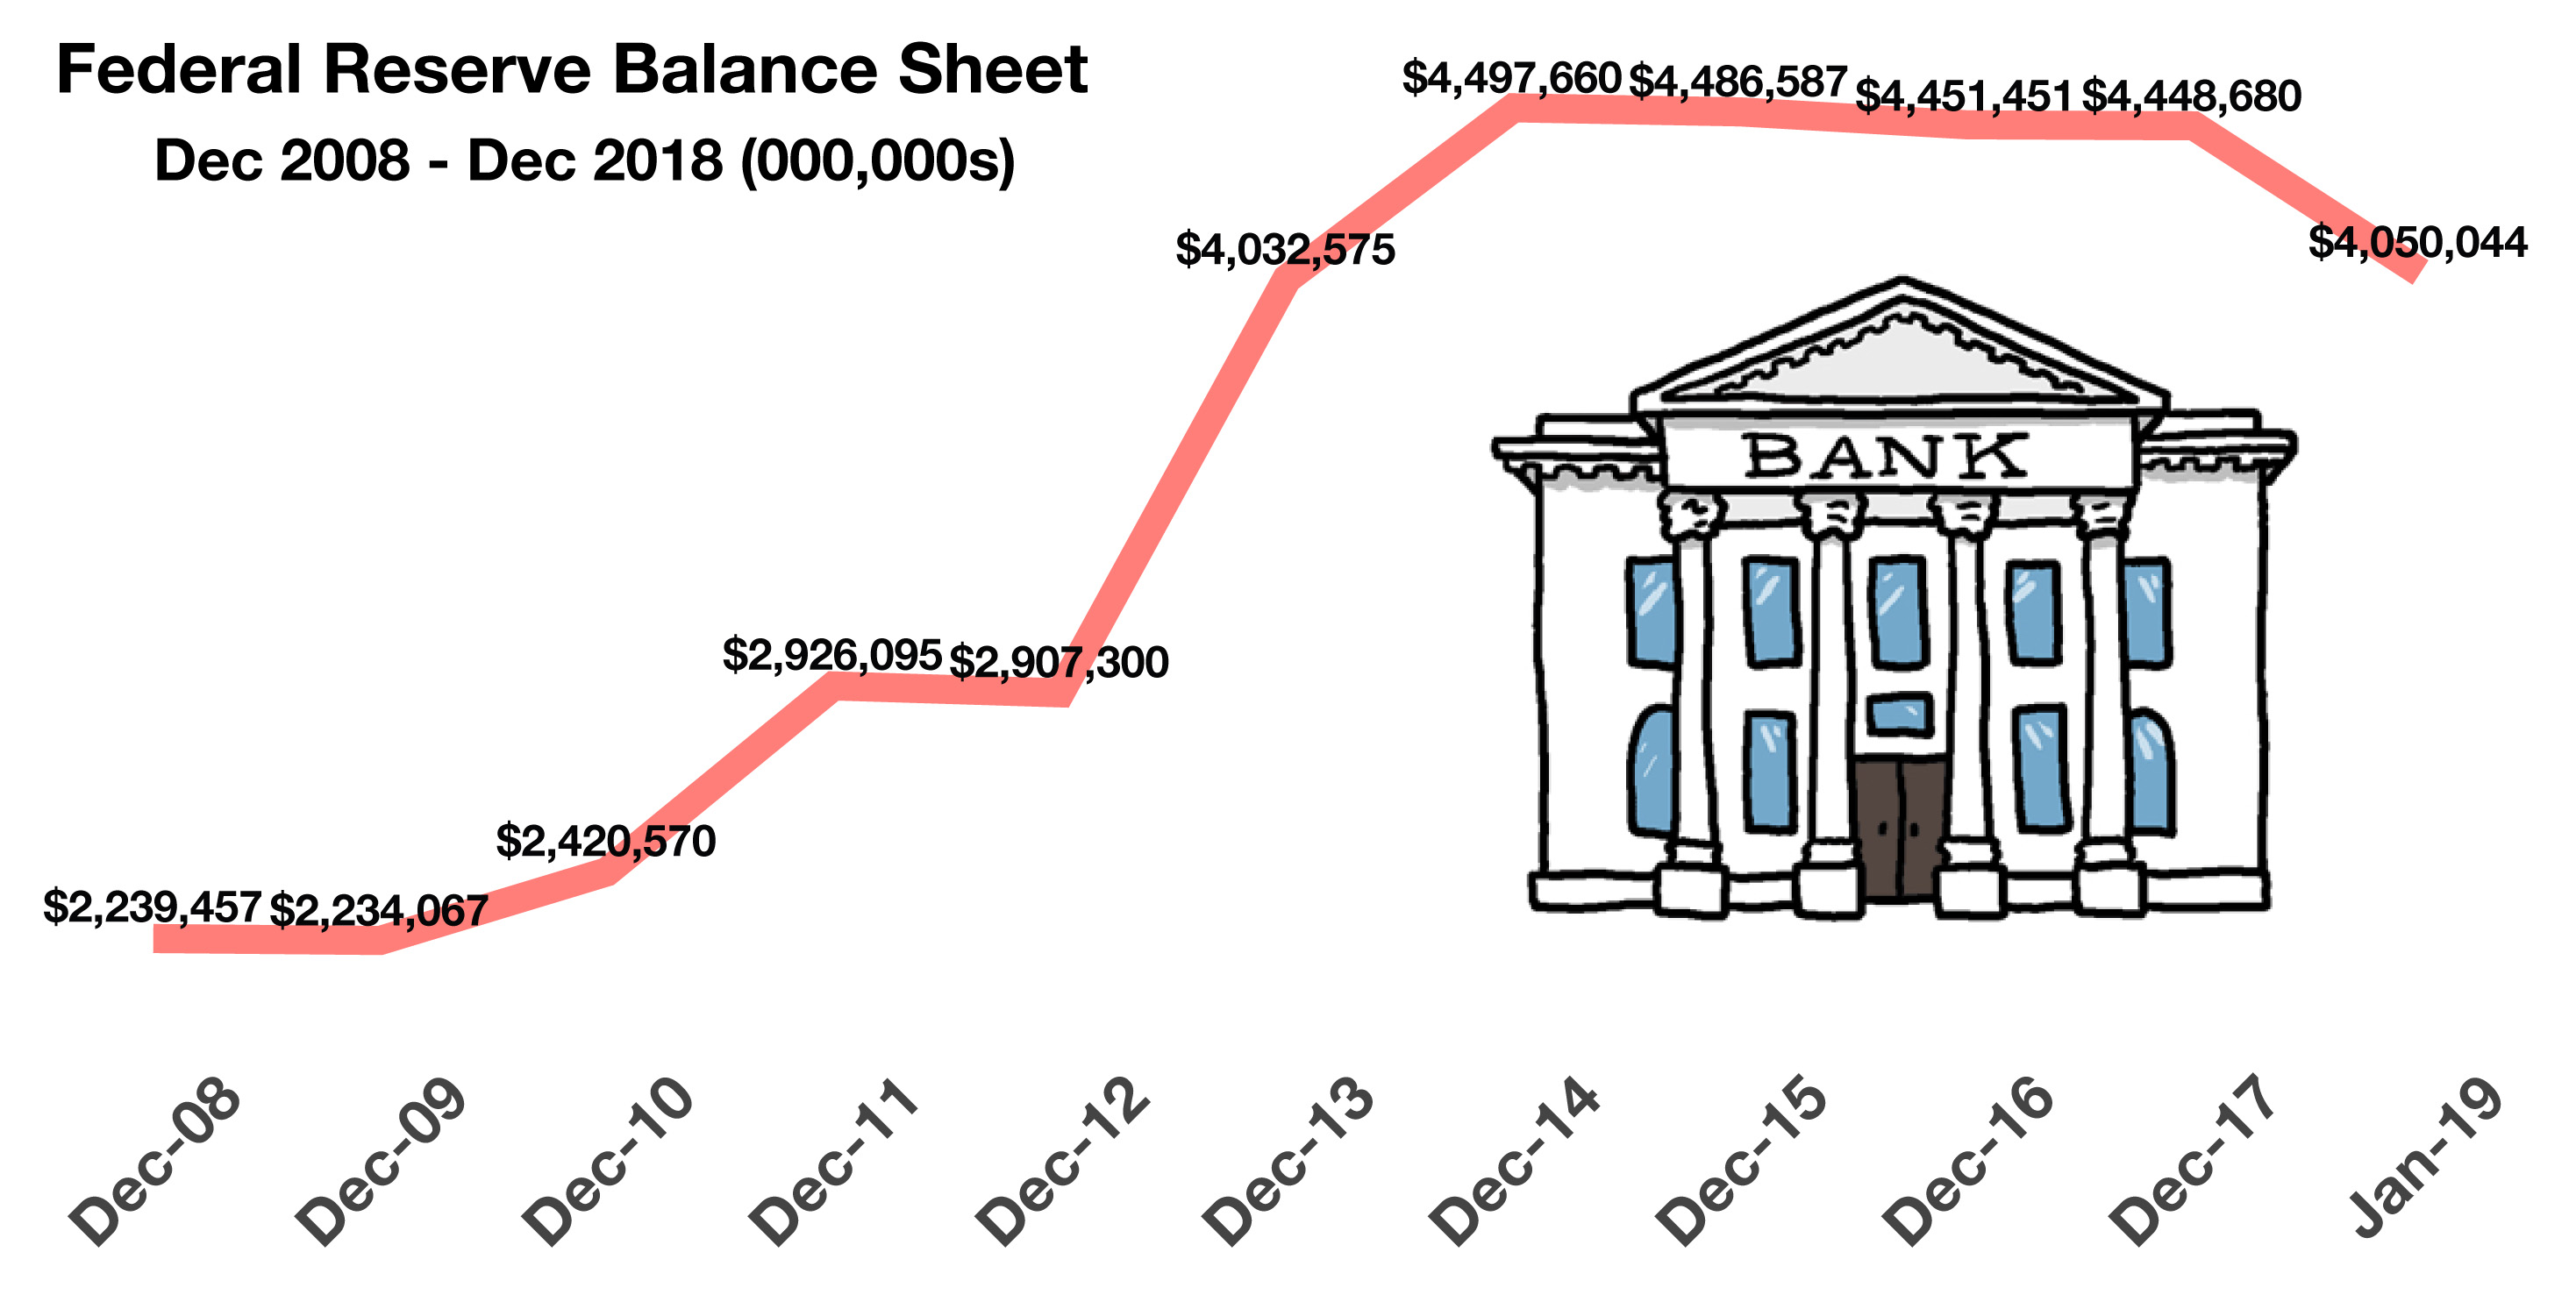
China Trade Deficit Reaches Largest Ever In 2018 – International Commerce

China’s trade deficit with the U.S. rose to the largest difference ever in the last quarter of 2018 as ongoing trade disputes continue. In October 2018 alone, U.S. exports to China were valued at $9.13 billion versus imports from China were valued at $52.23 billion, resulting in a $43 billion trade deficit for the month.

Over the past twenty-five years, China has evolved from a heavy equipment and machinery exporter to a prominent leader in technology product exports. Large international conglomerates have established an enormous manufacturing presence throughout China, utilizing its cheap labor and quick turnaround times. China’s manufacturing plants are among the most modern in the world, producing large capacities almost entirely for export.

As the world’s appetite for electronic devices has grown, so has China’s ability to manufacture and export these devices. As a product exporter, China is able to manufacture and export finished products worldwide. In addition, China is also an exporter of components, which may be used in the manufacture and assembly of products in other countries, such as the United States. By exporting components in addition to finished products, China is able to hedge against tariff issues and labor costs should they become a factor.

Trade with China has grown tremendously over the past 30 years, from nearly a trade balance in 1985 to a trade deficit of $375 billion in 2017.  Imports from China were $506 billion while U.S. exports to China were $130 billion, thus an ensuing trade deficit.


Ironically, China’s purchases of U.S. government debt has helped maintain a low interest rate environment, thus reducing loan rates allowing U.S. consumers to finance more expensive Chinese imports such as big screen TVs, cell phones and computers. (Sources: WTO, IMF, U.S. Dept. of Commerce, FRED)


Walmart employs 1.5 million americans

Walmart is the biggest company in the world by revenue, and there are over 3,500 Walmart Supercenters spread around the United States alone. 1% of private sector workforce in the United States is employed by Walmart.  In Arkansas, that figure jumps up to 4%, with about one-third of the total retail workforce employed at the retail giant.  Here’s the list of the 21 states where Walmart is the top employer.

State # of Employees State # of Employees
1 Texas 168,403 12 Louisiana 36,309
2 Florida 107,460 13 Oklahoma 32,713
3 Georgia 60,002 14 South Carolina 32,165
4 Illinois 53,687 15 Kentucky 29,554
5 Arkansas 52,367 16 Mississippi 24,180
6 Ohio 50,186 17 Kansas 20,103
7 Virginia 43,623 18 West Virginia 11,864
8 Missouri 42,029 19 New Hampshire 7,593
9 Tennessee 40,598 20 Montana 4,861
10 Indiana 39,875 21 Wyoming 4,648
11 Alabama 37,207