Joseph SchwSDWIA Bridgearz, CFA 612.355.4365

Stephen Dygos, CFP® 612.355.4364

Benjamin Wheeler, CFP® 612.355.4363

Paul Wilson 612.355.4366

www.sdwia.com

Market Update
(all values as of 06.28.2024)

Stock Indices:

Dow Jones 39,118
S&P 500 5,460
Nasdaq 17,732

Bond Sector Yields:

2 Yr Treasury 4.71%
10 Yr Treasury 4.36%
10 Yr Municipal 2.86%
High Yield 7.58%

YTD Market Returns:

Dow Jones 3.79%
S&P 500 14.48%
Nasdaq 18.13%
MSCI-EAFE 3.51%
MSCI-Europe 3.72%
MSCI-Pacific 3.05%
MSCI-Emg Mkt 6.11%
 
US Agg Bond -0.71%
US Corp Bond -0.49%
US Gov’t Bond -0.68%

Commodity Prices:

Gold 2,336
Silver 29.43
Oil (WTI) 81.46

Currencies:

Dollar / Euro 1.06
Dollar / Pound 1.26
Yen / Dollar 160.56
Canadian /Dollar 0.73

Macro Overview – February 2019

A resilient U.S. economy drove equity markets to the best January in 30 years, propelling stock indices to new year gains which had not been seen since January 1989.

Job and wage growth skirted the government shutdown as the number of employed increased in January along with rising wages. The unemployment rate ticked up to 4.0% in January due to 800,000 federal employees furloughed during the month, a temporary effect of the shutdown. The onslaught of increased hiring by companies and higher wages translates into stronger consumer spending throughout the economy.

Federal government offices and agencies were reopened after the 35-day partial shutdown, but only until February 15th, the day when temporary funding ends for federal agencies. The Congressional Budget Office (CBO) released downward revised GDP numbers following the shutdown.

The extent of the federal government shutdown has drawn concern from economists and analysts about what effects on economic growth it may produce. Economic affects from prior shutdowns weren’t recognized for months following past shutdowns.

U.S. trade tensions with China continued as negotiators hashed out how to address the excessive trade imbalance between the two countries. U.S. trade representatives have set a deadline for negotiations with China for March 1st, at which point all imported Chinese goods will be subject to a 25% tariff if a compromise isn’t achieved.

The Fed decided to leave rates unchanged during its January 30th announcement, adopting what it called a “patient rate stance” interpreted by the markets that it would hold off on raising rates for the time being. It also mentioned that it would be flexible in reducing its balance sheet, an indirect method of altering short-term rates.

Congressional leaders have until a March 1st deadline to raise the federal debt limit. The Treasury department, though, can use “extraordinary measures” to continue to finance governmental operations. Congressional decisions to increase the debt limit have become a common political debate over the years.

Britain’s vote two years ago to exit the European Union (EU) has been vigorously contested by the British parliament leading to no formal plan in place to exit. March 29th is the formal date set for Britain to exit the EU, whether or not the country has any plans in place or not.

Some presidential candidates for 2020 have announced higher taxes for top tier American earners, with the notion of possibly lifting tax rates back to pre-Reagan tax levels. Among the tax concepts floated include a wealth tax and raising the top marginal tax rates.

Consumer confidence is being carefully monitored by economists to see if sentiment was hindered by the market pullback and government shutdown. Some economists expect the effect of the polar vortex in late January to result in downward revisions on GDP growth as frozen waterways, cancelled flights, business closures and loss of income lessened productivity.

Sources: Federal Reserve, CBO, BLS, Dept. of Labor
 

Equities Have Best January Since 1989 – Equity Market Update

Equity markets rebounded in January erasing volatility residue from the end of 2018. Earnings released during the month were mixed but yielded optimism for various sectors and industries. January results posted the best beginning of any year since 1989, a dramatic reversal from what was the worst December since 1931.

Major stock indices experienced among the most dramatic daily point swings ever in January as major indices were driven by bearish sentiment to bullish sentiment in a matter of hours. Such extremes create confusion among traders and analysts, making it difficult to determine where valuations and stock prices might be headed.

Some analysts believe that equities are being driven by stock selection versus economic data, as a focus on earnings intensifies with economic data becoming muted. A growing demand for value stocks occurred in January as dividends and balance sheets became sought after rather than growth.

Sources: Reuters, Bloomberg

Rates Head Lower While Fed Holds Steady – Fixed Income Update

Overall bond prices rose in January as the prospect of the Fed raising rates in 2019 considerably lessened. The Fed announced that it would refrain from its previous strategy of increasing short-term rates as well as hold off on shrinking its balance sheet. Both monetary tactics are expected to keep interest rates at current levels, without any additional increases just yet.

Interest rates fell in January as the Federal Reserve signaled that it would hold off on additional rate increases until economic data warranted a rise. Bond prices, which move inversely to bond yields, rose across all fixed income sectors, alleviating concerns of further rate increases.

It is expected that the Fed won’t raise again until it has validation about economic and wage growth producing inflationary pressures.

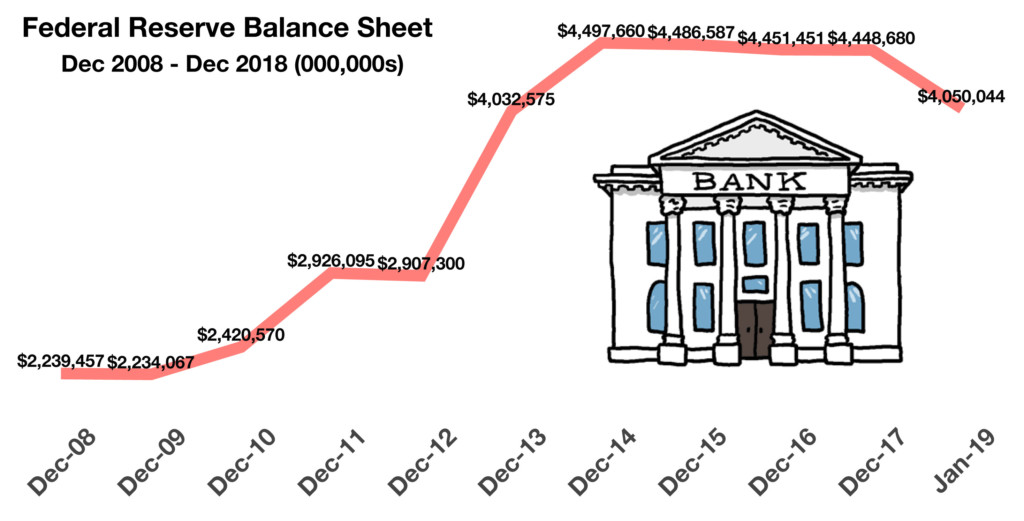
Central banks from around the globe continue to shrink their balance sheet, emulating the latest actions by the Federal Reserve in the United States. Shrinking or reducing a central bank balance sheet is a form of monetary tightening, thus an indirect method of raising short term rates. So far, the Fed’s balance sheet has fallen from a peak of $4.5 trillion four years ago in January 2015 to $4 trillion in January 2019.

Sources: U.S. Treasury, Federal Reserve, Bloomberg


How A Government Shutdown May Affect The Economy – Fiscal Policy

The partial shutdown of the federal government came to a temporary end on January 25th, 35 days after it had begun on December 22, 2018. The administration agreed to reopen federal offices and agencies for three weeks, while negotiations continue with House and Senate leaders in Washington. The restoration of normal operations are scheduled until February 15th, when the deadline for an agreement on federal expenditures is decided on.

Affects of the partial shutdown were assessed by the Congressional Budget Office (CBO) in a report released late January. A primary casualty of the partial shutdown includes a drop in GDP. The CBO cites various factors in determining the drop in GDP. Among them are dampened economic activity mainly due to 800,000 federal employees left out of the consumer spending process for 35 days.

Some businesses within regulated industries were not able to obtain federal permits and certifications needed in order to conduct a normal course of business. Some of these effects may be very temporary or non-consequential while others may not be recognized in economic data for months. Vital economic data by various agencies and federal departments which were not released in January during the government shutdown, may produce some disparities in economic forecasts.

Industries affected by the shutdown include mortgage lending, where Fannie Mae gets involved in the approval process, and large construction projects, where federal permits need to be issued and are required. Other industries affected include pharmaceutical, energy and aviation.

The Labor Department reported that it had found “no discernible impacts” to the job market due to the shutdown in January, with the majority of temporary job losses attributable to the 800,000 furloughed government employees.

Sources: Labor Department, CBO

Emerging Markets Drive Global Growth – International Review

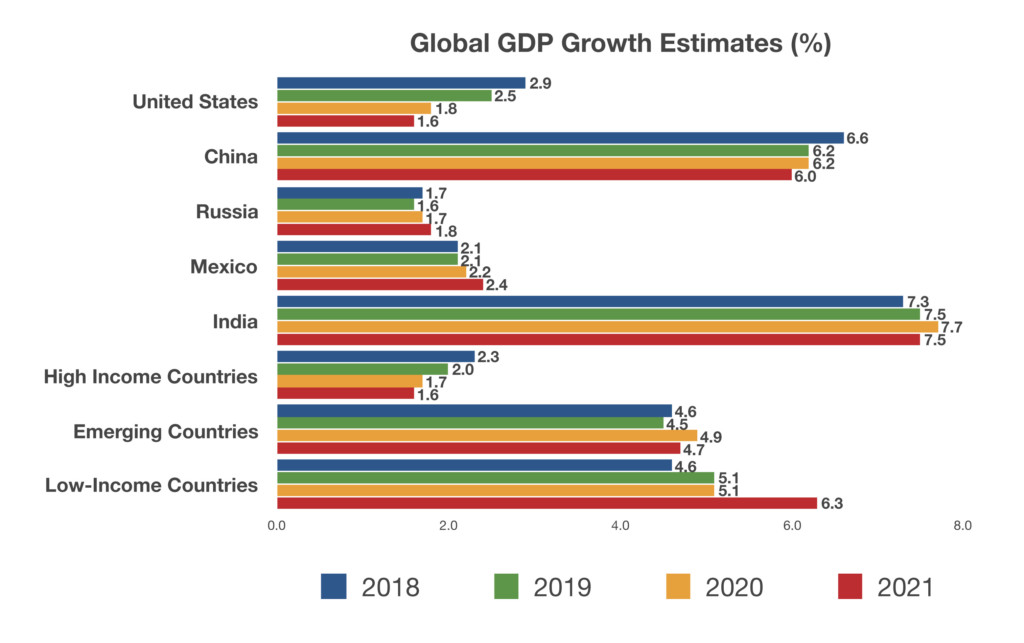
Each year, the World Bank conducts an extensive survey of developed and emerging market countries in order to better determine where global growth might be heading. In its most recent study released in January, the World Bank identified various factors that led to less growth estimates across global economies.

The World Bank identified softened international commerce and continued trade tensions as key concerns in revising its growth estimates. Another factor, weakening demand for commodities such as metals and construction materials, is representative of slowing global expansion. Concurrently, the Chinese government released data in January revealing that it had its lowest GDP growth in 30 years.

Demographics continue to drive population rates higher in low income and emerging economies such as India, where the average age is much younger than in developed countries such as Germany or the U.S. Particularly affecting emerging markets is the heightened cost of debt, with central banks around the world curtailing accommodative policies and raising borrowing costs.

For developed economies, growth is estimated to remain consistent for the U.S. yet weaker than expected in Europe. Estimates for 2019 U.S. GDP growth are 2.5%, falling to 1.6% in 2021. Estimates for India and China over the next three years are expected to rise, with China expected to produce a 6% growth rate and India 7.5% in 2021.

China and India are expected to eventually surpass the United States in total GDP with current growth estimates, nudging the U.S. from the largest economy globally to the third largest. Some believe that as China and India grow, so will American energy exports such as oil and natural gas to countries in their expansion stages.

Source: World Bank; Global Economic Prospects Darkening Skies Jan 2019