Ocean Park Capital Management

2503 Main Street

Santa Monica, CA 90405

Main: 310.392.7300

Daily Performance Line:  310.281.8577

January 2021
Market Update
(all values as of 06.28.2024)

Stock Indices:

Dow Jones 39,118
S&P 500 5,460
Nasdaq 17,732

Bond Sector Yields:

2 Yr Treasury 4.71%
10 Yr Treasury 4.36%
10 Yr Municipal 2.86%
High Yield 7.58%

YTD Market Returns:

Dow Jones 3.79%
S&P 500 14.48%
Nasdaq 18.13%
MSCI-EAFE 3.51%
MSCI-Europe 3.72%
MSCI-Pacific 3.05%
MSCI-Emg Mkt 6.11%
 
US Agg Bond -0.71%
US Corp Bond -0.49%
US Gov’t Bond -0.68%

Commodity Prices:

Gold 2,336
Silver 29.43
Oil (WTI) 81.46

Currencies:

Dollar / Euro 1.06
Dollar / Pound 1.26
Yen / Dollar 160.56
Canadian /Dollar 0.73

Portfolio Overview

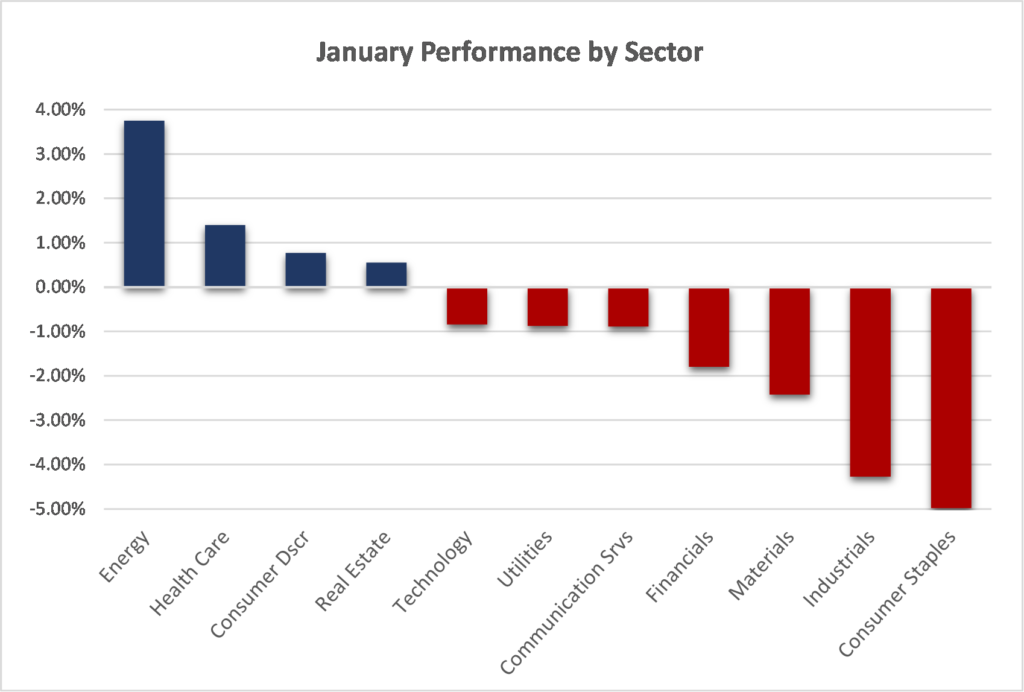
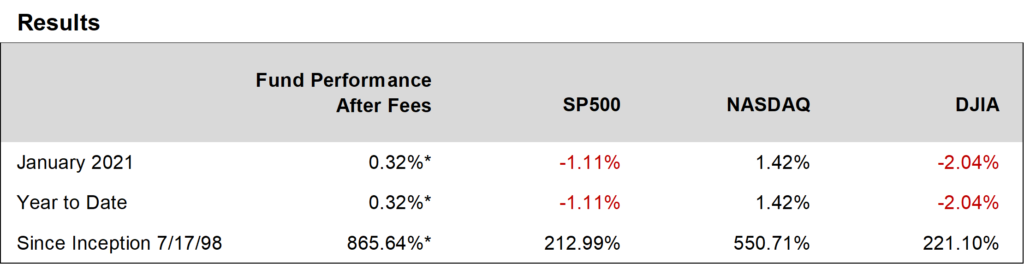
Ocean Park Investors Fund gained 0.32% in January, while the S&P 500 lost 1.11%.  Among our outperforming stocks were Silvergate Capital (up 25%), Sleep Number Corp. (up 15%), and Crocs (up 12%).

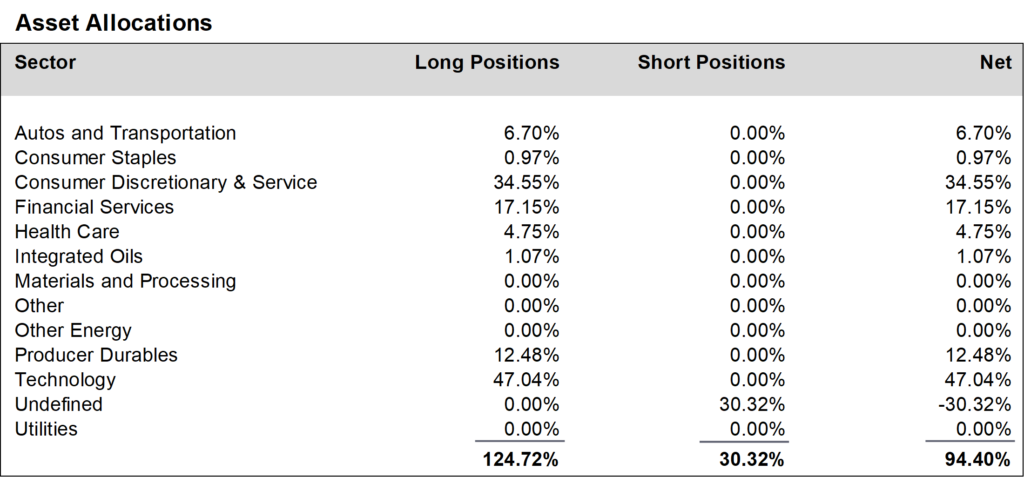
During January, we increased positions in the consumer discretionary and service sector, the financial services sector, the producer durables sector, and the technology sector.  We offset these purchases by increasing our short position in the QQQ ETF, so as to maintain a roughly equivalent net long exposure.  Thus, we finished the month at about 94% net long, up from about 93% in December.


Daily updates on our activity are available on our Results Line, at 310-281-8577, and current information is also maintained on our website at www.oceanparkcapital.com. To gain access to the site enter password opcap.

*These results are pro forma. Actual results for most investors will vary. See additional disclosures on page 4. Past performance does not guarantee future results.

 
Equity Overview

Equity Overview

Stock market results were mixed in January, with most sectors losing ground for the month.  Energy was the best performer, continuing its December rally. Consumer staples was the weakest.

Reversing the recent trend, value stocks generally outpaced their growth counterparts.

Volatility was modest, especially considering the political upheaval early in the month.   Equities traded in a narrow range until month’s end, when the S&P 500 lost 3.5% in the last three trading days.

Meanwhile, 4th quarter earnings results reported in January were generally outstanding.  With 37% of S&P 500 companies reporting, the blended earnings growth rate came in at negative -2.3%, significantly better than the consensus of negative -9.2%.  Moreover, 82% of companies reporting beat consensus earnings estimates and 76% beat consensus revenue estimates, in both cases meaningfully above the one-year and five-year averages.  If the 82% earnings beat rate holds at the end of the reporting season, it will be the second highest since FactSet began tracking it in 2008.


Macro Overview

Macro Overview

January saw what were among the most significant political events in the nation’s history, including the insurrection at the Capitol and the subsequent impeachment of the former president.  Yet the equity market reaction to these events was benign.  Traders appeared more focused on renewed progress toward the $1.9-trillion fiscal stimulus promoted by the new administration.

Pandemic news continued to dominate headlines as the nation experienced record spikes in hospitalizations and deaths.  Nonetheless, prospects for containment of the virus improved as the new administration made an unequivocal shift toward reliance on science-based solutions.

Meanwhile, economic data reported in January was mixed.  Manufacturing and housing continued to improve, but employment and retail sales statistics were disappointing.  Toward month’s end, the Fed concluded its regular meeting by keeping interest rates near zero and reiterating its commitment to a bond-buying program.  Chairman Powell confirmed that monetary policy will remain accommodative until the economy returns to, or nears, full employment.


Additional Disclosures

Additional Disclosures

Performance data for OPI reflect the reinvestment of dividends and other earnings on the fund’s assets.  Performance data for the major indices reflect only changes in the value of those indices, and would be higher if dividends were included. However, the index data do not reflect fees that would be paid to index fund managers and transaction costs that would be incurred when their component stocks are bought or sold, while OPI’s data do reflect quarterly fees and expenses incurred by the fund.  The information provided is believed to be reliable, but its accuracy or completeness is not warranted. This material is not intended as an offer or solicitation for the purchase or sale of any stock, bond, mutual fund, or any other financial instrument. The views and strategies discussed herein may not be appropriate and/or suitable for all investors. This material is meant solely for informational purposes, and is not intended to suffice as any type of accounting, legal, tax, or estate planning advice. Any and all forecasts mentioned are for illustrative purposes only and should not be interpreted as investment recommendations.