February 2022
Market Update
(all values as of 06.28.2024)

Stock Indices:

Dow Jones 39,118
S&P 500 5,460
Nasdaq 17,732

Bond Sector Yields:

2 Yr Treasury 4.71%
10 Yr Treasury 4.36%
10 Yr Municipal 2.86%
High Yield 7.58%

YTD Market Returns:

Dow Jones 3.79%
S&P 500 14.48%
Nasdaq 18.13%
MSCI-EAFE 3.51%
MSCI-Europe 3.72%
MSCI-Pacific 3.05%
MSCI-Emg Mkt 6.11%
 
US Agg Bond -0.71%
US Corp Bond -0.49%
US Gov’t Bond -0.68%

Commodity Prices:

Gold 2,336
Silver 29.43
Oil (WTI) 81.46

Currencies:

Dollar / Euro 1.06
Dollar / Pound 1.26
Yen / Dollar 160.56
Canadian /Dollar 0.73

Macro Overview

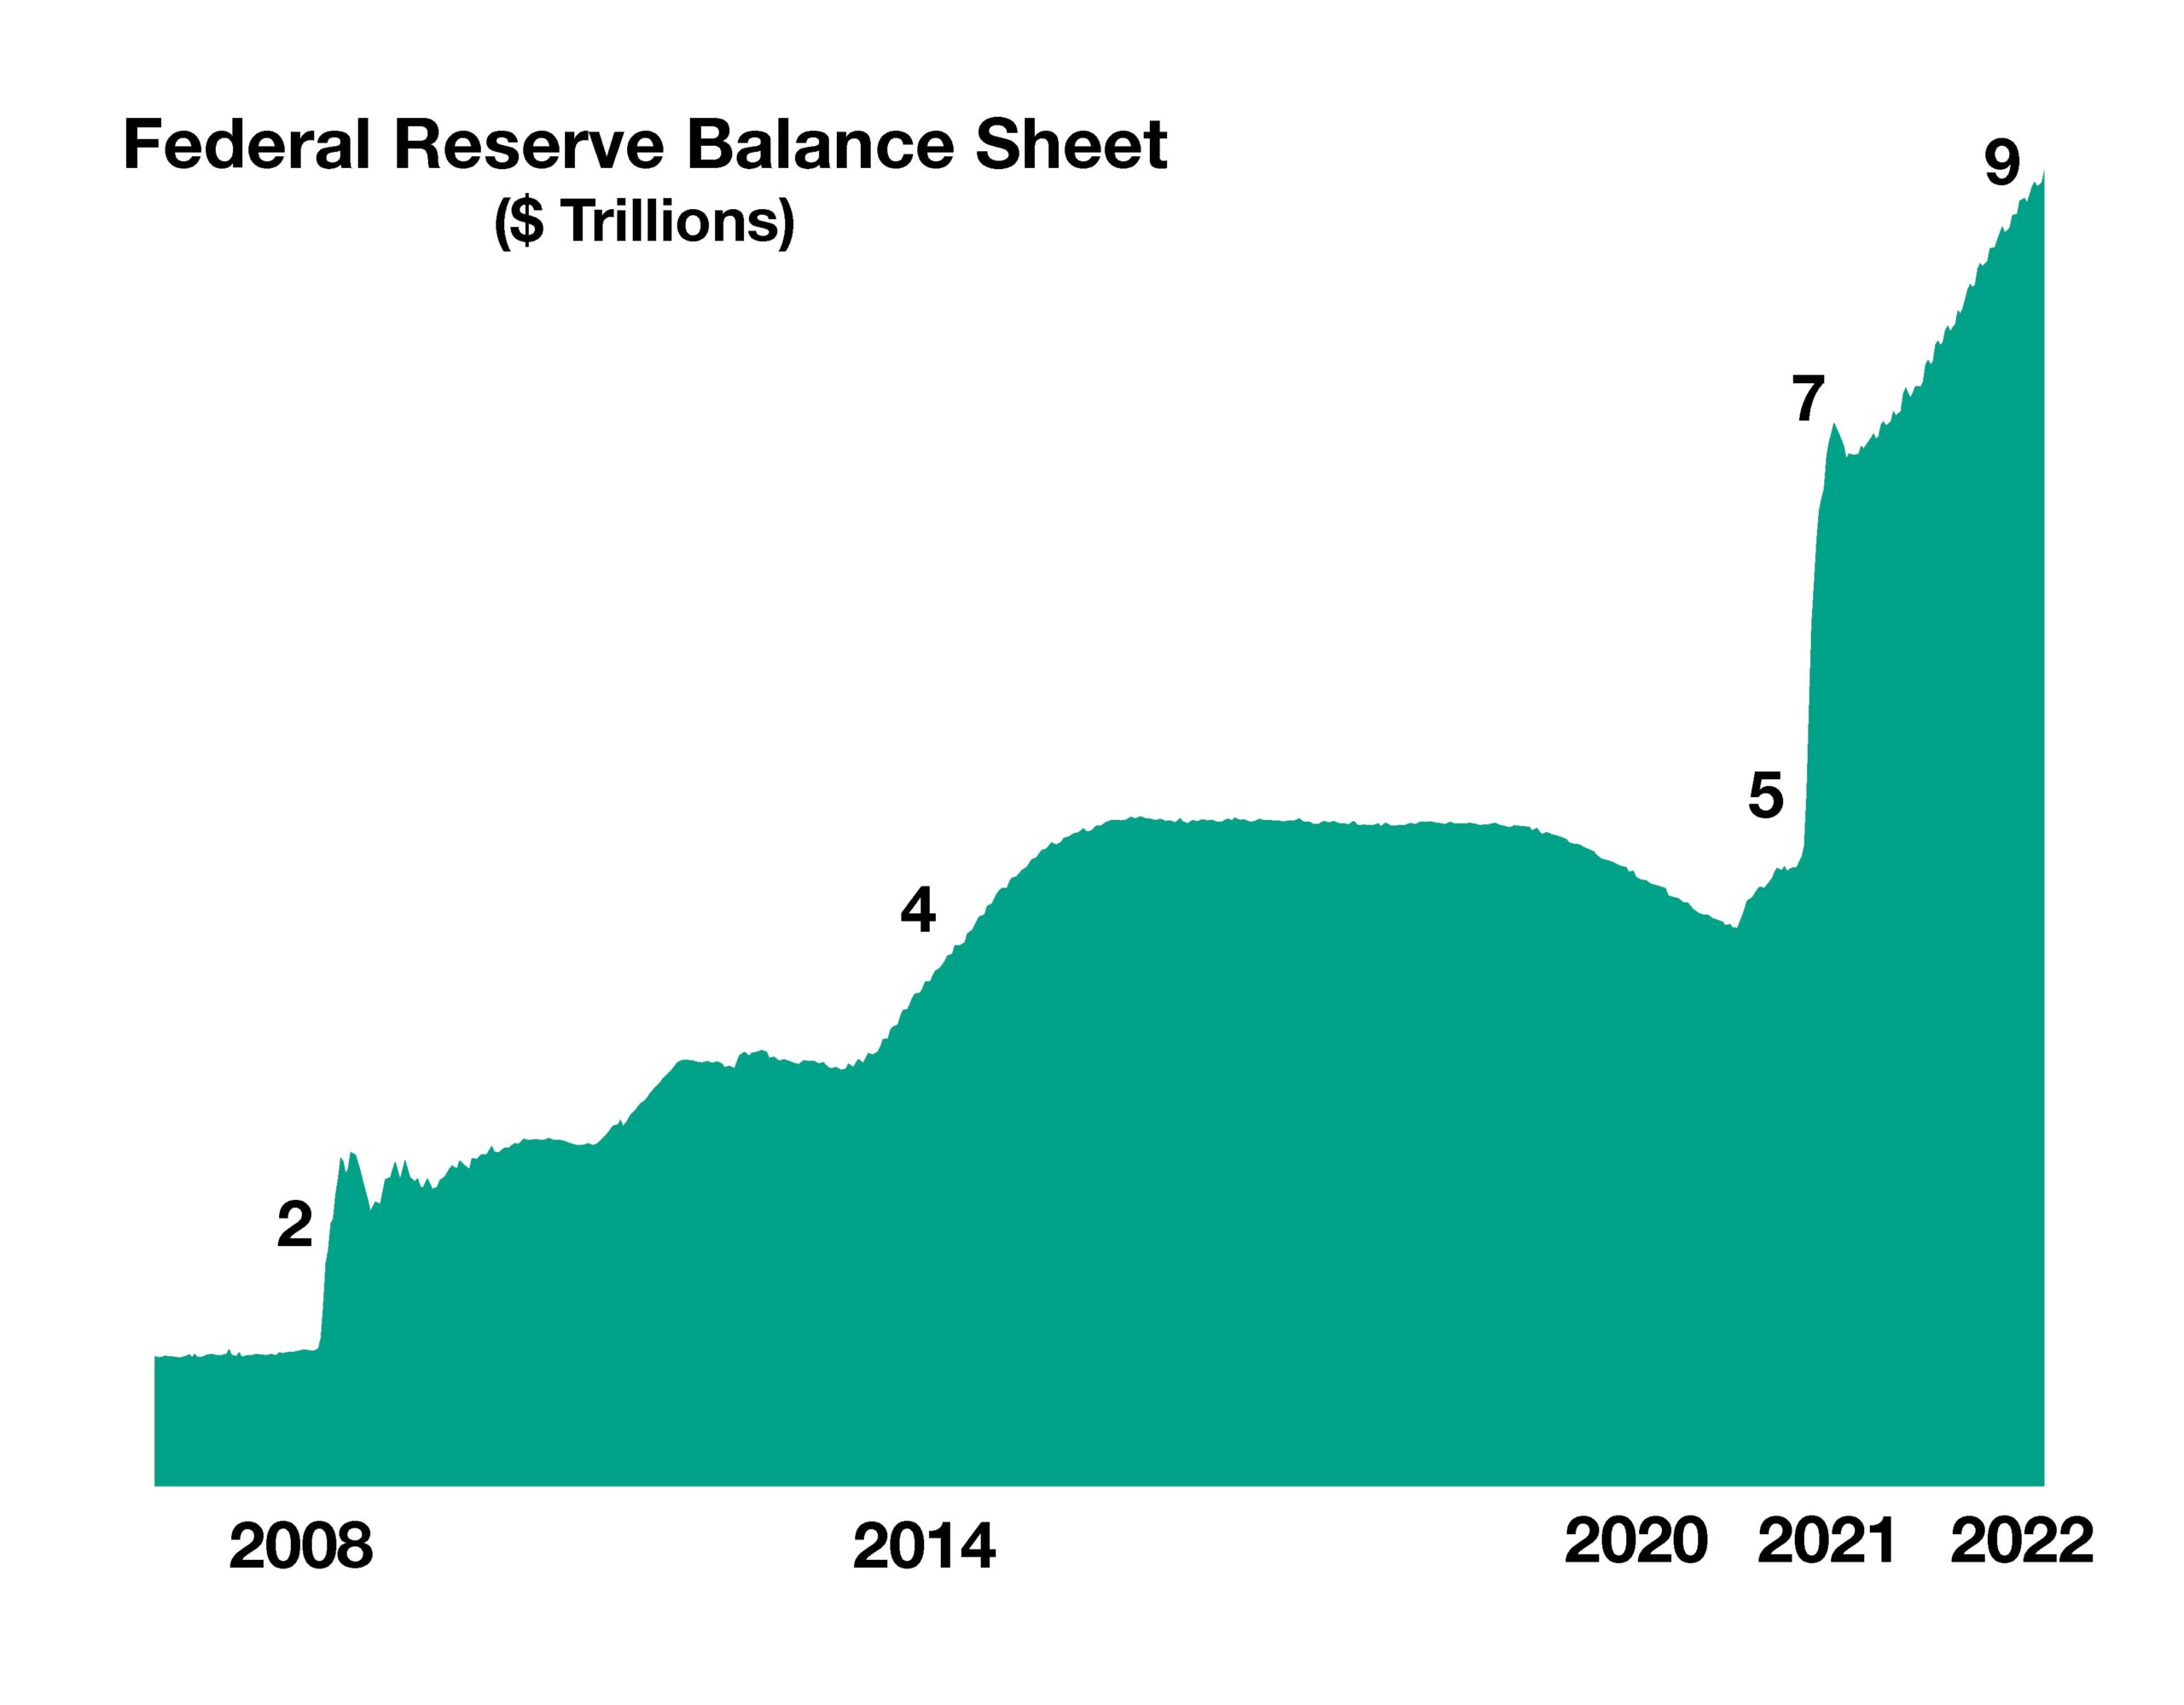
Market dynamics are shifting as the Federal Reserve outlines its execution of ending monetary stimulus in order to squash inflationary pressures.

Analysts and economists are expecting market volatility to continue as the Federal Reserve prepares to embark on its interest rate increase initiative. Some believe that the Fed will successfully pull off a series of four possible rate increases this year culminating in a “soft landing” whereas a rise in rates to control inflation doesn’t stifle economic expansion.

Inflation reached the highest level in 40 years, annualizing 7% at the end of 2021. Several analysts and economists believe that inflation may be peaking and may actually reverse course in coming months. It is also plausible that the Fed’s rush to raise rates simultaneously as pandemic stimulus funds have evaporated, may slow economic growth more than anticipated and ease inflation precipitously.

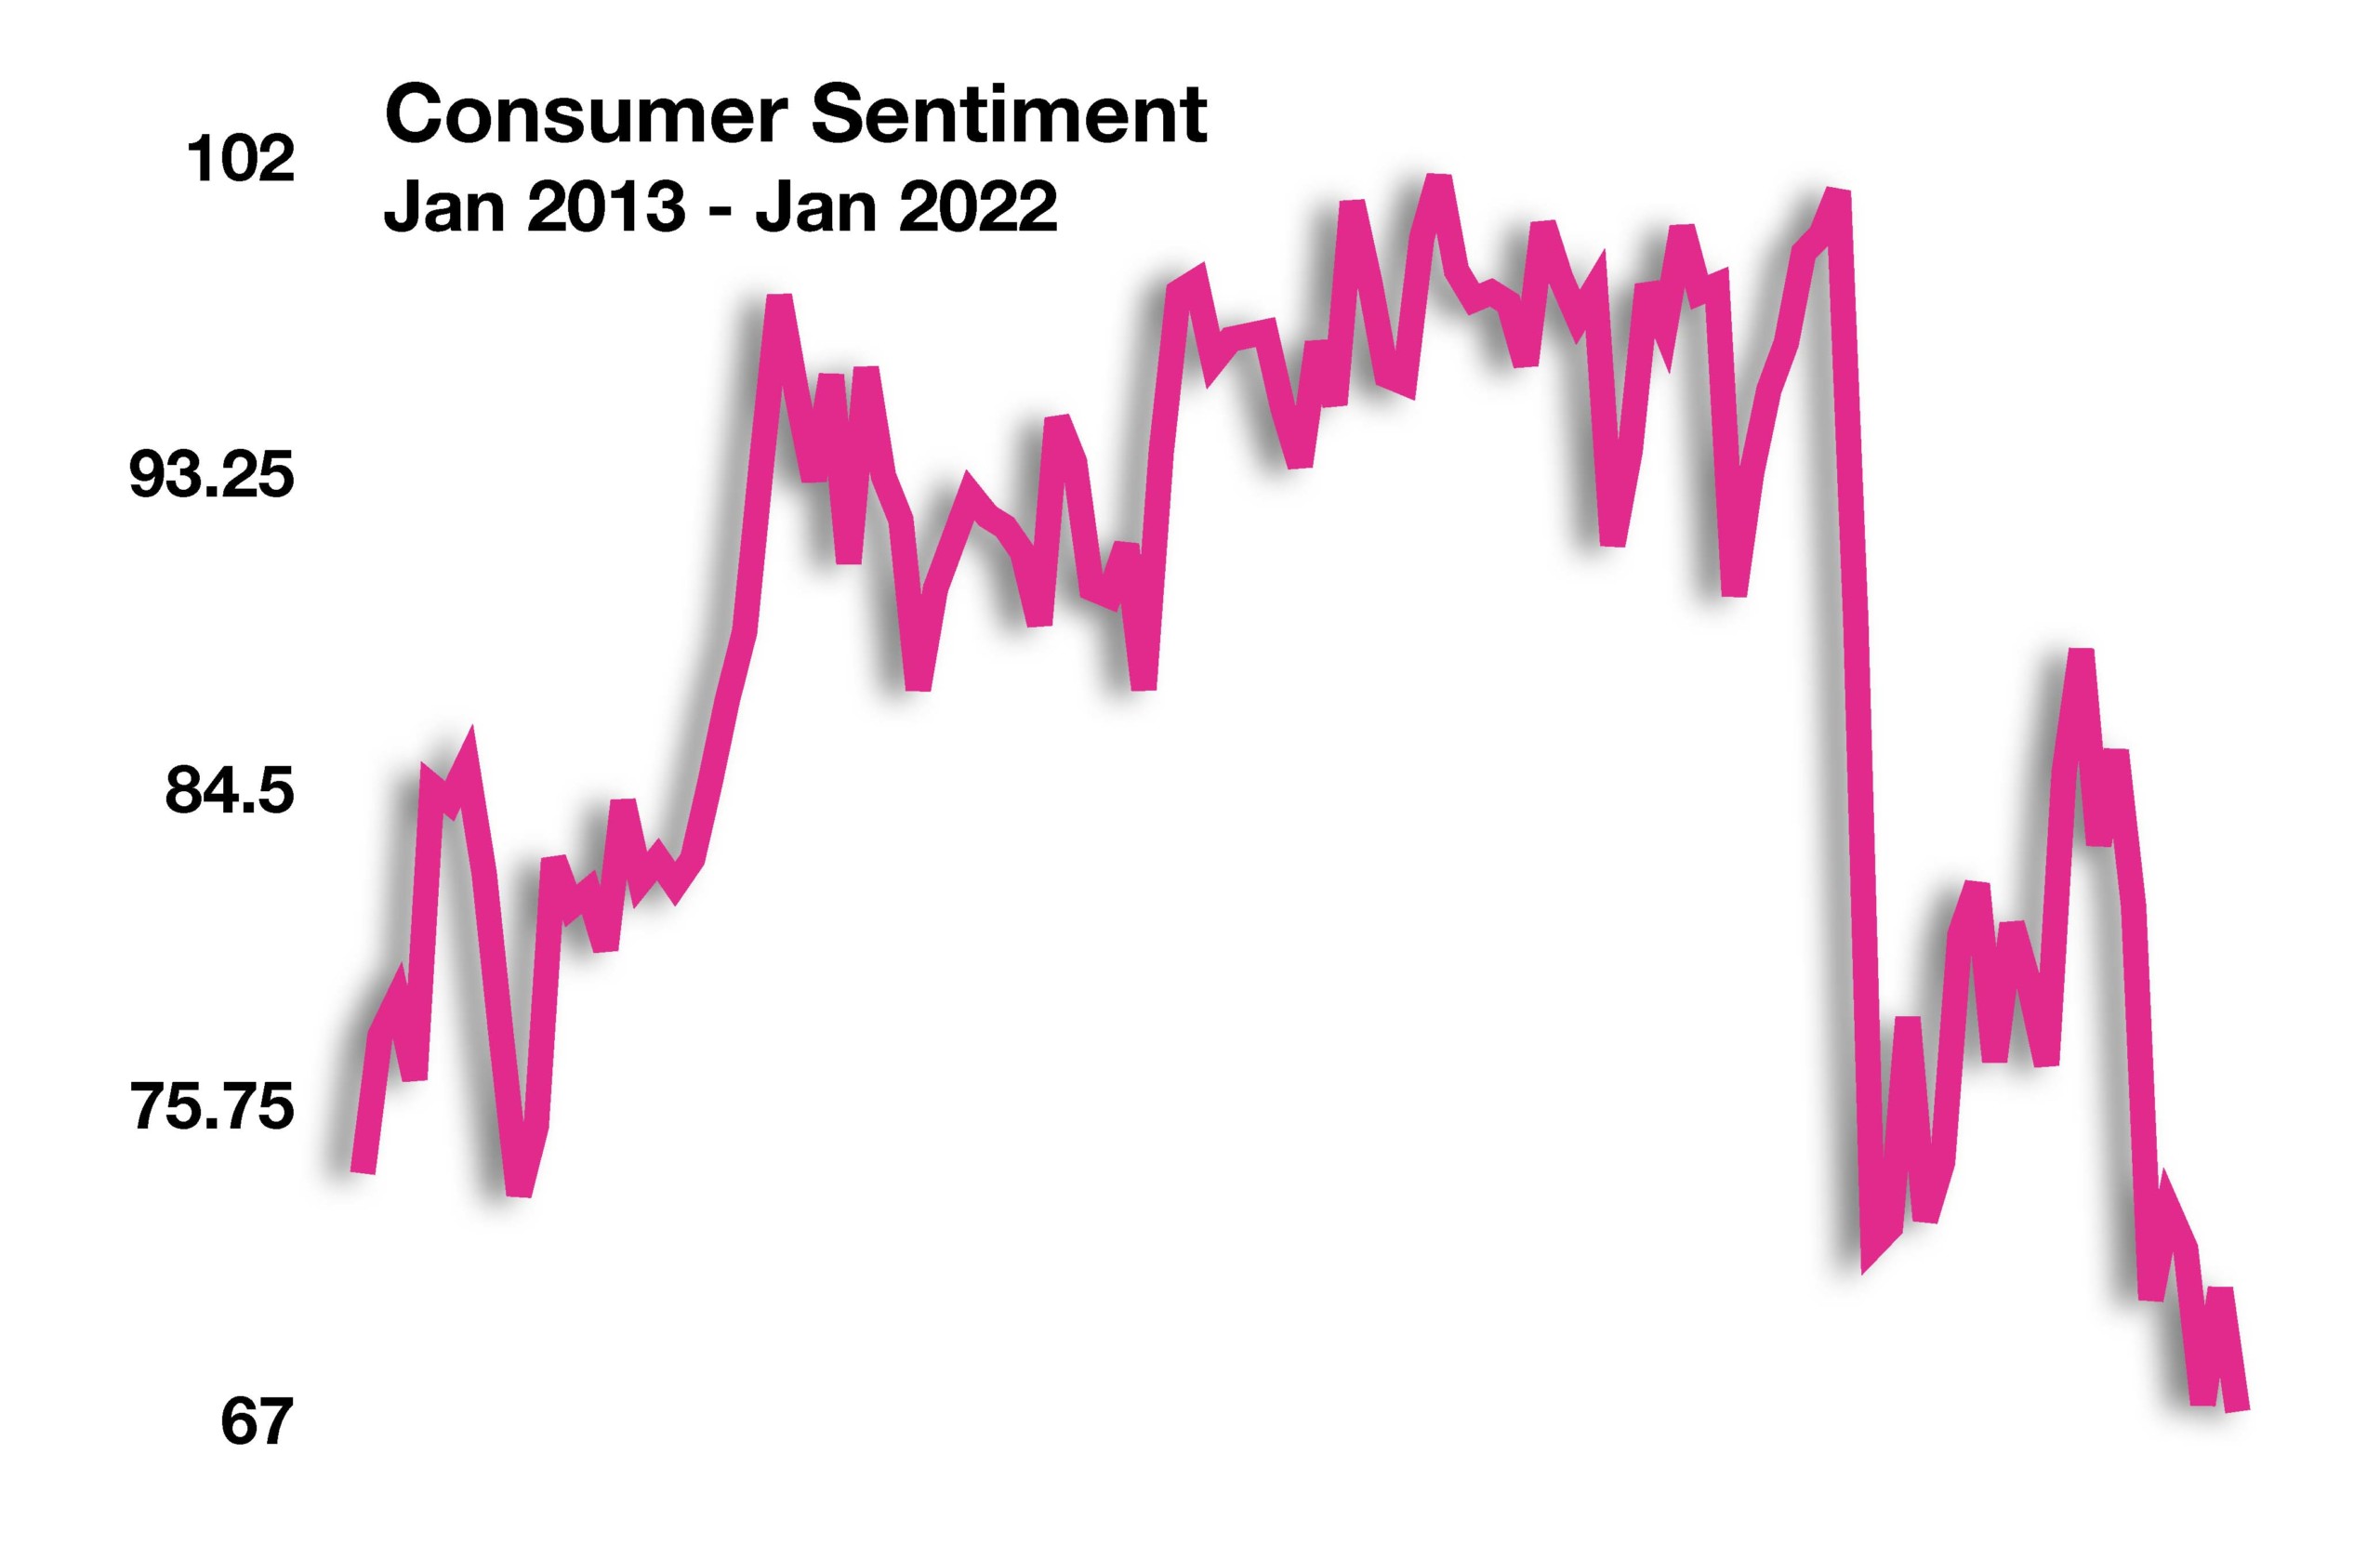
Supply constraints are still prevalent throughout the country, caused by multiple factors that neither the administration nor the Federal Reserve can alleviate. As higher prices evolve from the constraints, consumers modify spending behavior in order to accommodate inflationary tensions. The Atlanta Fed GDPNow model projects a substantial pullback in retail spending as consumers exhaust all remaining stimulus funds and minimize expenditures on costly discretionary goods.

Financial market volatility intensified in January, as geopolitical tensions coupled with expectations of an imminent Fed rate hike drove equity and bond prices in extreme directions. Major equity and fixed income indices saw price declines in January.

Crude oil prices posted their strongest January in decades as expanding global demand and limited supply propelled prices higher. Rising oil prices have also translated into rising gasoline prices nationwide, with some analysts expecting even higher prices heading into the summer months.

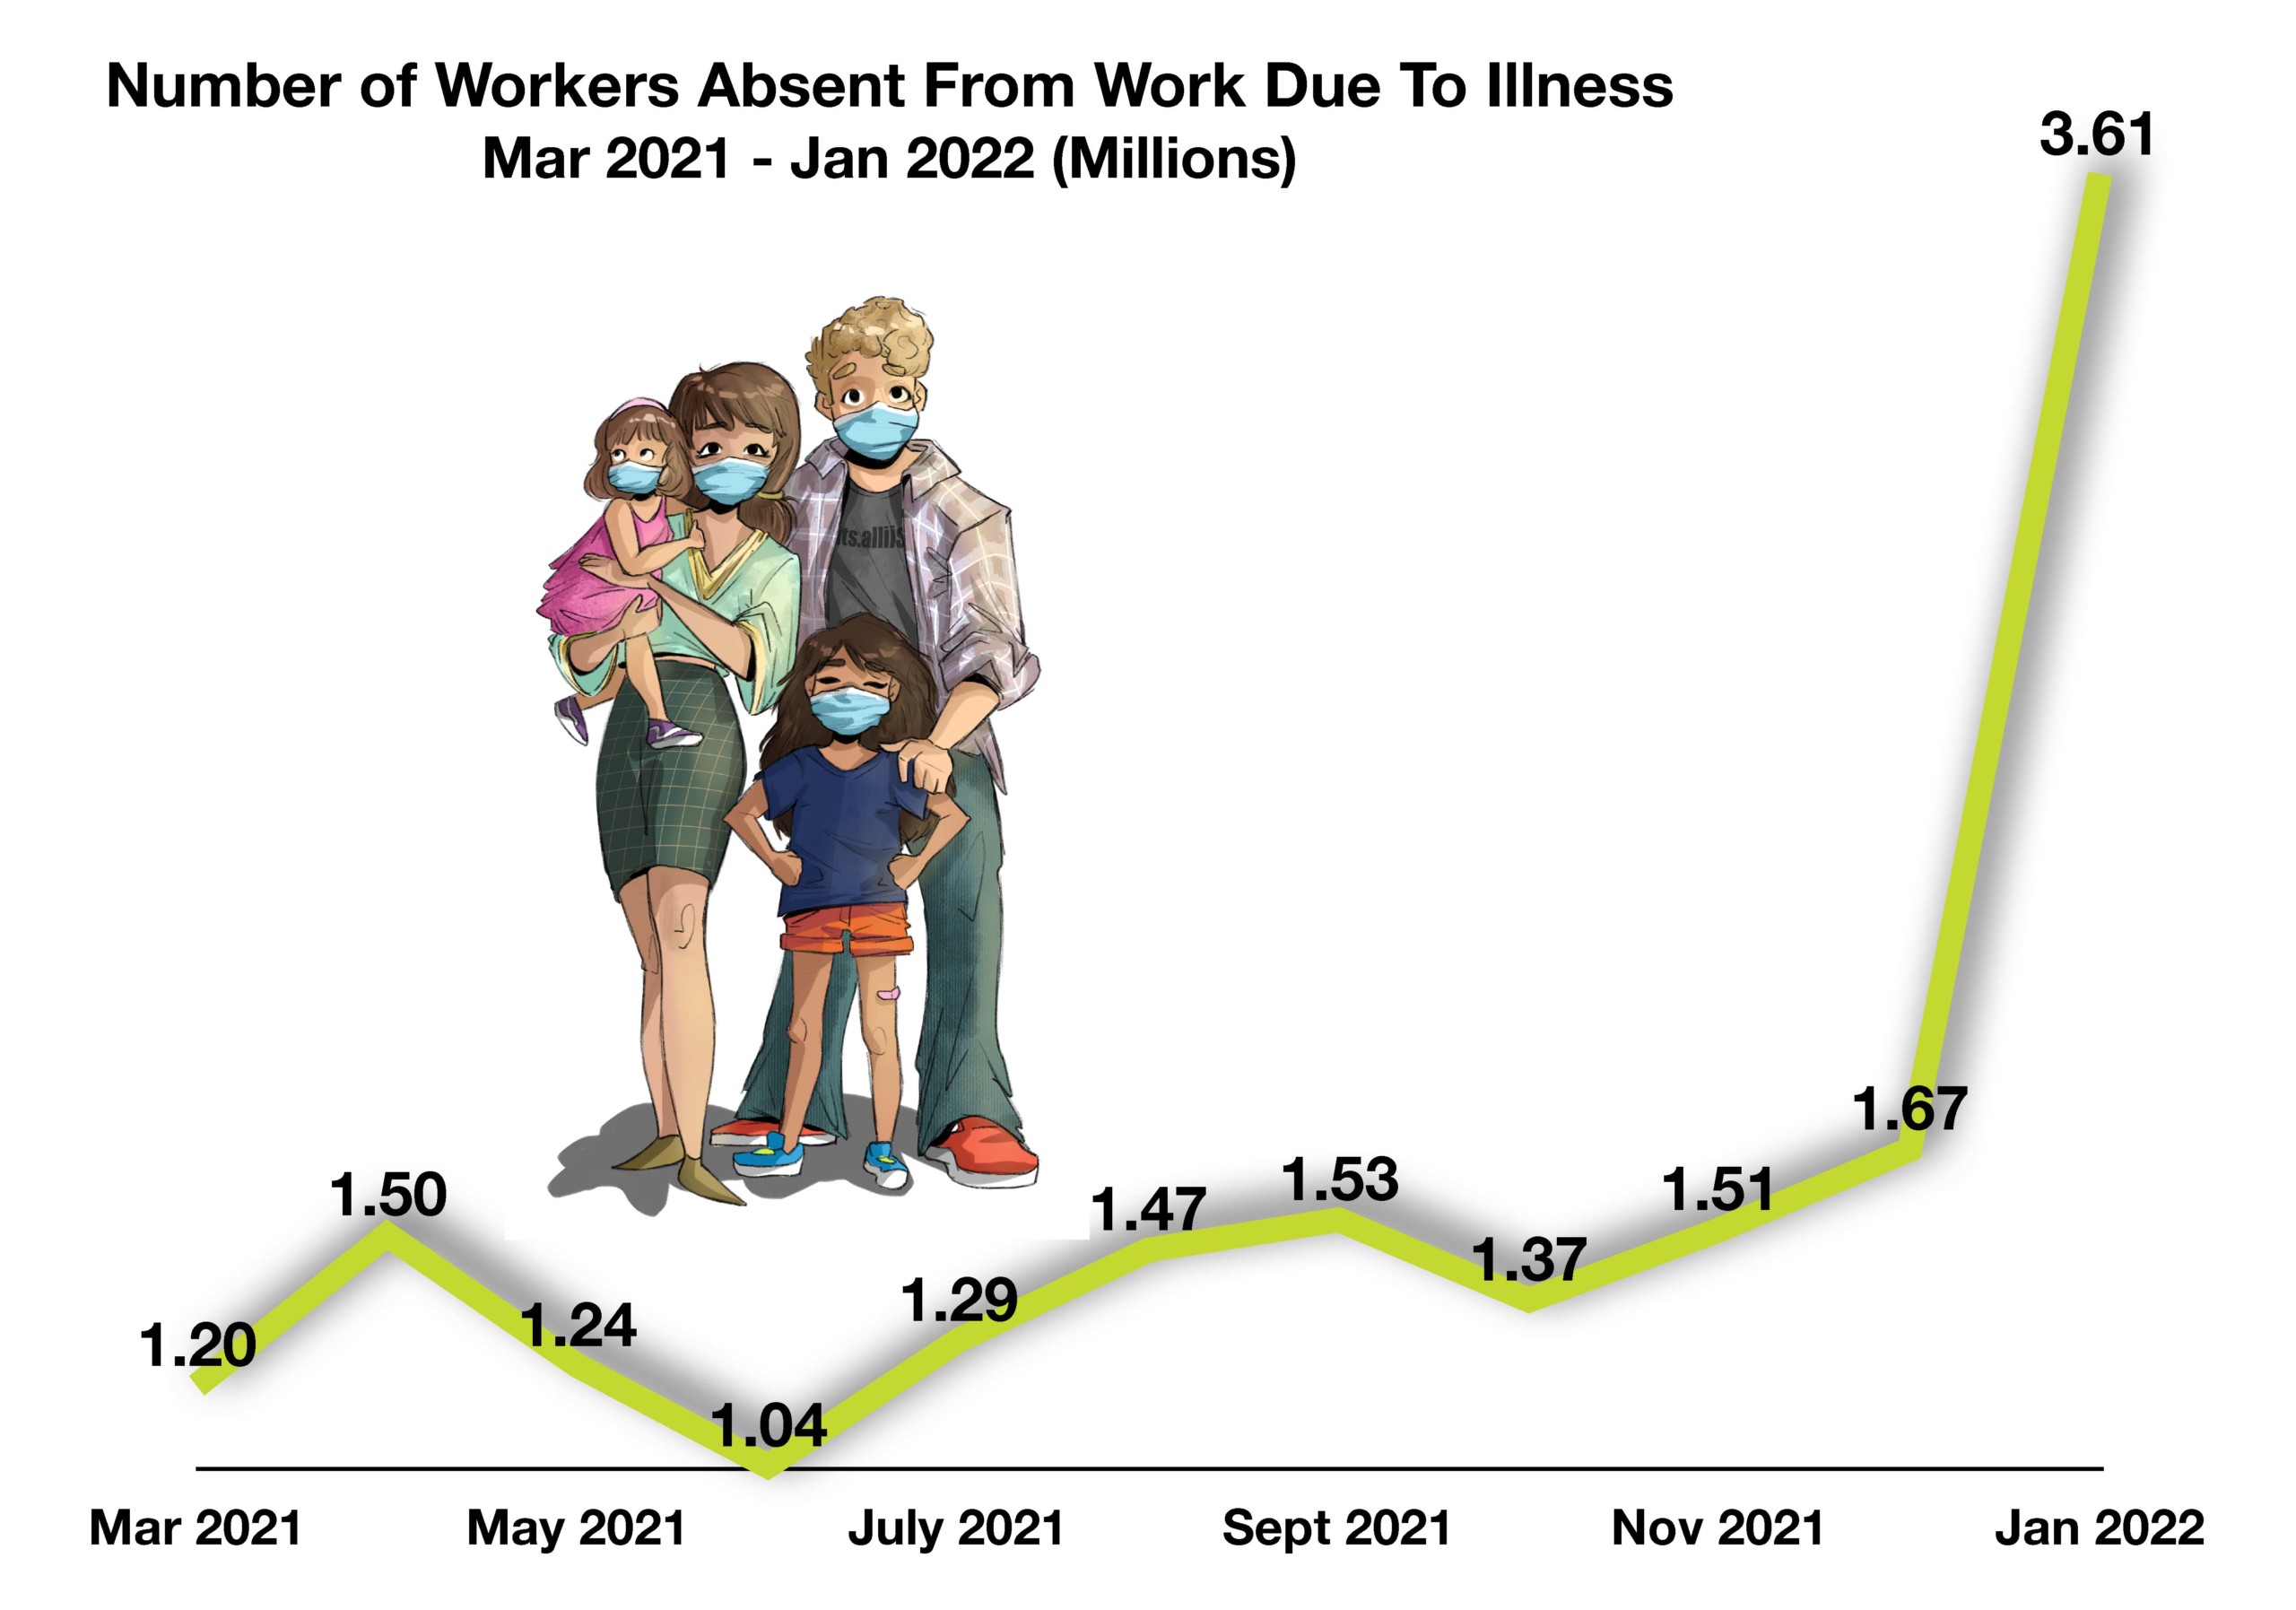
The Census Bureau, via its Household Pulse Survey, found that over 40% of unemployed individuals blame Covid related reasons for their unemployment. The same survey also identified that there were over 3.5 million workers absent from work in January due to illness, a record number. Labor market data has become a focal point for the Federal Reserve and financial markets, as distortions surrounding what the data is relaying about the actual economic health of the economy. (Sources: Fed, Labor Dept., www.census.gov/data/experimental-data-products/household-pulse-survey.html)

 
the consumer savings rate dropped to 6.9%, the lowest in 4 years

Rates Head Higher – Fixed Income Update

Interest rates continued on a gradual climb in January, with rates on key consumer loans such as mortgages, auto loans, and lines of credit all increasing. The Treasury yield curve flattened further in January, meaning that shorter term bond yields were closer to longer term bond yields. The 2-year Treasury bond yielded 1.18% at the end of January relative to the 10-year Treasury bond yield at 1.78%. Economists view a flat yield curve as the expectation of slowing economic growth.

Mortgage rates rose to their highest levels since the start of the pandemic, reaching a 3.56% average for a 30-year fixed rate mortgage, up from 3.29% at the beginning of March 2020. The 30-year average mortgage rate fell to 2.67% in December 2020, as the Fed aggressively bought mortgage bonds and placed them onto their balance sheet. (Sources: Treasury Dept., Fannie Mae, Federal Reserve)

Equities Have Rough Start of The Year – Domestic Stocks

Optimistic earnings expectations helped to reinforce equities following heightened volatility throughout January. Many analysts believe that recent earnings improvements are merely a result of stimulus driven growth for some companies. Equities saw their worst monthly performance in January since March 2020, as elevated volatility drove all major indices lower. The only two S&P 500 sectors ending positive for the month were energy and financials, with the real estate and consumer discretionary sectors having the largest pullbacks. Amazingly, the 12-month trailing returns through January 31st, were positive for all of the S&P 500 sectors. The so-called FAANG stocks now represent 25% of the S&P 500 Index encouraging some money managers to reconsider exposure to certain indices with such concentration. (Sources: S&P, Bloomberg)

Why Such A Drop In Consumer Savings – Consumer Behavior

Consumers are saving the lowest amount in four years as stimulus assistance funds and generous unemployment benefits have gradually evaporated, encouraging consumers to tap their savings at an accelerating pace. The drop in savings has also been prolific for those nearing retirement. As markets have pulled back, so have retirement fund values, elongating the retirement threshold for many. Savings rates rose dramatically in 2020 as billions of dollars in stimulus relief payments made their way into consumer accounts. Federal Reserve data found that households spent only 40 percent of their payments, used 30 percent to pay down debt, and saved about 30 percent on the initial round of stimulus payments. 
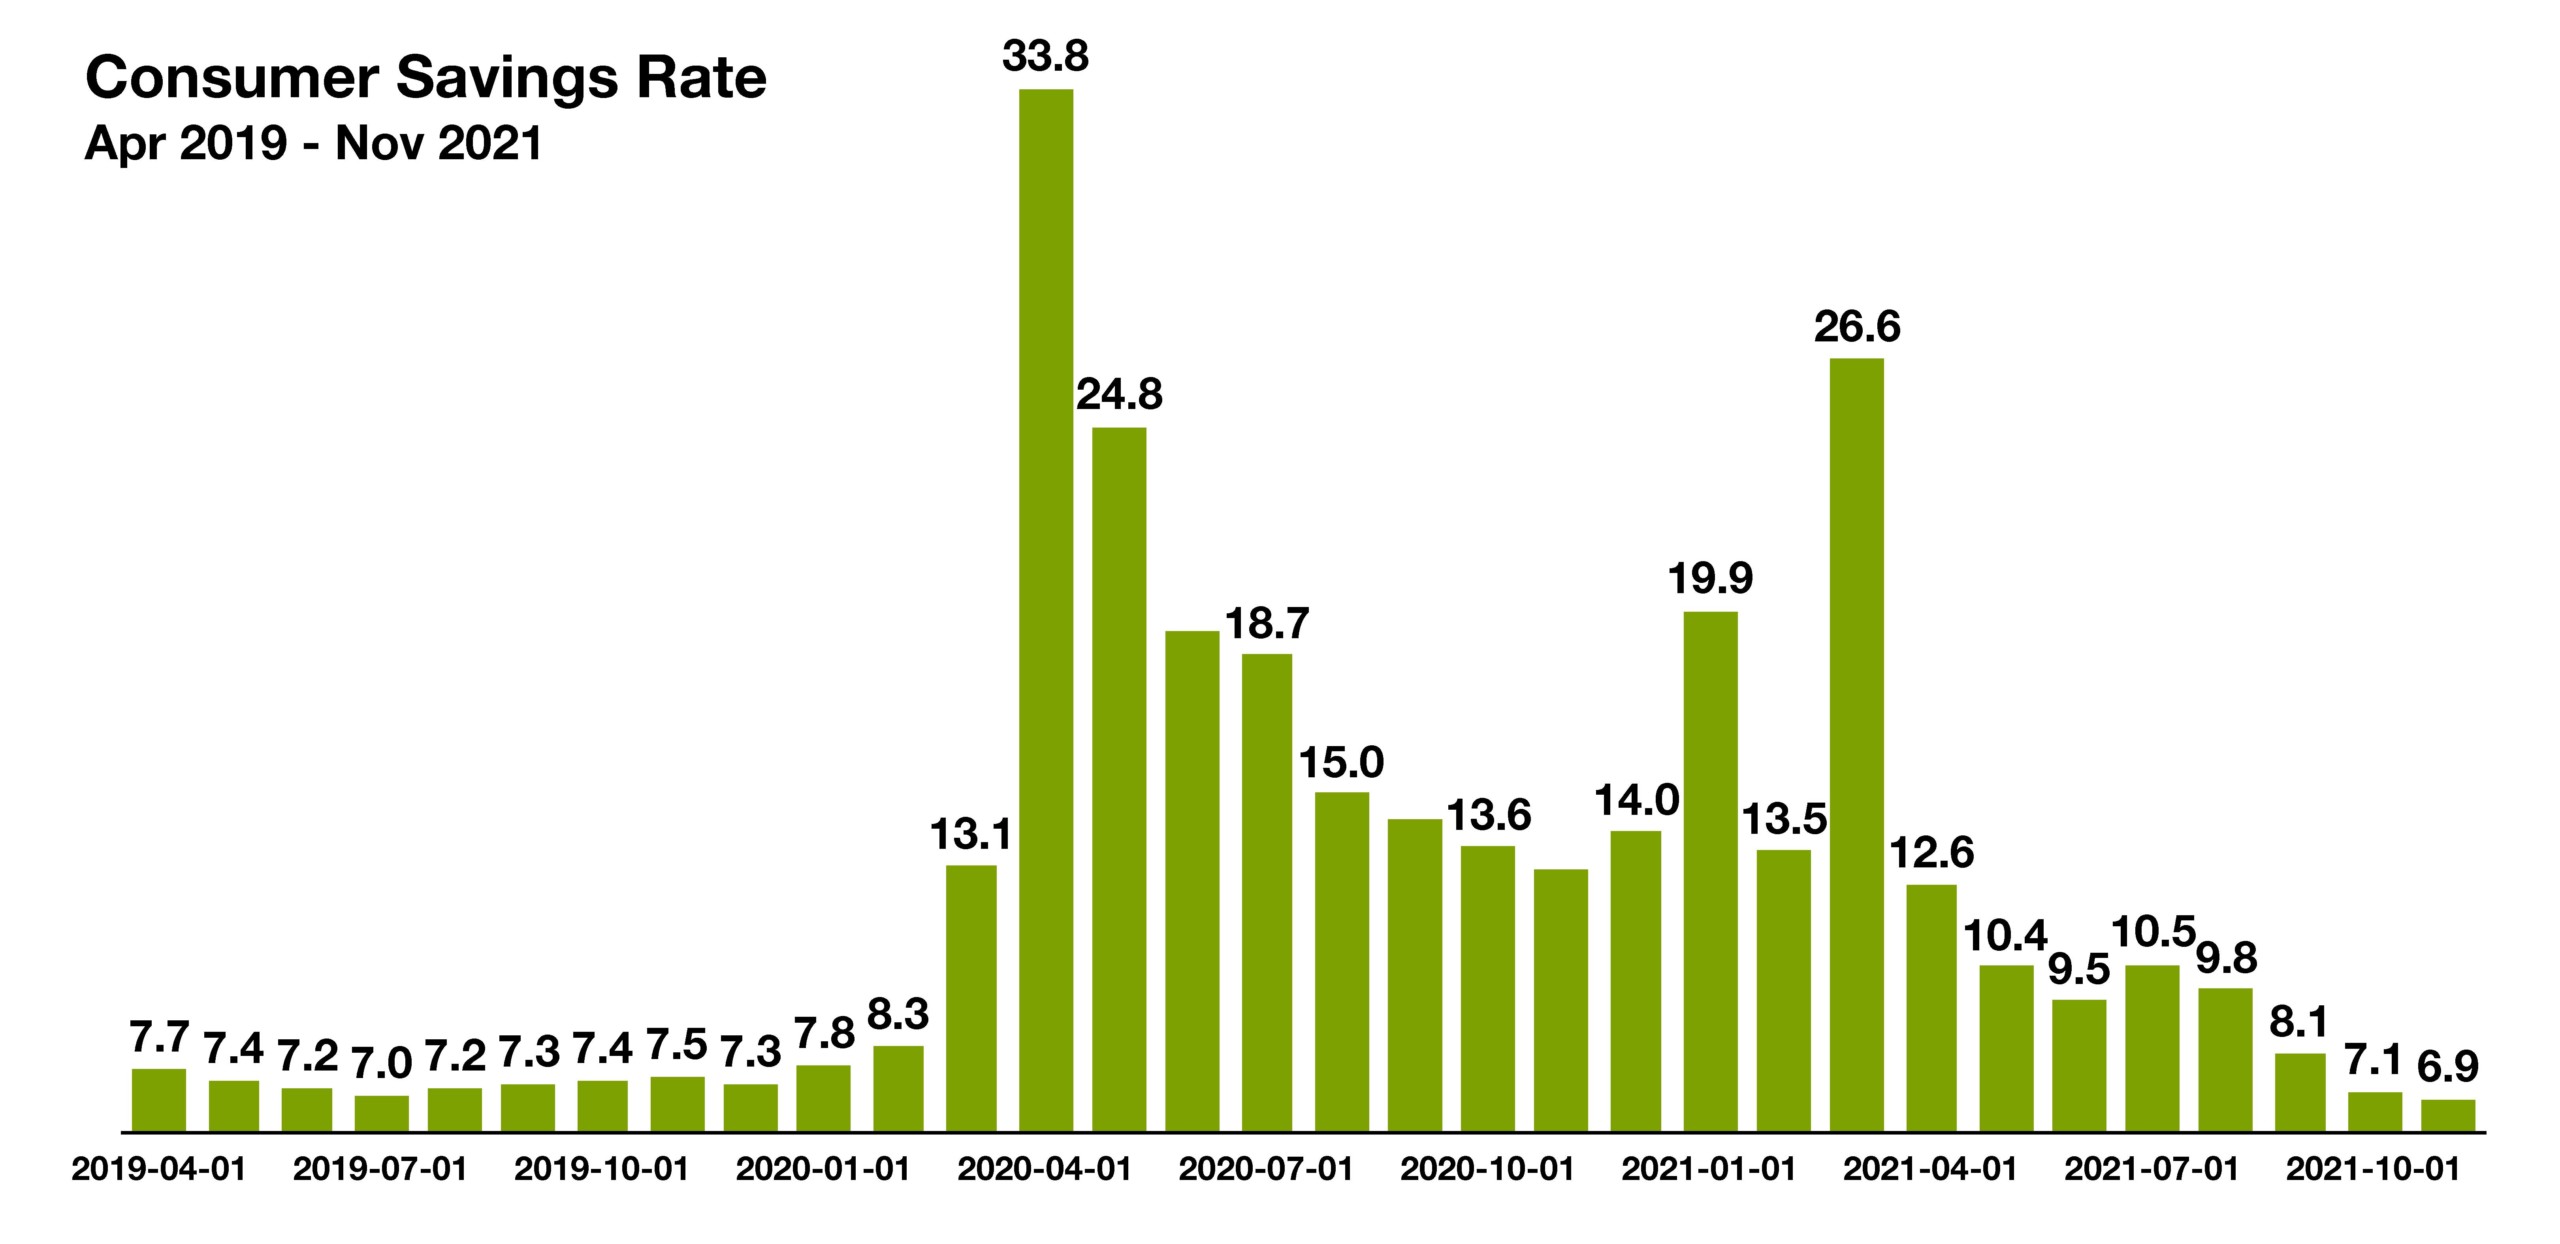
The most recent data show that the savings rate dropped to 6.9 percent in November 2021, lower than where it stood at roughly 7.5 percent before the pandemic began.

Sources: U.S. Bureau of Economic Analysis, St. Louis Federal Reserve Bank


the Fed balance sheet has grown from $888 billion in 2008 to over $8.8 trillion

What Is The Fed Balance Sheet & Why It Is So Consequential Now – Monetary Policy Overview

Like any large financially driven entity, the Federal Reserve maintains and modifies a balance sheet made up of assets and liabilities. The Fed uses the balance sheet as a monetary policy tool, meaning that it has the ability to cause rates to rise or fall by making adjustments to the balance sheet. The majority of the assets on the Fed’s balance sheet are U.S. Treasury bonds and mortgage bonds, which happen to be critical fixed income components within the U.S. economy.

Since the Federal Reserve has access to such massive amounts of capital, it can buy and sell enormous volumes of Treasury and mortgage bonds in the open market, thus controlling increases and decreases in supply nearly instantaneously. So by buying vast amounts of Treasury and mortgage bonds and placing them on its balance sheet, it is essentially removing supply from the markets, thus causing an increase in bond prices resulting in decreasing rates. Should it sell bonds from its balance sheet into the fixed income markets, then bond prices would fall with rates rising inversely.

The Fed announced that it intends to start shrinking its balance sheet once it has started increasing short term rates this March. The Fed balance sheet began to expand during the financial crisis of 2008, when it starting buying massive amounts of bonds in order to maintain liquidity in a rapidly deteriorating market, while also keeping rates low in order to help stimulate economic activity. The size of the Fed balance sheet has grown from $888 billion in mid-2008 to over $8.8 trillion this past month, the largest amount ever. (Source: Federal Reserve)

Consumer Sentiment Starting To Dip – Consumer Behavior Overview

Optimism following excessive monetary and fiscal stimulus efforts drove consumer sentiment to highs during the pandemic. Numerous stimulus programs provided businesses and individuals abundant funds in order to help maintain and fortify financial needs. As of the beginning of the year, the majority of these programs had exhausted benefits and paid out most if not all committed funds. As the availability of these funds have subsided, consumers have less to spend and thus feel less confident about spending what they have left. Some consumers have even resorted to tapping their savings as unemployment and pandemic benefit payments have become exhausted.

Data tracked by the University of Michigan Consumer Sentiment Index revealed that sentiment among consumers has been trending downward since the fall of 2021. The most recent release of the index was 67.2, the lowest reading since November 2011. The index essentially identifies how confident consumers are about spending on various items such as cars, sporting equipment, homes, furniture, and dining out. Index readings were fairly consistent and elevated from roughy 2017 until the start of the pandemic in March 2020. Sentiment did improve gradually following the release of stimulus funds in 2020 and 2021, but has since begun contracting as funds have depleted. (Source: University of Michigan: Consumer Sentiment Index)


the median sales price of houses nationwide has fallen to $408,100

Where Are Home Prices Headed – Housing Market Update

After rising consecutively every quarter since the middle of 2020, housing prices have started to pullback. Limited inventory, migration to rural areas, extended low mortgage rates, and material supply issues have all contributed to elevated home prices over the past two years. The most recent data available by the St. Louis Federal Reserve show a decrease in the median sales price of houses nationwide to $408,100 in October 2021, a drop from $411,200 the previous quarter.

Affordability has become a grave issue for younger home buyers, even with record low mortgage rates, as inflated prices have forced many to rent until prices retract.

As the Fed readies for a rate increase in March, it will also be selling millions of dollars in mortgage bonds from its balance sheet in order to help mitigate inflationary pressures. Many analysts believe that the Fed’s actions will directly influence mortgage rates to rise, possibly enough to stifle rising housing prices. A growing consensus seems to believe that housing prices will be pressured lower as additional inventory becomes available and as rates rise as the Federal Reserve undergoes its monetary policy initiatives.

Source: St. Louis Federal Reserve Bank