Ocean Park Capital Management

2503 Main Street

Santa Monica, CA 90405

Main: 310.392.7300

Daily Performance Line:  310.281.8577

January 2022
Market Update
(all values as of 06.28.2024)

Stock Indices:

Dow Jones 39,118
S&P 500 5,460
Nasdaq 17,732

Bond Sector Yields:

2 Yr Treasury 4.71%
10 Yr Treasury 4.36%
10 Yr Municipal 2.86%
High Yield 7.58%

YTD Market Returns:

Dow Jones 3.79%
S&P 500 14.48%
Nasdaq 18.13%
MSCI-EAFE 3.51%
MSCI-Europe 3.72%
MSCI-Pacific 3.05%
MSCI-Emg Mkt 6.11%
 
US Agg Bond -0.71%
US Corp Bond -0.49%
US Gov’t Bond -0.68%

Commodity Prices:

Gold 2,336
Silver 29.43
Oil (WTI) 81.46

Currencies:

Dollar / Euro 1.06
Dollar / Pound 1.26
Yen / Dollar 160.56
Canadian /Dollar 0.73

Portfolio Overview

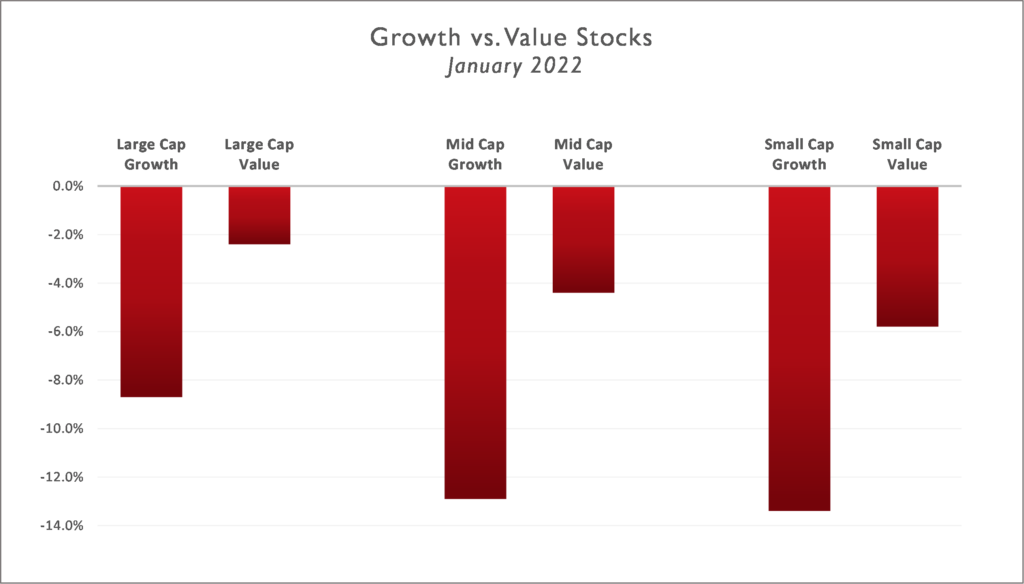
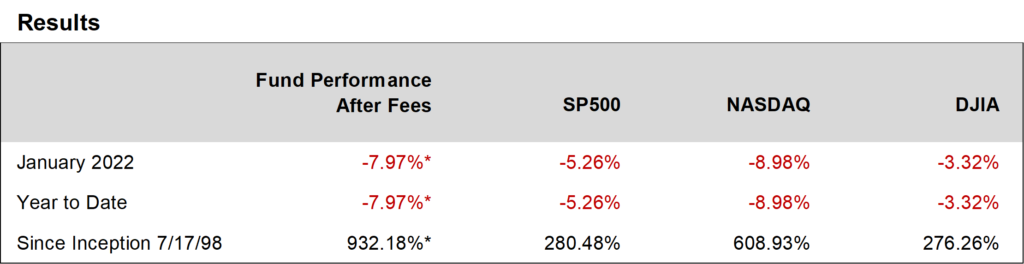
Ocean Park Investors Fund fell 7.97%* in January, while the S&P 500 fell 5.26% and the NASDAQ Composite fell 8.98%.  Growth stocks, particularly technology and consumer stocks, accounted for almost all of the losses.

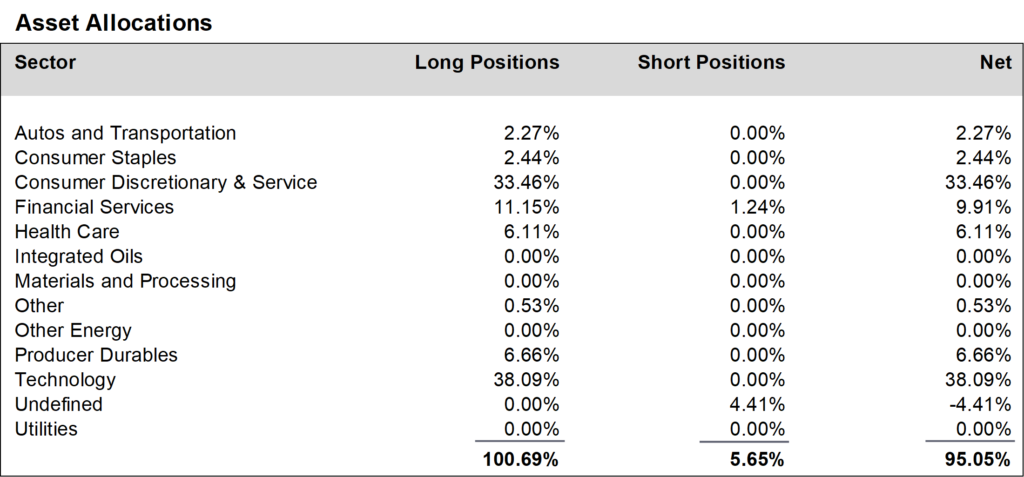
During January, we reduced positions in the health care sector and the consumer discretionary and service sector.  We also covered a substantial portion of our short hedges in the SPY and QQQ ETFs.  We finished the month at about 95% net long, up from about 92% in December.


Daily updates on our activity are available on our Results Line, at 310-281-8577, and current information is also maintained on our website at www.oceanparkcapital.com. To gain access to the site enter password opcap.

*These results are pro forma. Actual results for most investors will vary. See additional disclosures on page 4. Past performance does not guarantee future results.

 
Equity Overview

Equity Overview

Almost all sectors retreated in January except for financials which were essentially flat, and energy stocks which rose significantly as oil prices hit their highest levels since 2014.

Repeating the results in December, value stocks dramatically outperformed growth stocks in January.  Reflecting this trend, at mid-month 36% of NASDAQ Composite stocks were at least 50% below their 52-week highs.

Market volatility continued, as the S&P 500 moved by 1% or more on 9 of 21 trading days.  Intra-day volatility was severe, highlighted by the price action on January 24 when the S&P 500 fell 4% before recovering to post a fractional gain.

4th quarter 2021 earnings reported in January generally exceeded expectations.  With 33% of S&P 500 companies reporting, 77% beat consensus earnings estimates and 75% beat consensus revenue estimates—in both cases, above the five-year average but below the one-year average.  However, the aggregate size of earnings beats was relatively small:  4.0% above consensus versus a one-year average of 15.7% and a five-year average of 8.6%.


Macro Overview

Macro Overview

Economic data reported in January was mixed.  On the positive side, the Commerce Department reported that GDP rose 5.7% in 2021, the fastest pace since 1984, completely reversing the contraction of 3.4% in 2020.  On the other hand, the Bureau of Labor Statistics reported that the Consumer Price Index rose 7% in 2021, the fastest pace since 1982.  Employment numbers were also divergent:  unemployment fell to 3.9% but new jobs rose by only 199,000, well below expectations of 440,000.

Responding to the stubbornly high inflation statistics, the Fed telegraphed a likely interest rate hike in March, as well as a simultaneous end to its bond purchases.  It also suggested that it is preparing for significant asset reductions from its record $9-trillion balance sheet.


Additional Disclosures

Additional Disclosures

Performance data for OPI reflect the reinvestment of dividends and other earnings on the fund’s assets.  Performance data for the major indices reflect only changes in the value of those indices, and would be higher if dividends were included. However, the index data do not reflect fees that would be paid to index fund managers and transaction costs that would be incurred when their component stocks are bought or sold, while OPI’s data do reflect quarterly fees and expenses incurred by the fund.  The information provided is believed to be reliable, but its accuracy or completeness is not warranted. This material is not intended as an offer or solicitation for the purchase or sale of any stock, bond, mutual fund, or any other financial instrument. The views and strategies discussed herein may not be appropriate and/or suitable for all investors. This material is meant solely for informational purposes, and is not intended to suffice as any type of accounting, legal, tax, or estate planning advice. Any and all forecasts mentioned are for illustrative purposes only and should not be interpreted as investment recommendations.