Market Update
(all values as of 03.29.2024)

Stock Indices:

Dow Jones 39,807
S&P 500 5,254
Nasdaq 16,379

Bond Sector Yields:

2 Yr Treasury 4.59%
10 Yr Treasury 4.20%
10 Yr Municipal 2.52%
High Yield 7.44%

Commodity Prices:

Gold 2,254
Silver 25.10
Oil (WTI) 83.12

Currencies:

Dollar / Euro 1.08
Dollar / Pound 1.26
Yen / Dollar 151.35
Canadian /Dollar 0.73
 

Has the Trump Rally Stalled?

Last week the stock market experienced its worst decline (S&P 500 declined by 1.4%) since President Trump won the election back in November.  While the market rarely goes up or down in a straight line, investor optimism and euphoria led many to say, “this time it is different”.  The recent stock market decline was not driven by a tweet or terrorist attack, but the common consolidation that occurs during bull markets cycles.  The Investment Committee at Shamrock has cautioned that a correction could occur if many of President Trump’s campaign promises were not started within the Administration’s first 100 days in office.  We are currently 65 days into the Trump Administration and the stunning setback for health care reform shows the President could have some difficulty pushing his agenda forward.

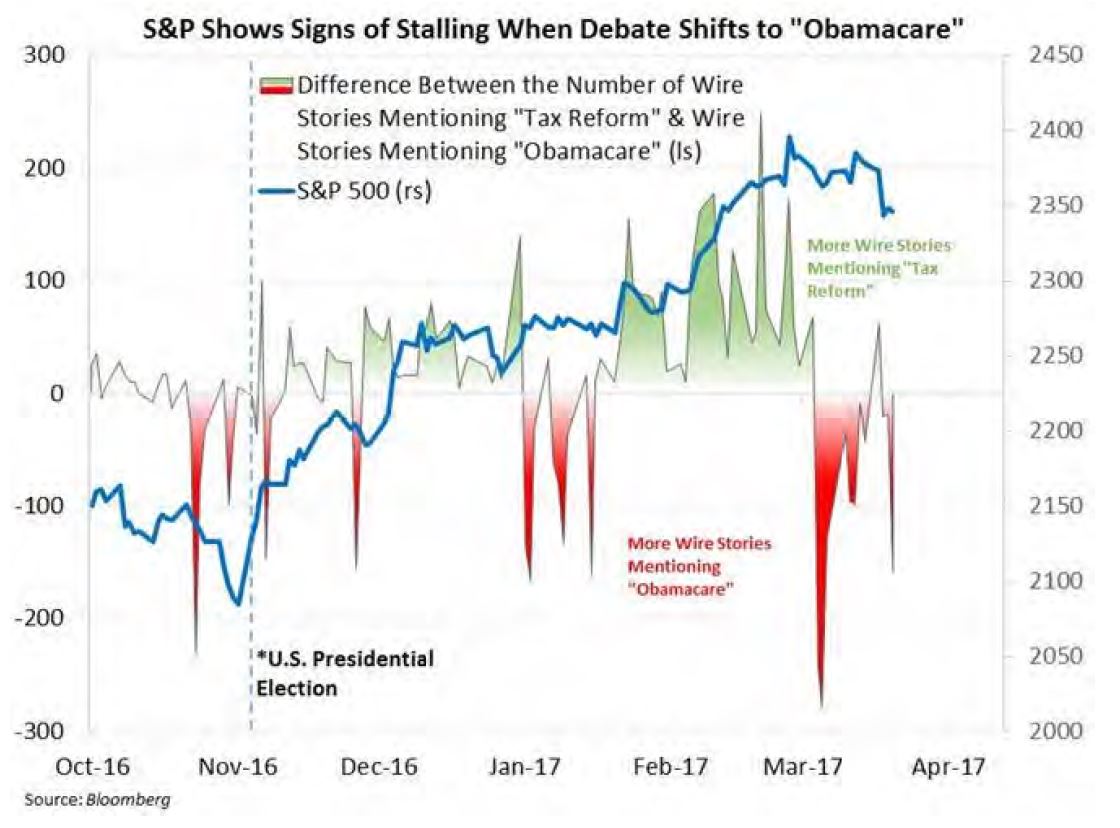
The stock market sold off when it appeared the Healthcare bill was not going to have the votes needed to pass.  It is clear health care reform was not market friendly, while tax reform is.  Tax reform is the single most important factor for U.S. equity investors and will have the most meaningful impact on driving the markets higher.  The following chart displays the market direction when the media attention was focused on tax reform vs. health care reform.

The Trump rally, that has been fueled by his pro-growth plan, could be in jeopardy of stalling out if Republicans are unable to shift quickly to tax reform.  We still expect deregulation, and infrastructure spending, and tax reform to push the market higher; but if legislation is delayed until 2018, a five to seven percent correction could occur this summer.  Our tactical strategies have already started taking some risk out of the US equity sleeve, removed commodity exposure, and allocated more to international equities where valuations are more attractive and offer greater upside opportunity.


Active management allows Shamrock to quickly shift portfolio allocations from an aggressive stance to a more conservative allocation if the risks of a substantial decline are elevated.  Our indicators are not signaling that a recession is imminent; however, the likelihood of a market pullback has increased.  Any meaningful stock market consolidation from these levels would be viewed as an opportunity to get the tactical strategies closer to fully invested.

The economic indicators we review are all pointing to a global economy that is picking up momentum.  US consumer confidence remains at multiple year highs and we are seeing manufacturing activity in the Eurozone growing at its fastest pace in six years.  Shamrock would not be surprised to see international equities outperform US equities this year.  We recommend that clients revisit their overall US/International equity allocation to determine if a rebalance is long overdue.  Selling US equities, that have outperformed for years and have become expensive relative to international equities, is a great way to lock in gains and reinvest the proceeds into less expensive asset classes.

It is easy to forget that different markets do well at different times and that market leadership rotates and can last for long periods.  Below is a table that highlights the annualized returns and time periods for three indexes, US equities (S&P 500), small cap US equities (Russell 2000), and international equities (MSCI EAFA).

Jan 1995 – Oct 1995 Nov 1999 – June 2004 Jul 2004 – Jun 2008 July 2008 – April 2014 May 2014 – Dec 2016
( 4 Years, 10 Months) ( 4 Years, 8 Months) ( 4 Years) ( 5 Years, 10 Months)
S&P +27.6% R2K +8.5% EAFE +13.1% R2K +10.3% S&P +9.0%
R2K +13.4% EAFE –1.6% R2K +5.2% S&P +9.2% R2K +8.8%
EAFE +10.5% S&P –2.3% S&P +4.9% EAFE +2.3% EAFE –2.6%

Economic growth and corporate earnings provide the best indicators for stock market returns.  After years of contraction, our indications are pointing to economic actively that is picking up steam in Europe and Asia.  From a valuation standpoint, international equities are substantially cheaper than their US counterparts and thus offer a larger margin of safety.  The stage is set for international equities to take the lead as a result of continued monetary support, weak currencies, low commodity / energy prices, fiscal stimulus, and favorable valuations.

Shamrock does not believe the recent peak in equity prices signaled the end of the Trump rally.  Economic news, European elections, Russian scandals, and religious instability in the Middle East will result in a stock market that is much more volatile in 2017 compared to the last 5 months.  We expect 1st quarter 2017 corporate earning to be stronger than anticipated and will help drive the market higher this year.