Dow Jones | 34,098 |
S&P 500 | 4,169 |
Nasdaq | 12,226 |
2 Yr Treasury | 4.04% |
10 Yr Treasury | 3.44% |
10 Yr Municipal | 2.36% |
High Yield | 8.19% |
Dow Jones | 2.87% |
S&P 500 | 8.59% |
Nasdaq | 16.82% |
MSCI-EAFE | 10.28% |
MSCI-Europe | 13.87% |
MSCI-Pacific | 3.86% |
MSCI-Emg Mkt | 2.16% |
US Agg Bond | 3.59% |
US Corp Bond | 4.29% |
US Gov’t Bond | 3.82% |
Gold | 1,999 |
Silver | 25.33 |
Oil (WTI) | 76.63 |
Dollar / Euro | 1.10 |
Dollar / Pound | 1.24 |
Yen / Dollar | 133.79 |
Canadian /Dollar | 0.73 |
Macro Overview / Year In Review
A year-end equity rally induced by a Trump victory lost momentum towards the end of December as doubts surfaced regarding Trump’s success in garnering support for his proposals from both Republicans and Democrats in the House and Senate.
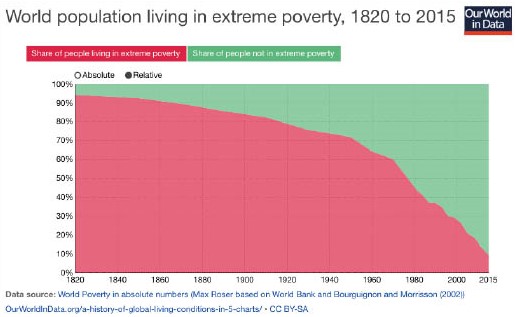
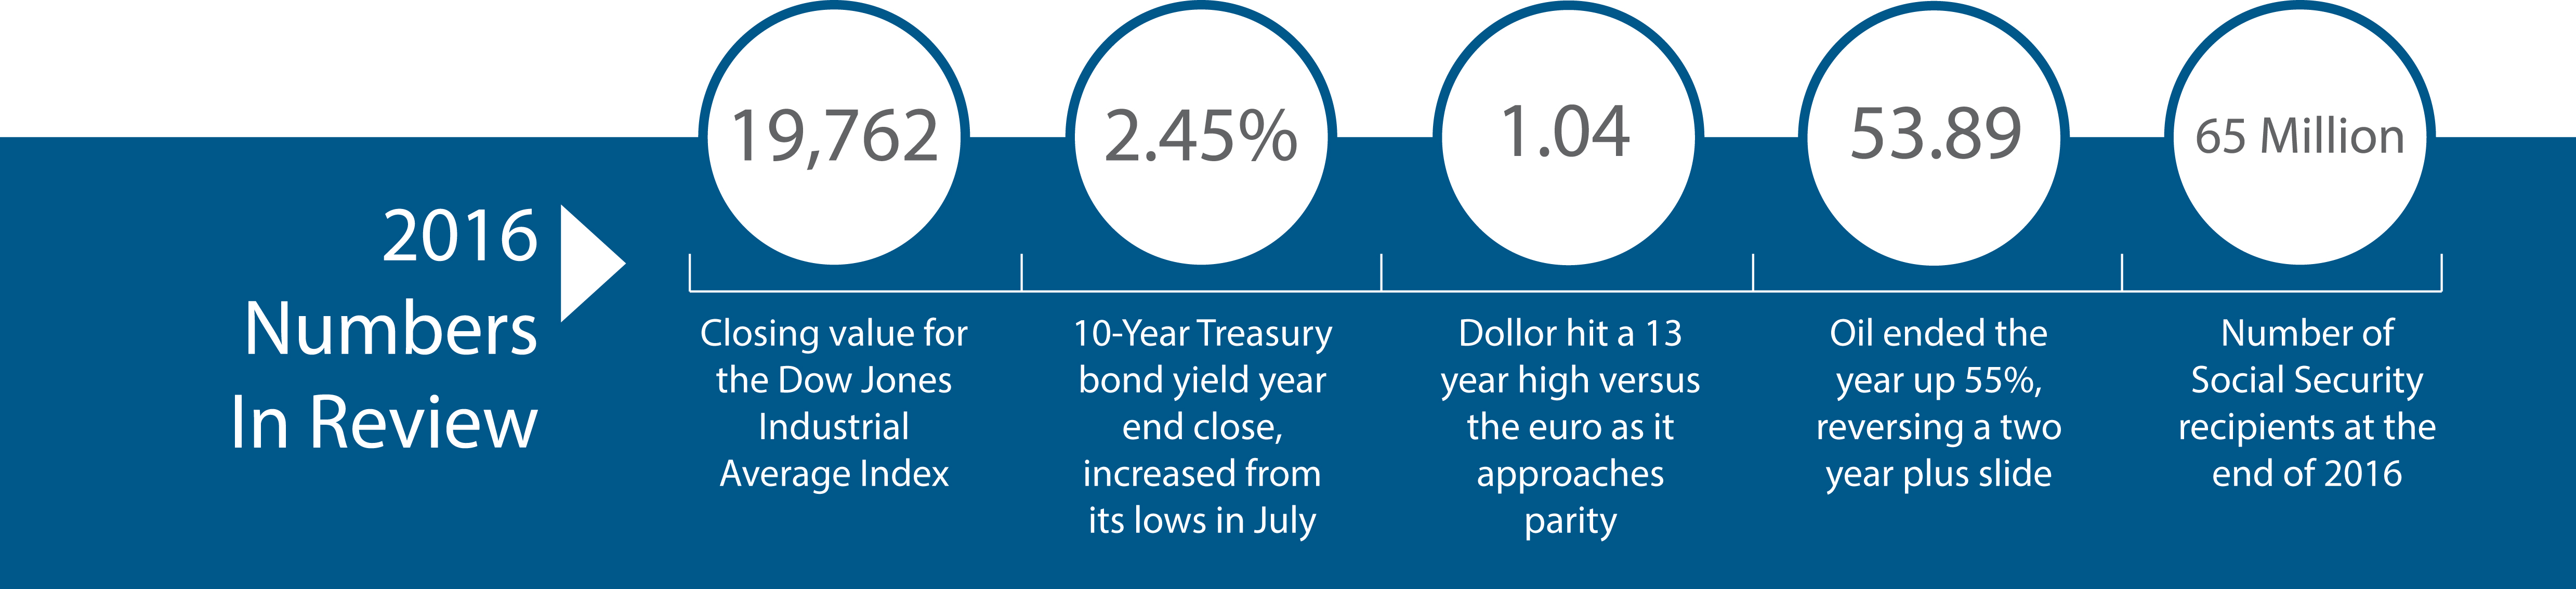
Two thousand sixteen was laden with uncertainty surrounding rates, growth, oil, the election, and Brexit. The S&P 500’s 15% drop in February proved to be temporary, as did the 10-Year Treasury Bond yield drop to 1.36% in July following Britain’s vote to leave the EU. As many times before, the market’s resilience carried it out of negative territory and onward to positive gains.
Oil also made a powerful comeback in 2016, rising from $26 a barrel in February to $53 a barrel at year-end. The rise in oil prices was a result of OPEC production cuts and an abundance of production coming from U.S. producers, helping lead the U.S. towards energy independence.
Equity markets pulled back at year-end as a gradual shift from equities to bonds took place, encouraged by the recent increase in bond yields, making fixed income attractive relative to a couple of months ago. A traditional rebalancing occurs at the end of each year, either shifting assets away from stocks to bonds or from bonds to stocks. This occurs as multi-billion dollar pension funds reallocate asset classes as expectations adjust.
The U.S. dollar had strong gains against various major currencies in 2016. Clarity surrounding the Fed’s decision to start raising rates along with anticipated growth expectations from Trump’s policies have catapulted the dollar. Both the anticipation of higher rates and a growing economy can help send currencies higher.
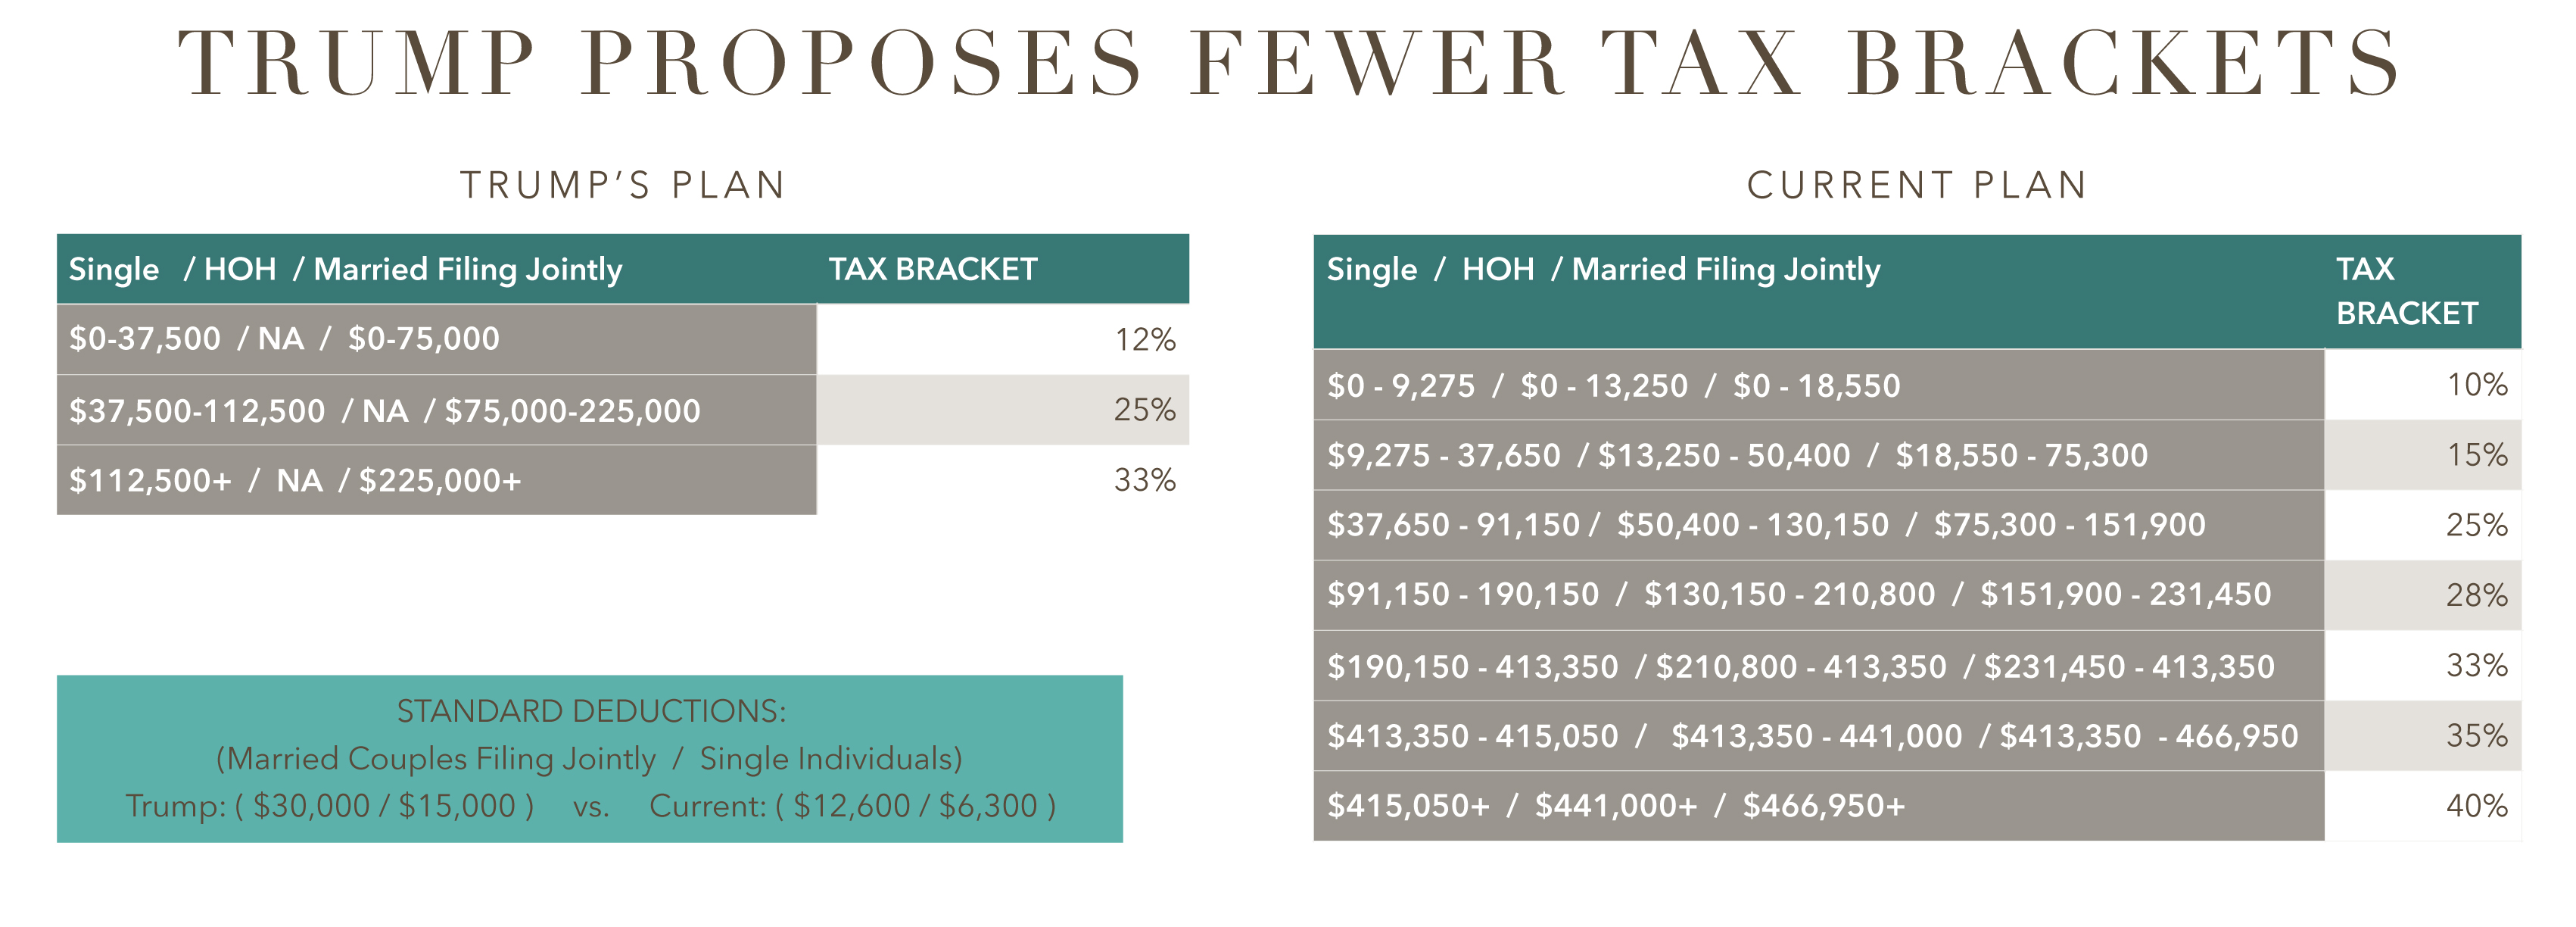
A number of banking and financial industry regulations are in question as Trump is expected to repeal various rules and provisions that many believe have hindered lending and consumer credit expansion. Trump will have the ability to repeal numerous rules and regulations almost immediately under the Congressional Review Act (CRA). The possibility of political hurdles and non-approvals for some of Trump’s appointments may cause uncertainty leading to volatility in the markets.
Two well regarded barometers of consumer confidence rose in December to higher levels. The University of Michigan’s preliminary consumer confidence index rose to 98 and the Conference Board’s Consumer Confidence Index rose to 113.7. Sentiment among U.S. consumers is critical to the health of economic growth as greater spending evolves from growing confidence. (Sources: Univ. of Michigan, Conference Board, S&P)
Equity Markets – Global Stock Market Overview
Despite starting 2016 off to a rough start, equity markets propelled towards the end of the year. The Dow Jones Industrial Average was up 13.42%, the S&P 500 Index increased 9.54%, and the technology heavy Nasdaq Index gained 7.5% for the year.
Because fiscal and regulatory changes expect to engulf the markets in 2017, the environment has evolved into a stock pickers market. The search for specific companies in specific sectors that may benefit from fiscal and regulatory changes is considered superior to just buying a passive index of broad stocks.
The potential for economic growth due to a combination of personal and corporate tax cuts, government spending, and less regulation could eventually boost earnings for stocks.
With U.S. companies having reduced expenses and minimized debt exposure over the past few years, any increase in profitability margins have become difficult. This is why revenue growth will be essential for many U.S. companies in 2017 while contemplating a higher dollar, lower tax rates, and fewer regulations.
A validation that we are heading into a stock pickers market is the decrease in correlation that has occurred among stocks. When stocks are highly correlated, it’s a sign that investors are all buying or selling the markets; but when correlation is low, it’s a sign that investors are buying or selling specific stocks for specific reasons. Recent dynamics such as a higher dollar, rising rates, and possible import tariffs have created obstacles for certain companies. Deregulation, lower corporate tax rates, and infrastructure spending have created new opportunities for a host of other companies. (Sources: S&P, Bloomberg, Reuters, Dow Jones)
Mortgage Rates Starting To Rise – Fixed Income Markets
The Fed raised short-term rates in December as expected by a quarter point to between 0.5% and 0.75%, the first increase since December 2015. The Fed also announced that it expects to raise rates three times in 2017 contingent on economic growth and inflationary pressures.
Optimism about economic growth has led to higher inflationary expectations, which eventually translates into higher interest rates. Over the past two months, the yield on the 10-year U.S. Treasury has increased from a historical low of 1.35% to 2.45% at the end of December. As a gauge for mortgage rates nationally, the increase in the 10-year Treasury has also led to an overall increase in mortgage rates. According to data made available by Freddie Mac, the average rate on a 30-year fixed mortgage loan increased from 3.44% in August to 4.32% at December’s end. The concern economists have is that as mortgage rates continue to increase, home sales and affordability may begin to be hindered. (Source: Bloomberg, U.S. Treasury)
Home Price Growth Rate Double Of Wage Growth Rate – Demographics
The onslaught of continued low interest rates has fueled the housing market to higher levels. In addition, a recent shortage of skilled housing workers has added to the industry’s stress as fewer homes have been built while lessening the supply of homes available for sale. Consequently, a growing demand for homes nationwide has propelled the growth rate in housing prices above the growth rate for wages. The concern is that home prices have been rising faster than wages, thus decreasing affordability for families across the country.
Should wages begin to grow at a faster rate than home prices, homes will become more affordable for buyers. Since the beginning of 2012, the House Price Index tracked by Freddie Mac, rose over 24% as of the third quarter of 2016. For the same period, the Wage Growth Index, compiled by the Bureau of Labor Statistics, grew just over 11%. (Sources: Freddie Mac, BLS)
Current Regulations, Acts & Agencies That May Change – Regulatory Update
Dodd Frank – An act signed into law in 2010 to regulate financial services and banking. Has become a burden to smaller community banks due to heightened rules and regulations. It has consequently made it more difficult for homebuyers to qualify because of strict requirements imposed.
Consumer Financial Protection Bureau (CFPB) – An agency formed in 2011 to protect consumers in the financial sector. Enacted as part of the Dodd Frank Act. The CFPB has been plagued by bureaucratic conflicts and ill experienced, overpaid employees since its inception, providing little benefit to consumers.
Volcker Rule – Enacted as part of the Dodd Frank Act. Restricts banks from trading their own bond portfolio for profit. Has led to less liquidity in the fixed income markets with banks not holding bond inventories.
Affordable Care Act (ACA) – Created as affordable health care for every American. Many believe that it just hasn’t worked.
Trans Pacific Partnership (TPP) – Free trade agreement with Asian and Latin countries promoting non-tariffs and lifting barriers to trade. Concern among many that it may not benefit the U.S.
North American Free Trade Agreement (NAFTA) – Free trade agreement with Canada and Mexico. Many argue that it has benefited Canada and Mexico at the expense of U.S. jobs.
Trump Tax Proposals – Fiscal Policy
Trump’s proposals aim to simplify taxes by reducing the number of brackets from the current seven to three. Some argue that this simplification may actually raise taxes for single filers, rather than lower them. The current brackets, which have been in place for sometime, scale up from 10% to 40% over seven brackets, while Trump’s brackets scale up from 12% to 33% over three brackets.
Affecting almost all taxpayers is the standard deduction, which Trump proposes to raise from $12,600 currently for married couples to $30,000. For wage earners that are employees and not self-employed, the standard deduction can be the sole and largest deduction on tax returns.
The tax exemption on municipal bond interest has been broached as a possible elimination and is a fairly contested subject. The loss of the municipal interest exemption could make municipal bonds less desirable, making it more difficult for local counties and state governments to raise capital. Hence, this has become a highly politically charged decision.
In addition to Trump’s tax proposals, the Republicans under the House plan, have proposals of their own. The question is, on which proposals will the Trump and the House plan overlap and disagree.
Both plans propose doing away with AMT and the 3.8% Medicare surcharge on high income earners. The Medicare surcharge was essentially put in place to help subsidize the Affordable Care Act (ACA).
The elimination of itemized deductions are a mutual goal for both the House and Trump tax plans. The House plan would only retain two critical deductions: mortgage interest and charitable contributions. All other deductions would be eliminated, including the deduction for state and local income taxes, property tax, and sales tax. The Trump proposals would retain most of these deductions, but cap them at the $200,000 level.
Small business owners would benefit immensely from proposals presented by the House and Trump. The House plan would limit the tax rate for pass through entities, such as S-Corps to 25%, while the Trump plan proposes a rate of just 15%. The Tax Foundation estimates that about 95% of U.S. businesses in the United States are considered pass throughs such as S-Corps. A Trump proposal for a cut in the corporate tax rate would reduce the rate from 35% to 15%. (Sources: donaldtrump.com, taxpolicycenter.org)
We hear all the time that medical costs are too high in the U.S., and that Medicare is going to go bankrupt in the future. The President-Elect recently told us in a press conference that drug companies are “getting away with murder.” So how high are drug prices, and are those prices contributing at all to the high medical costs in the U.S.?
A Public Citizen research report looked at the prices that older citizens pay for their medications under the Medicare Part D plan, the largest federal drug program, which now covers more than 39 million people. You might be surprised to know that when the plan was passed by Congress under the Bush Administration, Medicare was specifically not allowed to “interfere” with the negotiations between drug manufacturers and pharmacies. The program was prohibited from leveraging its purchasing power to create economies of scale. And that would have been plenty of scale; currently, Medicare recipients account for 28% of all medical drug purchases in the U.S. marketplace.
But surely the marketplace itself would have resulted in reasonable drug costs. Right? The researchers compared the total expenditure per capita on pharmaceuticals across 33 large nations around the world, and found that not only did the U.S. spend the most—just over $1,000 a year per U.S. consumer, but the U.S. was a huge outlier over the rest of the world. Canada, whose socialized medical system is widely derided in political debates, came in second, at $750 per capita, and Belgium, Japan, Germany, Ireland, France and Greece are all near or above $600. At the other end of the scale, countries like Chile ($200), Israel ($300) and Denmark ($300) have managed to control drug costs without sabotaging the quality of their citizens’ health care. A separate analysis in the same paper found that Americans pay much higher prices for patented drugs than any country in the world—by a nearly 2:1 ratio. In fact, Medicare Part D pays nearly twice as much for the same medications as the Veterans Health Administration (VHA), due to the VHA’s ability to negotiate prices with its own purchasing power. (Source: http://carleton.ca/sppa/wp-content/uploads/Mirror-Mirror-Medicare-Part-D-Released.pdf)
You know that online technologies are turning whole industries upside down. Think Uber vs. the taxi industry, or Airbnb vs. hotels. But has anybody assembled a comprehensive look at the new platforms and what are threatened by platform technologies?
A recent article in the Harvard Business Review concludes that the companies susceptible to disruption by online platforms are not manufacturing enterprises like General Motors or Coca Cola. They tend to be matchmaker businesses that connect different groups of customers.
The article lists online platforms that are threatening traditional businesses. Oddly enough, the list doesn’t mention how Apple’s iTunes platform has basically eliminated the music/CD industry, but it does say that Alphabet (Google), Yahoo! and Facebook, with their ad-supported search capabilities, are disrupting advertising supported media like magazines. Amazon, meanwhile, is disrupting shopping malls and department stores. Uber threatens the taxi and limousine companies, while Snapchat threatens traditional communications.
The conclusion? Any business whose value comes from serving as an intermediary between manufacturers or service providers and customers has a target on its back.
Happy new year! Did you ever wonder how January 1 became the day when one year ends and another begins? Or why this handoff from one year to the next takes place a few weeks after the shortest day of the year? Why are there 12 months instead of, say, 25 or 50?
We have just entered the 432nd year of what is known as the Gregorian calendar, which was introduced by Pope Gregory XIII in the 1600s but was only adopted in England in 1752. The new calendar replaced the Julian calendar, which, on introduction in 46 B.C., corrected problems with the previous calendar system by creating an initial calendar year with 445 days–what later became known as the “year of confusion.” Before that, the Egyptian calendar—the original prototype of our current calendar system–was invented as a way to track the annual rising of the Nile River, which was critical to Egyptian agriculture.
The common thread of these calendars—and the Mayan, Chinese and Greek calendars–is that they are based on the fact that the moon goes through 12 cycles of full to new each year, which is where the idea of 12 months (“moons”) came from. Alas, the Gregorian calendar preserved some of the quirks of the Julian calendar: as you know, the months are of different lengths, holidays fall on different days of the week from year to year and there is the messy necessity to include an extra day each leap year. The new calendar did manage to preserve the 7-day week, which facilitated the observation of the Sabbath every seventh day—virtually a requirement for any calendar that would be adopted in the West
You might be surprised at the number of proposed “new and improved” calendars that have emerged over the years. The Raventos Symmetrical Perpetual Calendar and Colligan’s Pac calendar both feature 13 months of 28 days each, while the Symmetry 454 Calendar eliminates the possibility of having the 13th day of any month fall on a Friday. Eastman Kodak founder George Eastman proposed an International Fixed Calendar which manages to have the numerical days of each month fall on the same weekday; for example, the 15th day of each month would always be a Sunday. The idea was to facilitate business activities such as scheduling regular meetings, and make it easier to accurately compare monthly and quarterly statistics.
Will we see a shift to one of these new and improved versions of our calendar system? Probably not. After all, the U.S. has failed to adopt the metric standard of measurements, despite it being the universal system for scientific inquiry around the world. In the end, a messy system we’re all familiar with tends to be preferable to a tidy one that forces us to change our habits. Source: https://www.stratfor.com/analysis/geopolitics-gregoriancalendar?utm_source=Twitter&utm_medium=social&utm_campaign=article
Every year, the Morningstar mutual fund tracking organization releases a list of the worst new ETF investments—and generally, these tend to be trendy new offerings that are designed to catch the eye of investors who are responding to yesterday’s headlines rather than their long-term economic future.
This year’s top nomination is something called the VelocityShares Leveraged Crude Oil ETN, closely followed by the VelocityShares 3x Inverse Crude Oil Fund.
What do you get when you invest in these shares? Every day, the VelocityShares products give you three times the daily movements of the price of oil on the global markets. The first fund gives you three times the amount that the price changes in the same direction, while the second gives you three times the movement in the opposite direction.
Set aside the fact that there is no conceivable reason why you would want daily exposure to an investment as volatile as crude oil. For the moment, ignore the fact that the typical portfolio already has plenty of oil exposure, since energy companies are among the largest of the large caps, and just
about every U.S. and global organization uses energy as one of its major expense items.
The bigger problem with these shares is that the more volatile an investment is, the lower its long-term performance will tend to be in dollar terms. When a stock or ETF goes down 50% and then back up 50%–and this could happen in a week with these shares—the round trip delivers you a 25% loss.
Lather, rinse and repeat, and you’re looking at an underperforming asset—at three times the normalvelocity.
What else did Morningstar single out? You might also consider avoiding the Whisky & Spirits ETF. Not only is this portfolio concentrated on a small component of a much larger business sector, it is even highly-concentrated within the small realm of alcoholic beverages. A single stock accounts for 23% of the portfolio, and its top 10 holdings comprise 79% of the total dollars invested. And for this absurd lack of diversification, you pay 75 basis points a year—as much as you might pay for a diversified international fund. Why not just buy your own distillery instead?
Most of us suspect that the world is going to hell in a handbasket—or at least getting worse over the long term. In the U.S., only 4% of respondents will tell you that our world living conditions are improving.
If you’re in the majority, the website “Our World in Data” (https://ourworldindata.org/a-history-of-global-living-conditions-in-5-charts/) has posted some charts that might change your mind. Looking back over the long-term, it finds that we’re living at the very peak of world living conditions. And the trend still seems to be upward.
Consider global poverty. The accompanying chart shows the share of the world population living in extreme poverty—and you can see that this was a very high percentage in 1820, when the dataset begins. Since then, the share of extremely poor people has fallen dramatically and steadily, as more world regions have embraced industrialization, created social safety nets and slowly built a middle class. Today only about 10% of the world’s citizens live in extreme poverty.
Take another example: literacy. In 1800, only around 10% of the human population could read. Today, as you can see from the chart, the number hovers around 80%. If you believe that science, technology and political freedom are important to solving the world’s problems, then it helps if more people can read and write and therefore participate.
Finally, there have been dramatic changes in the percentage of people around the world who live in a democratically free vs. closed totalitarian society. The accompanying chart shows that virtually no people live in colonies any more, and closed autocracies are becoming scarce. Meanwhile, the green-shaded area shows the percentage growth of individuals who now live in a democratic society—more than half currently, up from nearly zero in 1816.
What does all this mean? If we take a longer-term perspective than, say, the recent presidential election cycle or last quarter’s earnings reports, we begin to see that all the time and energy and labor that all of us are putting in every day to improve the world, are actually paying off with substantial—if sometimes incremental–results. Other charts show that we’re healthier, better-educated and better off than our ancestors.
Let’s hope we can keep it up. The trends say we will.