Ocean Park Capital Management

2503 Main Street

Santa Monica, CA 90405

Main: 310.392.7300

Daily Performance Line:  310.281.8577

2016 Year End Results
Market Update
(all values as of 04.30.2024)

Stock Indices:

Dow Jones 37,815
S&P 500 5,035
Nasdaq 15,657

Bond Sector Yields:

2 Yr Treasury 5.04%
10 Yr Treasury 4.69%
10 Yr Municipal 2.80%
High Yield 7.99%

YTD Market Returns:

Dow Jones 0.34%
S&P 500 5.57%
Nasdaq 4.31%
MSCI-EAFE 1.98%
MSCI-Europe 2.05%
MSCI-Pacific 1.82%
MSCI-Emg Mkt 2.17%
 
US Agg Bond 0.50%
US Corp Bond 0.56%
US Gov’t Bond 0.48%

Commodity Prices:

Gold 2,297
Silver 26.58
Oil (WTI) 81.13

Currencies:

Dollar / Euro 1.07
Dollar / Pound 1.25
Yen / Dollar 156.66
Canadian /Dollar 0.79
 

Fund Overview– Year In Review

After outperforming the major indices substantially in 2015, the funds underperformed in 2016 as the downturn in health care stocks, particularly biotechnology stocks, greatly impacted our results.  While it is not pleasant to underperform, fluctuation in performance is inevitable and creates opportunity for future outperformance.  Our strategy of focusing on companies with a high probability of beating consensus earnings estimates has produced superior results in the past and we believe will continue to do so in the future.

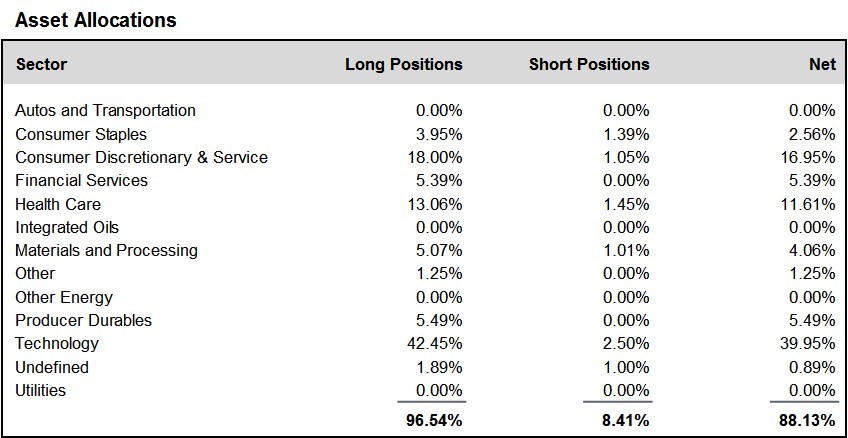
During December, we added to positions in the financial services, health care, and materials and processing sectors, and reduced positions in the technology sector.  We finished the month at about 88% net long, down from about 89% at the end of November.

We once again thank you for your investment in the Fund, as we strive to build upon our long-term performance and earn your continued confidence.

A schedule showing the performance of the Investors Fund is included below, along with our Asset Allocation Chart. Daily updates on our activity are available on our Results Line, at 310-281-8577, and current information is also maintained on our website at www.oceanparkcapital.com. To gain access to the site enter password opcap.

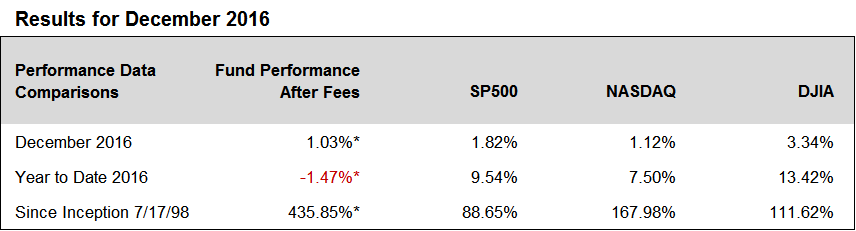
*These results are pro forma.  Actual results for most investors will vary.  See additional disclosures on page 4.
Past performance does not guarantee future results.

 
Year End 2016 - Equity Overview

Equity Overview – Year in Review and A Look Forward

Although equity markets started 2016 in the red, they rebounded to post solid gains.  For the year, the S&P 500 increased 9.54%, the Nasdaq Composite gained 7.5%, and the Dow Jones Industrial Average rose 13.42%.

The dynamics of sector rotation hit the equity markets in the final two months of trading in 2016.  Healthcare, utilities and consumer sectors saw an exodus as financials, energy, and industrials saw an inflow.

Substantial fiscal and regulatory changes are expected in 2017.  Prominent among these are personal and corporate tax cuts, increased government spending, and less regulation.  The expectation is that these changes will boost economic growth and should also boost earnings for stocks.  But as with any change, the benefits are likely to be distributed unevenly among companies, which is the classic setting for a stock pickers market.  The challenge will be to identify the winners and losers.

With U.S. companies having reduced expenses and minimized debt exposure over the past few years, any increase in margins has become difficult.  Thus the key to increased earnings in 2017, and an accompanying increase in stock prices, will be revenue growth generated by increased economic activity.


Year End 2016 - Macro Overview

Macro Overview – Year in Review

Uncertainty ruled in 2016, highlighted by concerns over interest rates, economic growth, oil prices, the presidential election, and Brexit.  But initial reactions to a variety of surprising developments proved temporary.  Thus, the 10-Year Treasury Bond yield drop to 1.36% in July, after Brexit, was followed by a rise to almost 2.5% by year end.  Oil also made a powerful comeback in 2016, rising from $26 a barrel in February to $53 a barrel at year-end, propelled in part by OPEC production cuts.  And the immediate precipitous decline in the futures markets on the night of the presidential election, in the wake of Trump’s victory, was followed by a dramatic recovery the next day and significant gains in equities in the last two months of the year.

The rally stalled toward the end of December, as doubts surfaced regarding Trump’s success in garnering support for his proposals from both Republicans and Democrats in the House and Senate.  The pause was reinforced by a gradual shift from equities to bonds, encouraged by the increase in bond yields which makes fixed income investments more attractive. This rebalancing often occurs at year end, as multi-billion dollar pension funds reallocate asset classes as expectations adjust.

A number of banking and financial industry regulations are in question as Trump is expected to repeal various rules and provisions that many believe have hindered lending and consumer credit expansion. Trump will have the ability to repeal numerous rules and regulations almost immediately under the Congressional Review Act (CRA). The possibility of political hurdles and non-approvals for some of Trump’s appointments may cause uncertainty leading to volatility in the markets.

Two well regarded barometers of consumer confidence rose in December to higher levels. The University of Michigan’s preliminary consumer confidence index rose to 98 and the Conference Board’s Consumer Confidence Index rose to 113.7. Sentiment among U.S. consumers will be critical to the health of economic growth, as greater spending evolves from growing confidence.


Year End 2016 - Additional Disclosures

Additional Disclosures

Performance data for OPI reflect the reinvestment of dividends and other earnings on the fund’s assets.  Performance data for the major indices reflect only changes in the value of those indices, and would be higher if dividends were included. However, the index data do not reflect fees that would be paid to index fund managers and transaction costs that would be incurred when their component stocks are bought or sold, while OPI’s data do reflect quarterly fees and expenses incurred by the fund.  The information provided is believed to be reliable, but its accuracy or completeness is not warranted. This material is not intended as an offer or solicitation for the purchase or sale of any stock, bond, mutual fund, or any other financial instrument. The views and strategies discussed herein may not be appropriate and/or suitable for all investors. This material is meant solely for informational purposes, and is not intended to suffice as any type of accounting, legal, tax, or estate planning advice. Any and all forecasts mentioned are for illustrative purposes only and should not be interpreted as investment recommendations.