December 2017 Market Update
Market Update
(all values as of 05.30.2025)

Stock Indices:

Dow Jones 42,270
S&P 500 5,911
Nasdaq 19,113

Bond Sector Yields:

2 Yr Treasury 3.89%
10 Yr Treasury 4.41%
10 Yr Municipal 3.31%
High Yield 7.26%

YTD Market Returns:

Dow Jones -0.64%
S&P 500 0.51%
Nasdaq -1.02%
MSCI-EAFE 17.30%
MSCI-Europe 21.20%
MSCI-Pacific 10.50%
MSCI-Emg Mkt 8.90%
 
US Agg Bond 2.45%
US Corp Bond 2.26%
US Gov’t Bond 2.44%

Commodity Prices:

Gold 3,313
Silver 33.07
Oil (WTI) 60.79

Currencies:

Dollar / Euro 1.13
Dollar / Pound 1.34
Yen / Dollar 144.85
Canadian /Dollar 0.72
 

Macro Overview

The rally in stocks that began following the election in 2016 propelled through 2017 as optimism and expectations that growth oriented policies and tax cuts would materialize. Political turmoil was not a deterrent for the markets, as major U.S. equity indices finished the year at near record levels.

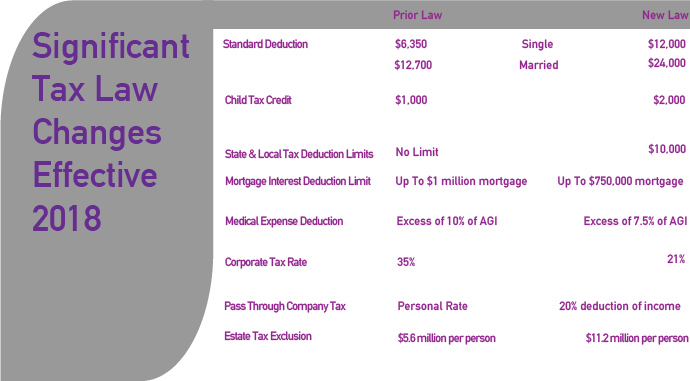
The Tax Cut & Jobs Act was signed into law by the President on December 22nd, setting the stage for new tax codes and rules effective January 1, 2018. Following the passage of the new tax law legislation, small businesses and larger corporations prepare for optimal methods of spending capital and expanding in 2018.

Congress passed a short-term funding plan to avert a government shutdown between December 22nd to January 19th. Since federal funding gaps are common, Congress institutes a continuing resolution or CR to provide interim funds in order to maintain government operations.

Strengthening economic conditions throughout the international markets helped buoy global stocks and mildly boost inflationary pressures, which can be beneficial for certain equities. Economic stimulus efforts by central banks were reigned in during 2017, as developed and emerging market economies exceeded growth expectations.

The Federal Reserve raised rates as expected with the objective of curtailing inflationary pressures. The December rate hike was the third of the year, pushing shorter-term rates higher, which are more sensitive to Fed rate increases. Overall, rates remained fairly stable in 2017, as inflation and economic growth were tepid. The 10-year Treasury yield ended 2017 at 2.40%, down from 2.45% at the beginning of the year.

Confusion surrounding prepayment of property taxes was a nationwide problem the last week of the year as homeowners rushed to prepay 2018 property tax bills without being certain if a deduction could be taken in 2017. In a statement, the IRS did specify that taxpayers could deduct prepaid 2018 state and local property taxes on 2017 returns only if the taxes were assessed before 2018.

(Sources: Congress.gov, Federal Reserve, IRS, U.S. Treasury)

 
During 2017 Global Equity Markets increased value

Equity Overview – Global Stock Update

Global markets accelerated throughout 2017, marking new highs and sending broader market indices higher. The election prompted rally in domestic stocks continued on in 2017 as optimism and expectations that growth oriented policies and tax cuts would fuel earnings appreciation.  International markets excelled in 2017 as both developing and emerging stocks were boosted by expanding economies throughout Europe and Asia.

The new tax law imposes a repatriation tax on cash held overseas by U.S. corporations. A tax of 15.5% on liquid assets will affect various sectors and numerous companies that are estimated to have amassed over $2 trillion overseas. The new rate is considerably lower than the previous rate of 35%, incentivizing companies to bring cash back to the U.S.  Of the several sectors encompassing the equity markets, technology and healthcare companies hold the most cash overseas, placing them at the forefront of bringing billions of dollars back to the U.S. at the preferable tax rate. (Sources: Bloomberg, Reuters, www.congress.gov/bill/115th-congress/house-bill/1)

Oil Prices Rose In 2017 – Commodities Update

Production caps by OPEC, dwindling supplies, and stronger international demand elevated oil prices to levels not reached in over two years.  Prices recovered from lows set in 2016 when an abundance of domestic production and excess supplies from OPEC member countries flooded markets. Improving global economic conditions in 2017 led to demand increases for oil from both OPEC and U.S. production. The U.S. Energy Information Administration estimates that oil demand increased by 1.5 million barrels a day in 2017 and forecasts an increase by 1.3 million barrels a day in 2018.

Producers in the United States are expected to benefit as the abundance of domestically produced oil is exported rather than kept in the United States. The benchmark index for U.S. oil production is known as West Texas Intermediate (WTI), which has become less expensive relative to international oil as measured by Brent over the past year. The price difference has led to greater demand for U.S. oil internationally.  (Sources: EIA, U.S. Dept. of Energy)

Short Term Rates Heading Higher – Bond Market Overview

The Federal Reserve raised a key short-term rate as expected by the markets and made fairly optimistic comments about economic growth projections for 2018. The federal funds rate rose to a target range of 1.25 – 1.50%. The increase is a strategy of tightening and also meant to alleviate inflationary pressures. Concurrently, the Fed is also shrinking its $4.4 trillion balance sheet, a dual monetary policy effect expected to curtail inflation and reduce stimulus. Members of the Federal Reserve indirectly expressed concern about the labor market, suggesting that improvements in the job market were expected to ease. The Fed committee also maintained a conservative growth estimate for 2018 of 1.8%, hinting that the new tax plan may not yet produce economic benefits in 2018. The yield curve flattened throughout 2017, with a rise in short term rates and a drop in longer-term rates. The yield on the 2-year Treasury Note had its largest annual increase in over 10 years, ending the year at 1.89%, up from 1.22% at the beginning of January 2017. The benchmark 10-year Treasury bond yield saw almost no change in 2017, falling to 2.40% at year end from 2.45% in the beginning of January. (Sources: Federal Reserve, U.S. Treasury, Bloomberg)


Bitcoin continues its volatile ride somewhere...

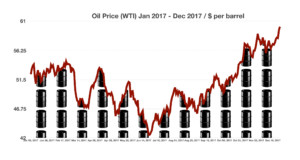
Bitcoin & The Greater Fool Theory – Consumer Behavior

A Bitcoin exchange in South Korea went out of business in December after it was hacked by cyber thieves that stole roughly 20% of it’s clients holdings, validating that cyber currency exchanges are still extremely susceptible to losses. Unlike a bond, stock or real estate, a crytocurrency offers no intrinsic value, such as cash flow and earnings. Instead, the value is solely based on what the next buyer is willing to pay leading to speculation, also known as the greater fool theory.

The greater fool theory states that the price of an item is determined by unreasonable expectations and ideals about that item. As speculation inflates prices, sellers profit as there will always be a bigger fool willing to pay a higher price.

Many believe that the price of Bitcoin in the final weeks of 2017 exemplified behavior relative to the greater fool theory. Volatility in December alone was considered irrational and speculative in nature, as the cyber currency value skyrocketed over 40% in early December, then tumbled over 30% later in the month.  (Sources: coindesk.com/price, cointelegraph.com)


Number of Shares of Exchange Listed Corporations Continues To Shrink – Historical Note

Over the past 20 years the number of corporations with listed shares traded on U.S. exchanges has actually dropped by approximately 40%. In the 1990s, there were once over 8,800 publicly traded companies with a total market capitalization of about $20.9 trillion. As of the end of December 2017, total market capitalization was $27.7 trillion, yet with 40% less stocks than in the 1990s.

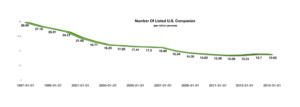
Supply and demand has become a key valuation component of the equity markets, as there are far fewer stocks available, but at higher prices.

Shares have decreased for various reasons, including aggressive share buybacks and higher regulatory costs. Mergers and acquisitions have also reduced supply while fewer firms are willing to deal with the costs and regulations involved in being public. As fewer companies are willing to be publicly traded, more are eager to become private or be acquired by private equity firms.

As the equity markets have consolidated, so have some of the indices made up of these publicly traded stocks. The broadest equity index of all is the Wilshire 5000 index, which no longer includes 5000 companies, but currently includes only 3503 companies (as of September 2017).  (Sources: Federal Reserve; fred.stlouisfed.org/categories/33194, Wilshire Associates)

 
There Are Over 253 Million Cars In The U.S.......550,000 of those are electric

Electric Cars Grew In Popularity In 2017 – Auto Industry Overview

The adoption of electric cars worldwide has been a trend for years, with limited options from only a few manufacturers. A recent surge of new entrants into the market along with rapidly advancing electric motor and battery technology has recently provided a flurry of additional options for consumers. Government subsidies and environmental sensitivity have also helped increase the popularity of electric vehicles and propelling sales upward. 
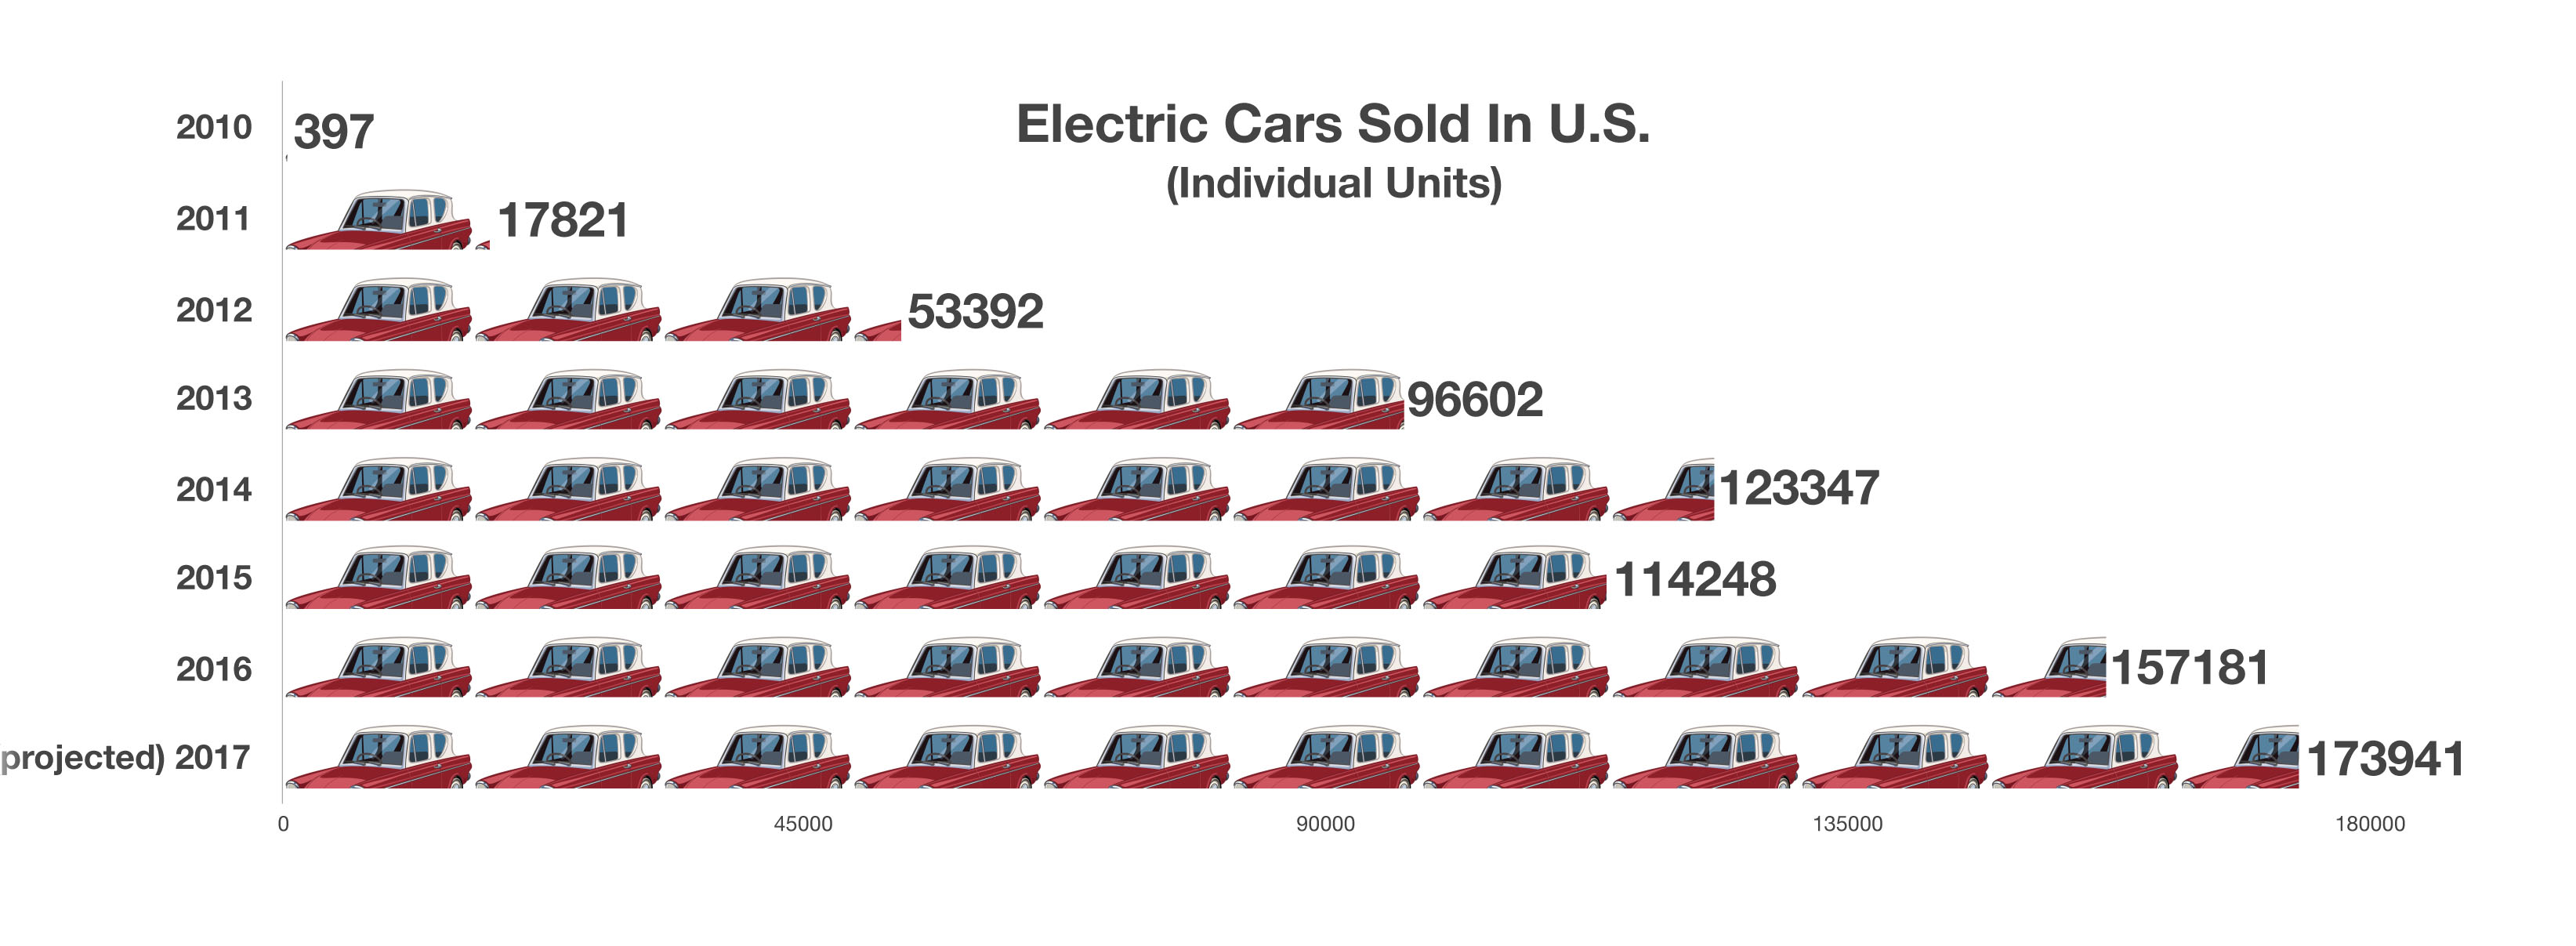
There are currently over 253 million cars and trucks on U.S. highways, with roughly 550,000 of them electric. Electric vehicles have also grown in popularity in other countries as new models and manufacturers have evolved. China, Japan, the Netherlands and Norway are among the countries with the largest amount of electric vehicles. Estimates for 2017 electric car sales in the U.S. are expected to be about 174,000 vehicles, up from 157,000 in 2016. Numerous manufacturers and brands have introduced new models prompting competition in the industry. (Sources: InsideEVs, Dept. of Transportation)

The New Tax Bill – Fiscal Policy Review

Both individual taxpayers and companies will see broad changes for deductions and tax rates. The emphasis of the tax bill, known formally as the Tax Cuts & Jobs Act, is to stimulate economic activity via new and higher paying jobs. This is why many of the changes directly benefit large and small businesses in order to encourage hiring.

Some of the tax provisions enacted by the new tax act will be temporary, while others permanent. The cost of reduced tax revenue brought about by tax cuts may only be viable for a certain period, thus producing more immediate benefits from tax cuts rather than later.   Affecting essentially every taxpayer is the increase in the standard deduction, which is meant to simplify the tax preparation process by replacing itemized deductions with a larger standard deduction.

The IRS estimates that about 95% of the businesses in the United States are pass-through entities, such as sole proprietors, S-Corps, LLCs, and partnerships. These entities are called pass-throughs because the profits generated are passed directly through the business to the owners, which are taxed at the owners’ individual income tax rates. The new tax law allows for a 20% deduction of that income, thus reducing overall taxable income. According to the Tax Foundation, pass-through businesses account for over 55% of all private sector employment, representing over 65.5 million workers nationwide. (Sources: IRS, www.congress.gov/bill/115th-congress/house-bill/1)