Ocean Park Capital Management

2503 Main Street

Santa Monica, CA 90405

Main: 310.392.7300

Daily Performance Line:  310.281.8577

December 2017
Market Update
(all values as of 05.30.2025)

Stock Indices:

Dow Jones 42,270
S&P 500 5,911
Nasdaq 19,113

Bond Sector Yields:

2 Yr Treasury 3.89%
10 Yr Treasury 4.41%
10 Yr Municipal 3.31%
High Yield 7.26%

YTD Market Returns:

Dow Jones -0.64%
S&P 500 0.51%
Nasdaq -1.02%
MSCI-EAFE 17.30%
MSCI-Europe 21.20%
MSCI-Pacific 10.50%
MSCI-Emg Mkt 8.90%
 
US Agg Bond 2.45%
US Corp Bond 2.26%
US Gov’t Bond 2.44%

Commodity Prices:

Gold 3,313
Silver 33.07
Oil (WTI) 60.79

Currencies:

Dollar / Euro 1.13
Dollar / Pound 1.34
Yen / Dollar 144.85
Canadian /Dollar 0.72
 

Fund Overview

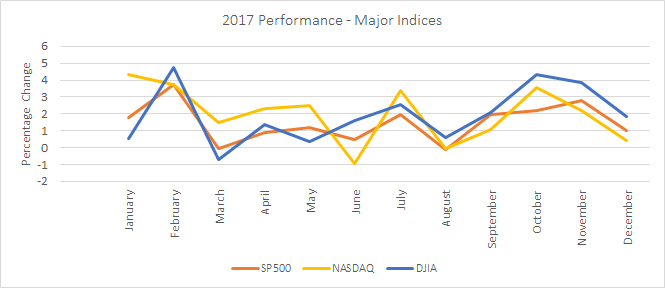
Equities rose to record levels in 2017, as did the Ocean Park funds.  Technology stocks and consumer discretionary and service stocks were particularly strong.  Within those sectors, semiconductor companies and semiconductor equipment companies, as well as the FAANG companies (Facebook, Apple, Amazon, Netflix, and Google) generated outsized gains.  Although those groups retreated modestly in December, we nonetheless outperformed the S&P 500 for the year.  We also outperformed the HFRI Equity Hedge Total Index, which was up 13.46% for the year.

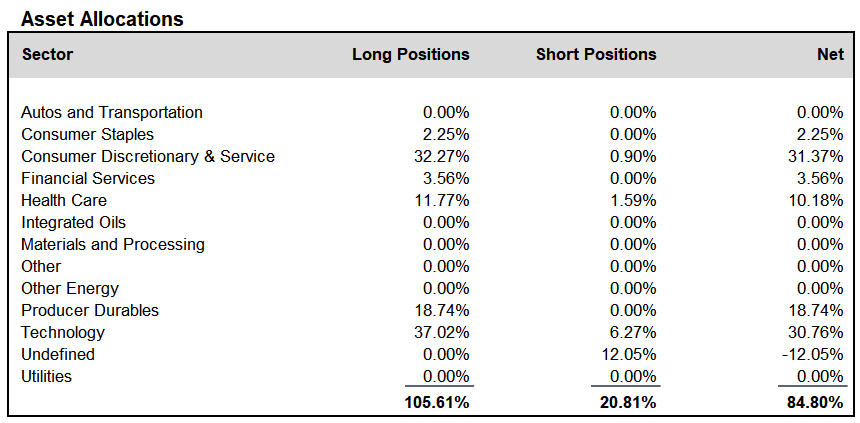
During December, we added to positions in the consumer discretionary and service, consumer staples, and producer durables sectors, and reduced positions in the technology sector. We also maintained our hedge in the technology sector through our position in SOXS, which is an ETF with a leveraged short exposure to the PHLX semiconductor sector index.  We finished the month at about 85% net long, down from about 90% at the end of November.

We once again thank you for your investment in the Fund, as we strive to build upon our long-term performance and earn your continued confidence.

A schedule showing the performance of the Investors Fund is included below, along with our Asset Allocation Chart. Daily updates on our activity are available on our Results Line, at
310-281-8577, and current information is also maintained on our website at www.oceanparkcapital.com. To gain access to the site enter password opcap.

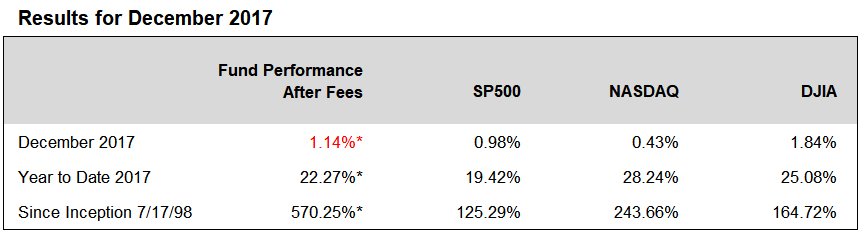
*These results are pro forma.  Actual results for most investors will vary.  See additional disclosures on page 4.
Past performance does not guarantee future results.

 
Equity Overview

Equity Overview

Stocks had a remarkable year in 2017, surprising the analyst community which had generally predicted only modest results.  All the major indices rose by double digits.  The S&P 500 posted its best performance since 2013.  The Dow had its second largest gain in 10 years, rose for nine consecutive months (its longest streak since 1959), and made the most daily record closes (71) of any year in its history.   And it all happened against a background of historically low volatility.

Consensus estimates projected year-over year earnings growth in the first quarter of 2017 at 9.1%.  Actual results were 14%.  In the second quarter they rose 10%, and in the third quarter they rose 6.4%.

Nor were the U.S. markets an anomaly.  Global markets also finished 2017 at or near record levels or multi-year highs, as all 45 countries tracked by the Organization for Economic Cooperation and Development were in expansionary mode.


Macro Overview

Macro Overview

The markets rose dramatically in 2017 against a backdrop of potentially disruptive events.  These included the drawn-out and ultimately unsuccessful effort to repeal the Affordable Care Act; the impact of that failure on the likelihood that Congress could pass tax reform; the largest decline in the dollar (7.5%) in ten years; threats from the renegotiation of NAFTA and withdrawal of the U.S. from the Trans-Pacific Partnership agreement; a historically destructive hurricane season; the ongoing dispute over immigration; the nuclear crisis in North Korea; and the ongoing special counsel investigation of the president, to name a few.

Interestingly, one source of traditional market turmoil—interest rate hikes—actually proved benign, largely as a result of the skill with which the Fed telegraphed its moves.  Thus it was able to raise rates three times in 2017, culminating with a 0.25% increase in December which moved the Fed’s short-term rate to a range of 1.25-1.50%.  But a continuing area of uncertainty is the so-called yield curve, which is the relationship between the 2-year and 10-year Treasuries.  That spread was cut in half in 2017, as the 10-year rate actually declined over the year from 2.45% to 2.40%.  Should this trend continue, the concern is that on five of the last six occasions that the 2-year yield surpassed the 10-year yield, a recession soon followed.

By far the largest macroeconomic event in 2017 was tax legislation, which permanently reduced the corporate tax rate from 35% to 21% and temporarily reduced most individual rates by lesser amounts.  The stated rationale for the corporate tax reduction was that the savings will encourage companies to invest more in their businesses, building new factories, buying new equipment, and making employees more productive.  However, corporations were already generating record profits in 2017 before passage of the legislation, and they were not putting those profits back into their businesses.  Instead, they were boosting shareholder returns by increasing dividends and buying back stock.  So it remains to be seen if the new tax law will produce its intended result.

Meanwhile, the tax legislation is not revenue neutral.  Even Republican methodology indicates that it will add $500,000,000 to the national debt.  Other analysts compute debt increases in the trillions.  At the moment, the ratio of U.S. national debt to gross domestic product is 108.1%.  Only four other large countries have a higher ratio:  Japan (whose economy has been stagnant for decades because of its debt), Greece (which has been on the brink of economic disaster for years), Italy, and Portugal.  It is unclear whether tax reform will raise GDP sufficiently to reduce our ratio, or increase debt sufficiently to worsen it.

Undoubtedly, some of the market gains in 2017 reflected the anticipation of reduced corporate taxes, which means that tax reform is already priced into stock valuations to some extent.  But to what extent?  And more specifically, since we focus on identifying companies that are likely to generate positive earnings surprises, what is an earnings surprise in this environment?  Is it really a meaningful surprise if a company beats estimates because of lower taxes?  Answering these questions will be a detail for us to consider in 2018.

 
Additional Disclosures

Additional Disclosures

Performance data for OPI reflect the reinvestment of dividends and other earnings on the fund’s assets.  Performance data for the major indices reflect only changes in the value of those indices, and would be higher if dividends were included. However, the index data do not reflect fees that would be paid to index fund managers and transaction costs that would be incurred when their component stocks are bought or sold, while OPI’s data do reflect quarterly fees and expenses incurred by the fund.  The information provided is believed to be reliable, but its accuracy or completeness is not warranted. This material is not intended as an offer or solicitation for the purchase or sale of any stock, bond, mutual fund, or any other financial instrument. The views and strategies discussed herein may not be appropriate and/or suitable for all investors. This material is meant solely for informational purposes, and is not intended to suffice as any type of accounting, legal, tax, or estate planning advice. Any and all forecasts mentioned are for illustrative purposes only and should not be interpreted as investment recommendations.