Ocean Park Capital Management

2503 Main Street

Santa Monica, CA 90405

Main: 310.392.7300

Daily Performance Line:  310.281.8577

December 2018
Market Update
(all values as of 04.30.2024)

Stock Indices:

Dow Jones 37,815
S&P 500 5,035
Nasdaq 15,657

Bond Sector Yields:

2 Yr Treasury 5.04%
10 Yr Treasury 4.69%
10 Yr Municipal 2.80%
High Yield 7.99%

YTD Market Returns:

Dow Jones 0.34%
S&P 500 5.57%
Nasdaq 4.31%
MSCI-EAFE 1.98%
MSCI-Europe 2.05%
MSCI-Pacific 1.82%
MSCI-Emg Mkt 2.17%
 
US Agg Bond 0.50%
US Corp Bond 0.56%
US Gov’t Bond 0.48%

Commodity Prices:

Gold 2,297
Silver 26.58
Oil (WTI) 81.13

Currencies:

Dollar / Euro 1.07
Dollar / Pound 1.25
Yen / Dollar 156.66
Canadian /Dollar 0.79
 

Fund Overview

Equities tumbled at year’s end, as did the Ocean Park Funds.  The decline was broad-based as all sectors lost ground.  Consumer and technology stocks, which had powered the funds during the year, each lost more than 8% for the month.  Other categories fared even worse with energy stocks the most notable losers at negative 13%.  The result was that all the major indices finished the year in the red.  Hedge funds measured by the HFRI Equity Hedge Index did not escape the damage, sustaining losses averaging 6.9% for the year.

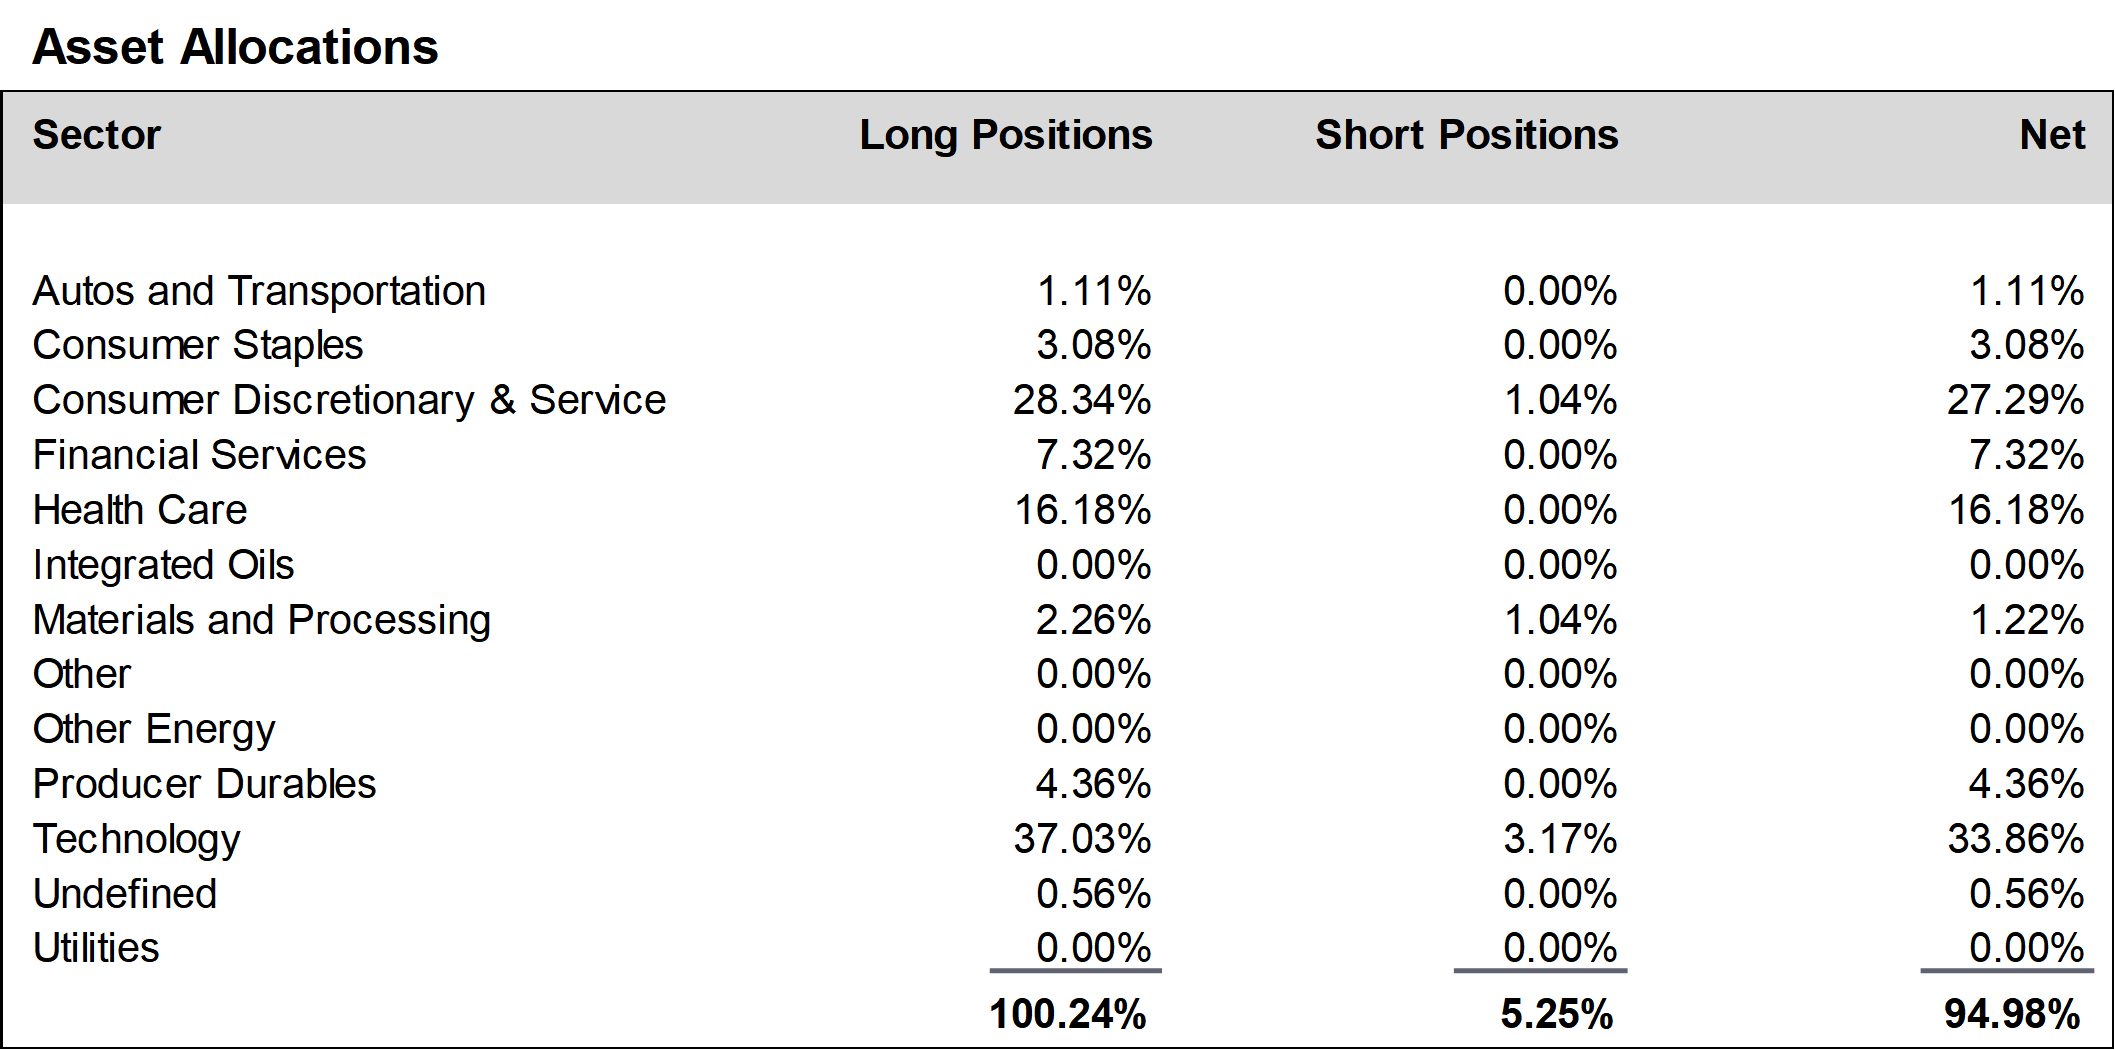
During December, we added to positions in the financial services and health care sectors, and reduced positions in the consumer discretionary and service sector.  We ended the month at about 95% net long, up from about 91% in November.

We once again thank you for your investment in the Fund, as we strive to build upon our long-term performance and earn your continued confidence.

A schedule showing the performance of the Investors Fund is included below, along with our Asset Allocation Chart. Daily updates on our activity are available on our Results Line, at
310-281-8577, and current information is also maintained on our website at www.oceanparkcapital.com. To gain access to the site enter password opcap.


*These results are pro forma. Actual results for most investors will vary. See additional disclosures on page 4. Past performance does not guarantee future results.

 
Equity Overview - December 2018

Equity Overview

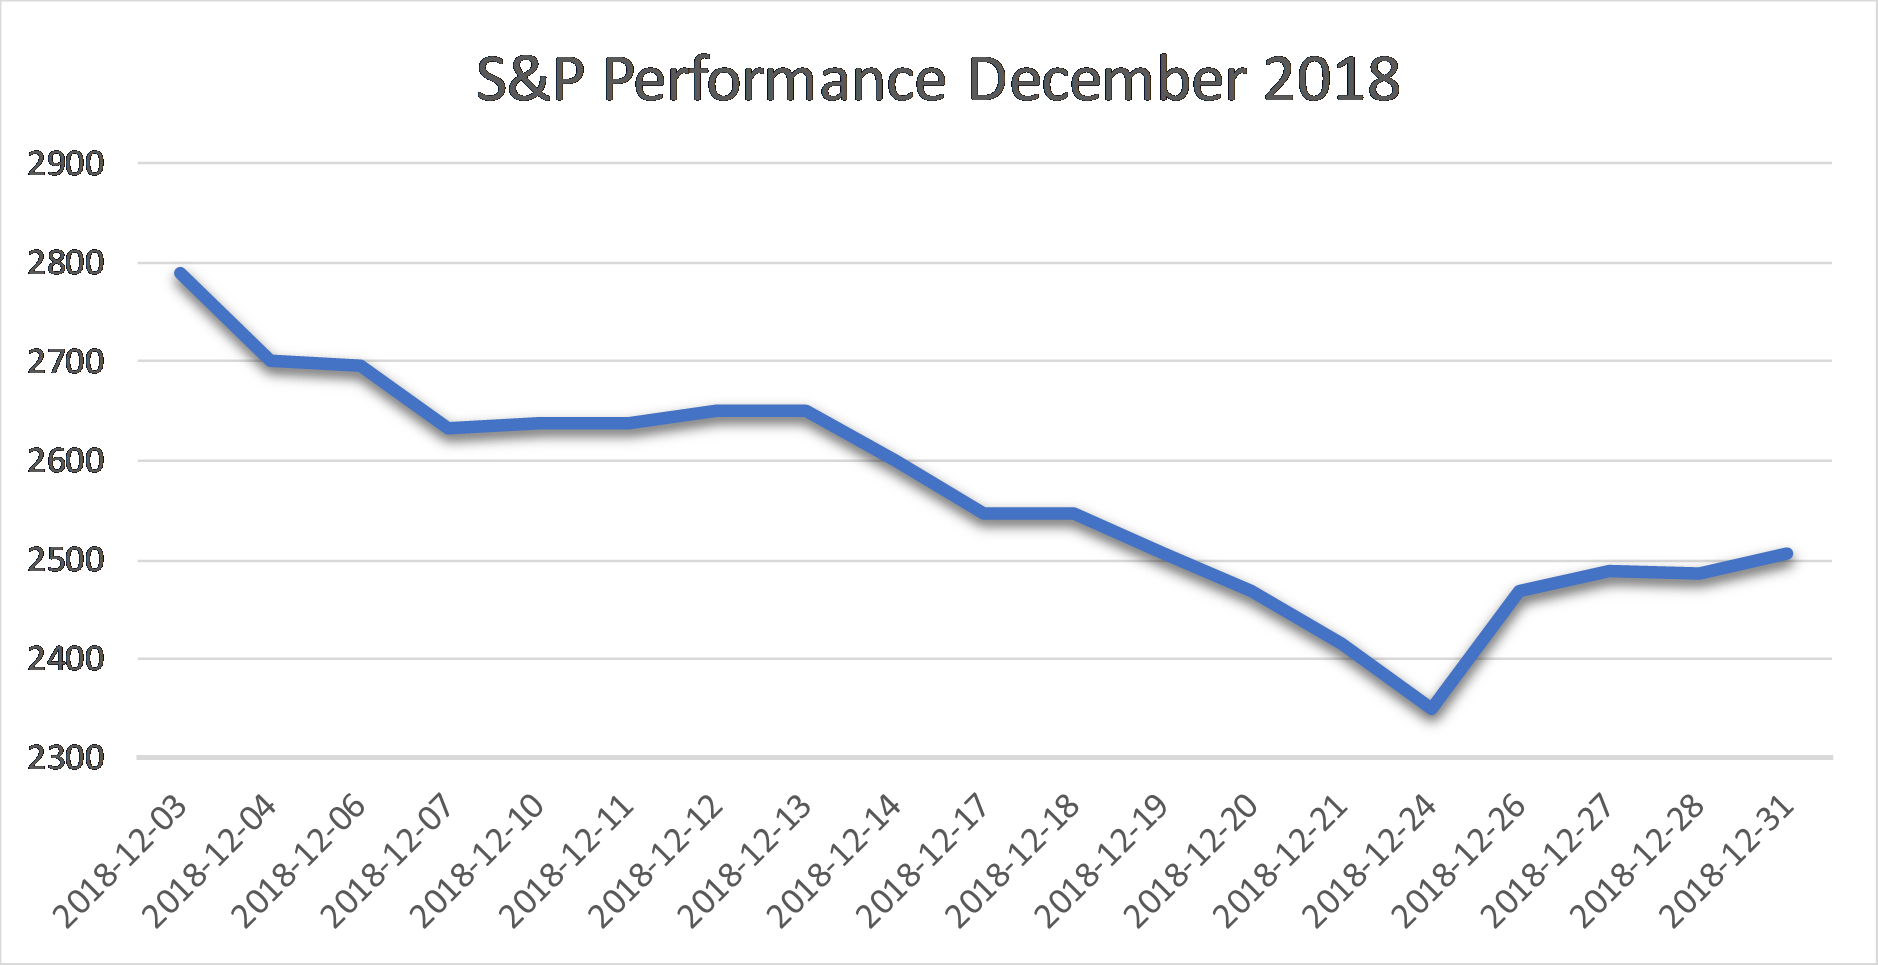
Stocks suffered their worst December since the 1930’s, as a perfect storm of negative events battered the market:  the unresolved trade war with China, the partial government shutdown, fears of recession in the U.S., and signs of a worldwide economic slowdown.

Value stocks and growth stocks were buffeted about equally, but large cap stocks marginally outperformed small caps.  Volatility returned with a vengeance, as the S&P 500 gained or lost more than 2% on 8 of 19 trading days.

On a hopeful note, the December drop in stock prices caused the forward price earnings ratio to decline to about 15x, well below the 5-year average of 16.4x.  This suggests that markets may have overreacted and that a rebound may be in order.


Macro Overview December 2018

Macro Overview

Notwithstanding a promising start, low unemployment, strong corporate profits, and a massive tax cut, 2018 ended as the worst year for stock performance since the financial crisis of 2008.

What happened?

Among the factors has been our trade war with China, which injected uncertainty into the economies of both countries.  While the impact has been muted in the U.S., as the year progressed concerns grew that if the dispute remained unresolved, consequences would reverberate throughout the domestic economy.  And the impact in China is already notable, as the most recent data indicates that its economy is growing at its slowest rate in almost 10 years.  Signs that the world’s second-largest economy is faltering have become worrisome.

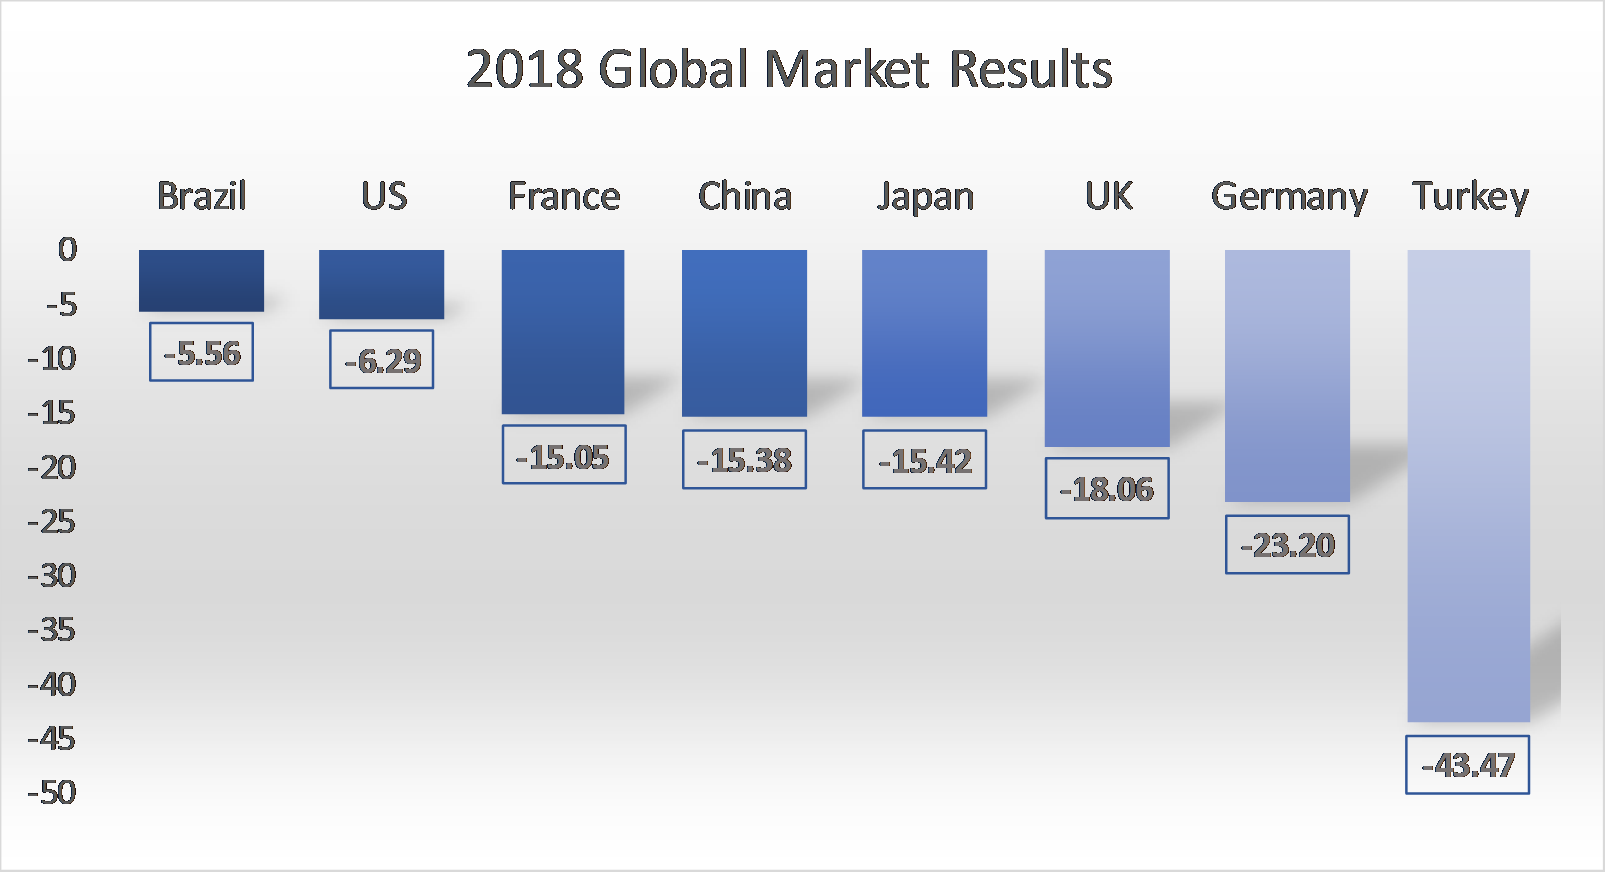
Moreover, economic anxiety has not been limited to China and the U.S.  Stock market indices in every meaningful economy worldwide finished down in 2018, at levels ranging from 5.6% in Brazil to 43.5% in Turkey.  This included Japan and Germany (the world’s third and fourth largest economies) where growth in both countries contracted in the third quarter, and where market indices were down for the year by 15.4% and 23.2%, respectively.

Equally significant has been the Federal Reserve, which raised interest rates four times in 2018.  While each of the increases was modest and well-telegraphed, investors became increasingly fearful that the cumulative result of the increases, coupled with potential additional hikes in 2019, could stifle economic growth in the U.S.

Finally, speaking of uncertainty, which markets abhor, the political situation in the U.S. is as unsettling as it has been in decades.  Large sections of the federal government are shut down with no apparent endgame in sight.  The philosophical gap between Democrats and Republicans continues to widen.  Prospects for meaningful legislation of any kind seem remote.  Government by tweet is not helping.

But we recall that, after the meltdown in 2008, the world teetered on the brink of catastrophe.  However, the market rebounded and a ten year bull market began.  We attribute this in no small measure to the resilience of our political and economic systems.  While circumstances may appear discouraging at the moment, history suggests that creative solutions will be found.

 
Additional Disclosures - December 2018

Additional Disclosures

Performance data for OPI reflect the reinvestment of dividends and other earnings on the fund’s assets.  Performance data for the major indices reflect only changes in the value of those indices, and would be higher if dividends were included. However, the index data do not reflect fees that would be paid to index fund managers and transaction costs that would be incurred when their component stocks are bought or sold, while OPI’s data do reflect quarterly fees and expenses incurred by the fund.  The information provided is believed to be reliable, but its accuracy or completeness is not warranted. This material is not intended as an offer or solicitation for the purchase or sale of any stock, bond, mutual fund, or any other financial instrument. The views and strategies discussed herein may not be appropriate and/or suitable for all investors. This material is meant solely for informational purposes, and is not intended to suffice as any type of accounting, legal, tax, or estate planning advice. Any and all forecasts mentioned are for illustrative purposes only and should not be interpreted as investment recommendations.