Advanced Income Solutions January 2019 Newsletter
Market Update
(all values as of 04.30.2024)

Stock Indices:

Dow Jones 37,815
S&P 500 5,035
Nasdaq 15,657

Bond Sector Yields:

2 Yr Treasury 5.04%
10 Yr Treasury 4.69%
10 Yr Municipal 2.80%
High Yield 7.99%

YTD Market Returns:

Dow Jones 0.34%
S&P 500 5.57%
Nasdaq 4.31%
MSCI-EAFE 1.98%
MSCI-Europe 2.05%
MSCI-Pacific 1.82%
MSCI-Emg Mkt 2.17%
 
US Agg Bond 0.50%
US Corp Bond 0.56%
US Gov’t Bond 0.48%

Commodity Prices:

Gold 2,297
Silver 26.58
Oil (WTI) 81.13

Currencies:

Dollar / Euro 1.07
Dollar / Pound 1.25
Yen / Dollar 156.66
Canadian /Dollar 0.79
 

Macro Overview

Weariness among investors escalated towards the end of 2018 as uncertainty surrounding trade, the Federal Reserve, a government shutdown, and global economic growth lingered into the new year.

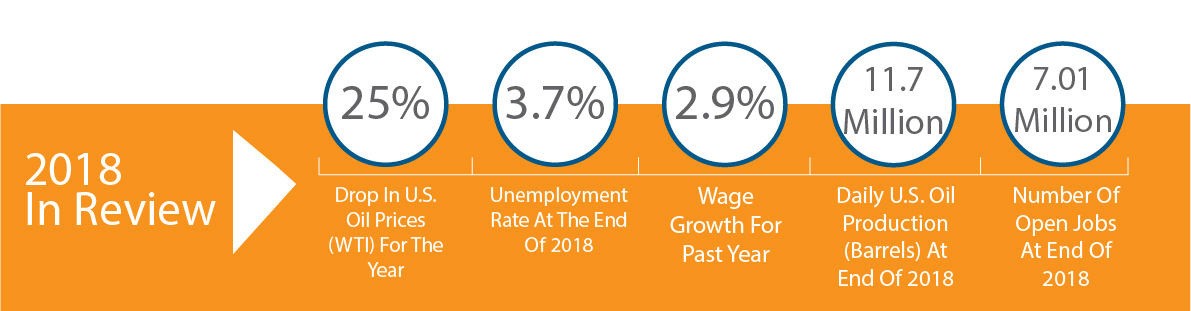
Even during the turbulent year of 2018, the U.S. economy continues its resilience into 2019, with unemployment at its lowest level in 49 years, wage growth reaching levels not seen since 2009 and consumer spending and industrial production remaining strong. A tight labor market along with moderate inflation has maintained an accommodating environment for consumers.

The year-end climate heading into 2019 became more challenging as equity markets reacted negatively to another rate hike in December along with two more expected hikes in 2019. Ironically, the market views the Fed hikes as a validation by the Fed that U.S. economic activity is healthy enough to endure further rate increases. 

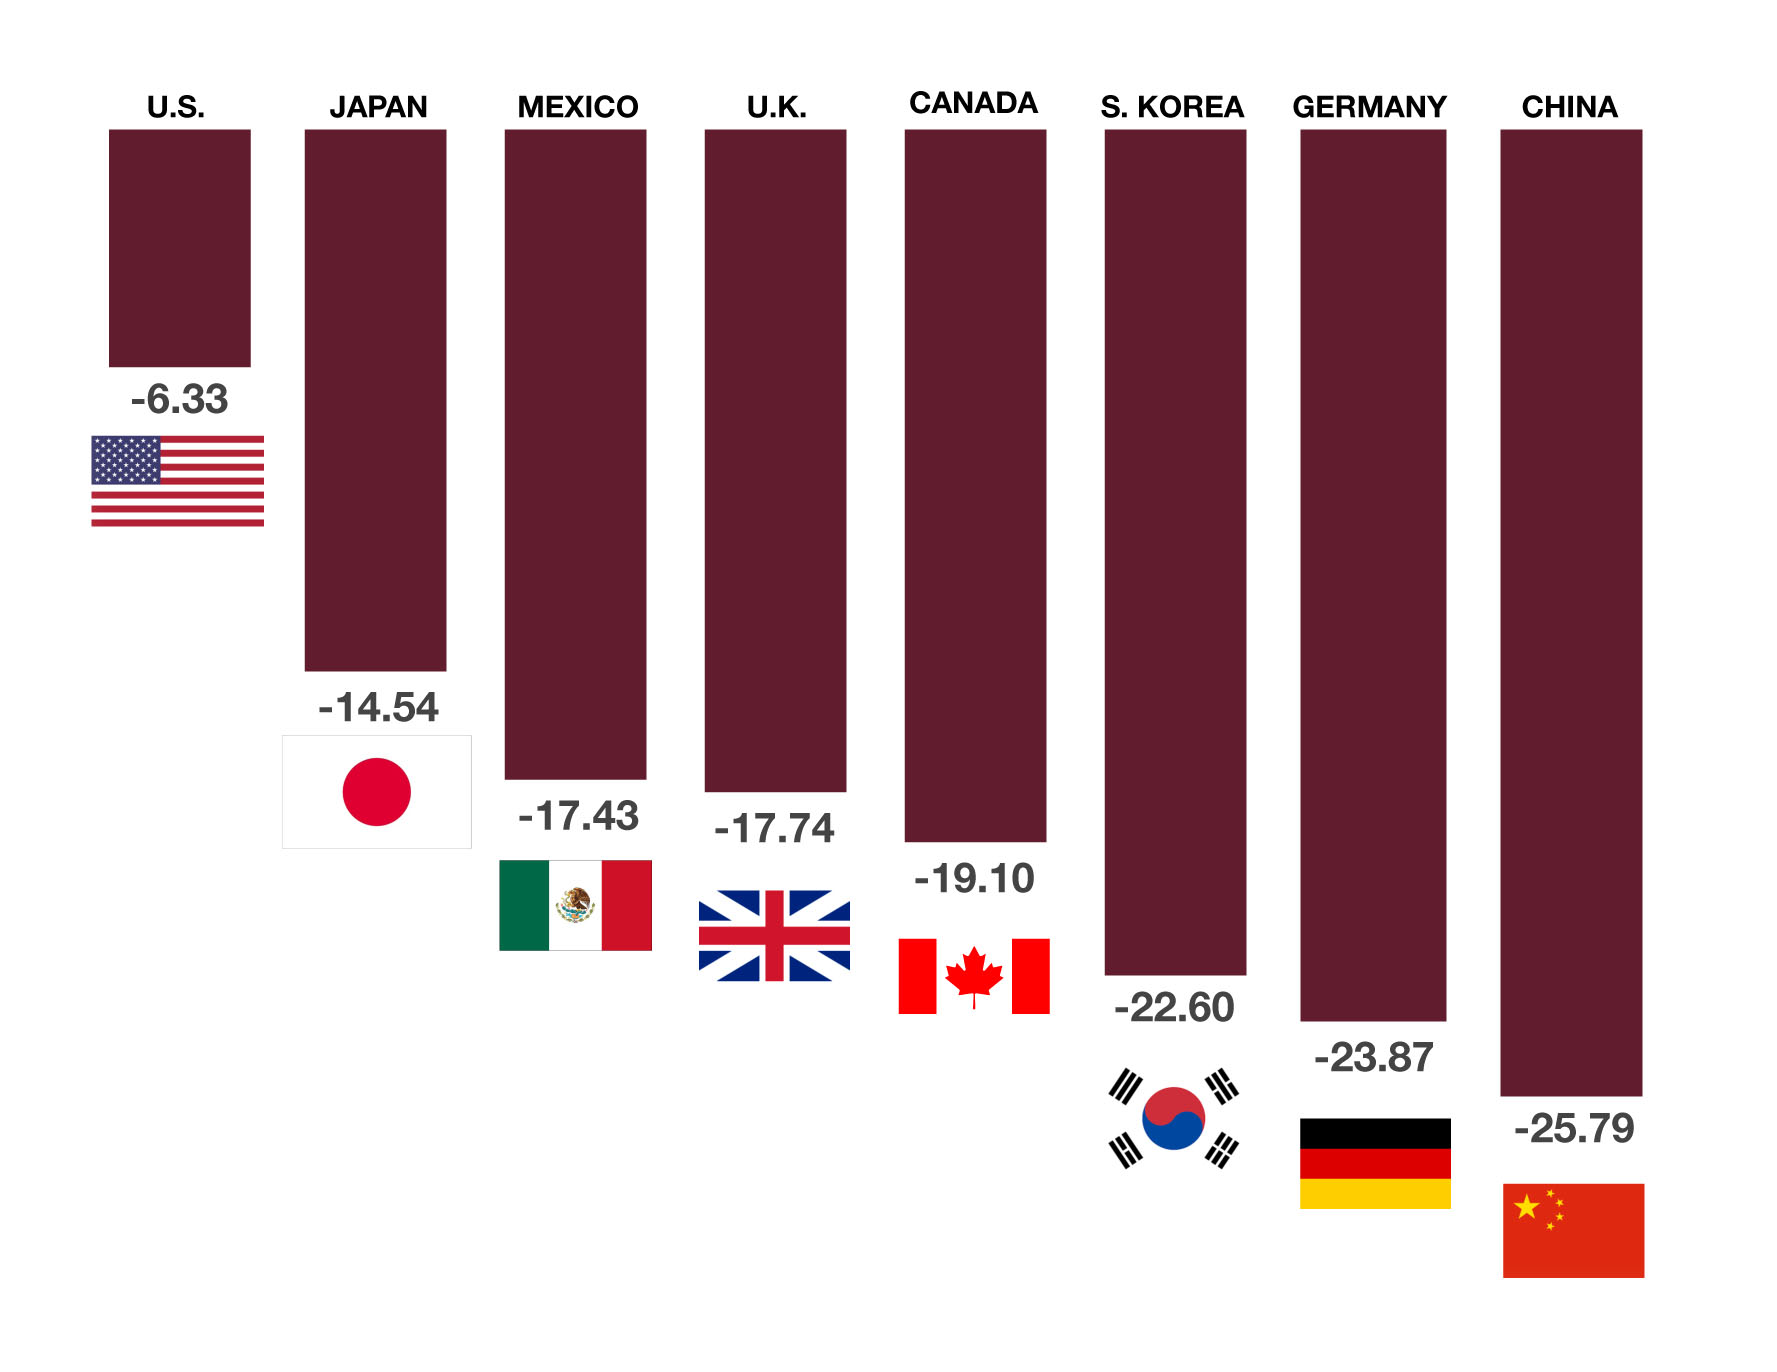
Global equity markets ended 2018 in negative territory with nearly every major index in both developed and emerging markets falling. China’s stock market was among the worst performer internationally as trade tensions took a toll on Chinese manufacturers and exporters. U.S. stock markets experienced volatility that had not occurred in several years resulting in a pullback for all major domestic equity indices in 2018.

Ongoing trade disputes and the imposition of new tariffs negatively influenced the markets and economic projections throughout year. Relations with China were forefront as the administration negotiated trade terms intended to better protect U.S. intellectual property and disparate tariffs.

Growing U.S. oil production and an increase in supplies led to a drop of U.S. oil prices by 25% in 2018. The benchmark for U.S. oil, West Texas Intermediate (WTI), fell from $60 per barrel in the beginning of the year to $45 per barrel by year-end, simultaneously reducing the price of gasoline nationwide.

According to the Federal Reserve Bank of New York, the likelihood of a recession remains relatively low with less than a 15% probability one will occur in the next year. The Fed has historically seen greater than 30% probabilities before each of the last seven recessions since 1970.

(Sources: Federal Reserve Bank of New York, Treasury, Labor Dept., Bloomberg)


Global Equity Markets Review

Global Equity Markets Decline In 2018 – Equity Review

Volatility throughout the trading year kept stock valuations tough to determine. A popular process that analysts use to value stocks is based on Price Earnings (PE) ratios, calculated by dividing the current market price of a stock by its earnings per share. PE ratios for stocks began the year above 20 for all three major equity indices and finished the year near 15. The lower the PE the less expensive stocks are relative to their earnings so a drop in PEs has made stocks more appealing to value seeking investors.

Global equity markets experienced widespread negative returns for 2018 with both developed and emerging market indices falling. Domestic equities faired better than international stocks for the year as earnings optimism and a strong dollar helped stabilized U.S. markets.

An increase in the use of options as a hedge against market volatility increased to roughly 20 million option contracts a day being traded, surpassing previous records according to data compiled by Options Clearing Corporation. Creative option strategies have evolved as increased stock volume accompanied by consistent volatility has become the norm. Computer as well as human initiated trades have also leant to staggering trading days resulting in wild market swings as traders cover open option contracts. (Sources: Options Clearing Corp., Bloomberg, Federal Reserve; https://fred.stlouisfed.org/series)


So what can investors expect in 2019?  We discussed the “melt-up” theory in our previous newsletters which basically means that bull markets generally go out with a bang and have a huge run-up before they finally die.  Given the large recent sell-off we wouldn’t be surprised to see a large market move up in the first half of 2019 and possibly break the old highs.  However, we say this with caution as there are many macro-economic and political factors that could easily damper any optimism in stocks.  We are also facing the massive debt bubble which could begin to unwind sooner than expected and send thing south quickly.  If you want to “gamble” that the melt-up cheerleaders are right do so with caution using tight stops and for more sophisticated investors options to hedge against massive losses.  If you are one of the lucky investors who purchased Netflix  in 2016 (or earlier) and your cost is below $100, it would be a wise investment to spend a small percentage of your gain to purchase puts to protect your downside (this applies to nearly every high-flying equity).  Investors should pay close attention to position size and make sure some of your big gainers are not so large as to totally destroy the gains you have made in your portfolio.  There are few feelings worse than watching your portfolio double or triple in a bull market only to see it cut in half when the inevitable bear market arrives.

 
Fixed Income Update - Interest Rates & Yield Curve

SHORT TERM RATES RISE – FED TIGHTENING

Shorter term bond yields rose closer to longer term bond yields, thus further flattening the Treasury bond yield curve, an economic gauge closely followed by market analysts. The benchmark 10-year Treasury Bond ended the year at 2.69%, down from a mid-year high of 3.24% it reached in November.
The Fed indicated that it would continue to shrink its balance sheet by $50 billion a month, a reversal from balance sheet expansion following the 2008-2009 financial crisis. What this means is that rather than buying government bonds in the marketplace and placing them on the Fed balance sheet, the Fed will instead forego holding additional bonds and allow bonds to mature without replacing them. This is a form of quantitative tightening as is raising short-term rates.
The Fed raised rates four times in 2018 and has risen rates nine times since it began tightening rates from near-zero three years ago. The Fed signaled that it expects to raise rates at least twice in 2019. Some analysts believe that the Fed has raised rates in order to be able to lower them as a form of stimulus should economic conditions deteriorate. (Sources: Treasury Dept., Federal Reserve)

THE YIELD CURVE

The yield curve has continued to flatten with the difference between 10-year and 2-year now sitting at 16bps.  Looking at the forward curve, the front-end of the curve is already inverted as 2’s to 5’s are now sitting at -8.6 basis points (meaning you can get more yield from a 2 year treasury than a 5 year treasury bond).  As we have discussed in many of our past newsletters (see archives on website) an inverted yield curve has historically been an accurate predictor of a recession.  This obviously has implications for stock investors.  Stock market investors would be wise to pay attention to the yield curve, especially the 10’s to 2’s curve. This chart shows the 5’s to 2’s yield curve and it is easy to see the rapid drop which has led to the inversion.  The yield curve is a forward predictor meaning that the inversion generally happens 6 months to 1 year before the economy turns and stocks take a major tumble.  Many argue that things might be different this time – we are in unchartered waters when it comes to central bank interference.  Can the Fed engineer a soft landing?  We suppose anything is possible but consider the sheer size of the Fed’s intervention and the massive amount of debt we would tend to believe this time may be much different than previous credit cycles (and not better).

 
Fixed Income Update - Decembers Liquidity Drain

Liquidity Dried Up In December

We have written about how bonds differ from stocks and have often pointed out about how when things get volatile liquidity in the bond market can quickly disappear.  In stocks when  you have more sellers than buyers the price of a stock drops until an equilibrium between buyers and sellers is found but even when stocks drops precipitously there is always a relatively tight bid/ask market with readily available quotes and market makers standing by ready to make a 2-sided market.  Because each bond issue is unique and has a limited quantity they tend to trade “by appointment” where a seller shows a bond to dealers and they take it to institutional managers they know purchase that type of bond and try to solicit a bid from the client which they then take to the seller who may decide to sell the bond at that price or counter the buyer at a different price.  When the markets are experiencing high volatility the buyers tend to step away and are not willing to show bids and you end up with a situation where there are many sellers and very few if any buyers.  At this point a bond becomes whatever someone is willing to pay at that particular moment which can be significantly lower than the bonds true value.  Smart investors tend to recognize this phenomenon and tend to keep cash available to take advantage of these situations by stepping in and showing low or “throw-away bids” and get incredible bargains on very solid bonds.  If a stock is falling dramatically in price it is usually because of a serious change in fundamentals (reporting lower than expected earnings).  This isn’t always the case with bonds, certainly corporate bonds may drop in price based on the earnings report or change in earnings outlook but there are many types of bonds outside the corporate sector that trade lower simply because the buyers are on the sidelines.  For instance, a AAA rated bond backed by a pool of auto loans isn’t affected by any fundamental changes in a corporation or probably not even by macro-economic factors related to the auto industry or expectations of higher losses in auto loans.  The fact that more borrowers may default on their auto loan would certainly affect a subordinated bond off of sub-prime collateral but would almost certainly have no affect on whether the AAA front-end bonds would be 100% money good – they simply have to much credit support and are too short to be affected by such changes in consumer behavior.

With the massive swings in volatility we saw in November and December the bond market created many such opportunities.  With year-end closing in and bond redemptions on the rise many managers were in a position where they were forced to raise money and sell some of their holdings.  Unfortunately they found few buyers willing to step up and pay normal market prices.  This cause the bid/ask spread to widen dramatically and astute buyers were able to purchase some of the highest quality securities at bargain basement prices.  As an example we will point to an actual bond that traded in December.  On December 6th we traded $140,000  WOLS 16-A B.  This is a AAA rated .4 year auto asset-backed security.  This type of bond would generally trade at a spread of about 30 basis points over the euro dollar curve (E curve) at a yield of 3.06% and price of $99.5 and was actually offered there on the day we did the trade.   A seller put the piece out for bid and because it was a volatile day the best bid the seller received was $98.625 which was a spread +280 to the E curve and a yield of 5.33%.  Since it is such a short bond it doesn’t take much of a dollar price move to affect the yield, in this case less than one point move the yield from 3.06% to 5.33% – that is a tremendous yield for a AAA rated bond that is less than 1 year long.  Within a few days, we traded the bond from our institutional client back to the street at $99-16, the annualized total return on the trade was over 15%!

While November and December were rough months, they were merely a bump in the road compared to what we believe could come in the next 2 years.  Astute bond investors would be wise to keep some money on the sidelines for when the real blood bath comes.  We believe the next credit crisis will result in once in a generation opportunities for fixed income investors.  Unfortunately, they will only be available to those on the inside or have an adviser (like AIS) that specializes in fixed income.


Fixed Income Update - Understanding Bond Risk

Understanding Bond Risk

We have been beating the drum for over a year on the risk in the markets and especially the credit risk in bonds.  So this month we thought we would present you with information on the types of risk in bonds that have the greatest effect on bond prices.

We are currently in one of the most difficult economic environments for fixed income investors seeking safe, dependable income. Historically low interest rates and tight credit spreads have sent many investors chasing yield by purchasing bonds with longer maturities and/or lower credit ratings to get the yield necessary to maintain their lifestyles. Many fixed income investors operate under the assumption that their bond holdings are safe and immune to large swings in price. While many things can affect the price of a bond, there are three specific types of risk that have the largest impact on bond prices that every bond investor should have at least a cursory understanding – Term Risk, Credit Risk, and Spread Risk. Understanding these concepts is crucial for an investor to determine how much risk they are taking and how they should allocate their fixed income investments.

Term Risk is measured using Duration and is an approximate measure of a bond’s (or bond portfolio, mutual fund, etc.) price sensitivity to changes in interest rates and measures the percentage price move for a 1% shift in interest rates. The longer a bonds maturity date, the higher the duration and price risk. It is important to note that bond prices have an inverse relationship to interest rates, as rates fall the price of a bond will go up and as rates rise the price will fall. For example, a 2-year bond has a duration of approximately 1.93 which means if rates rise 1% the price of the bond would fall by about 1.93%. By contrast, a 10-year bond has a duration of 8.5 meaning that the same 1% increase in interest rates would result in the price of the bond dropping by 8.5%.

Normally investors would be rewarded with higher yields for purchasing a bond or fund with a higher duration. If you are going to tie your money up for 8 additional years as in our example above, you would want to be rewarded for not just the time value but for the additional 6.5 in duration. However, today the yield curve (the difference between long-term and short-term treasury bonds) is historically flat with the 10-year treasury yielding 2.68% and the 2-year treasury yielding 2.52%. This means investors are being rewarded 16 basis points for investing 8-years longer and run the risk of their bond dropping an additional 6.5% in price over the shorter bond. To put this in perspective, the average difference (spread) for the last ten years between 2 and 10-year treasuries is 1.69% vs. the current 0.16% today. Clearly by historical standards investors are not being rewarded for owning longer-term maturity bonds.


NEXT PAGE: CREDIT RISK

 
Understanding Bond Risk

Understanding Bond Risk (Cont)

Credit risk is the risk of default by the issuer of a bond. The U.S. Treasury is considered the “risk-free” rate. As we discussed above the 10-year treasury bond is currently yielding 3.05% and is considered to have zero default risk and is rated AAA. Bond investors should understand the ratings system employed by the ratings agencies and most importantly that bonds rated below BBB are considered “junk” or high-yield (HY) and carry much higher risk of default than investment grade (IG). Risk averse investors should focus on higher rated securities and as we will see on the next page investors that are reaching for yield by purchasing lower rated securities are not being properly rewarded at todays tight spread levels.

The amount investors earn over the risk-free rate is referred to as the “spread”. The table below shows historical spreads for investment grade and high yield bonds for select dates since 2000. We chose data points that would illustrate various periods of changing volatility.

Date IG Spreads HY Spreads Difference
Jan 2000 122 487 365
Dec 2000 202 907 705
Oct 2002 246 1109 863
Feb 2005 81 293 212
Dec 2008 650 2182 1532
Jun 2014 107 336 229
Feb 2016 217 864 647
Sep 2018 115 324 209
Jan 2019 160 535 375


As you can see spreads can widen dramatically in a very short period. From January 2000 to December 2000 spreads on IG increased from 122 bps to 202 bps, an increase of 65%. During that same period HY spreads went from 487 bps to 907 bps, an increase of 86%. If we move forward to the present note how quickly HY spreads have moved in such a short period. High yield spreads have moved 211bps in four months from September 2018 to January 2019. That is the most dramatic move we have seen since the credit crisis and we have been warning for over a year in our newsletter that this was coming. Let’s examine what this means in dollar terms for investors holding HY bonds?


NEXT PAGE: BOND PRICE VOLATILITY

 
Fixed Income Update - Bond Price Volatility

Understanding Bond Risk

           Maturity Approx. % Px Change Dollar loss per $1mm
2yr 6% $60,000
5yr 9% $90,000
10yr 16% $160,000
30yr 31% $310,000

The table above shows the approximate price change for a bond (or portfolio of bonds) for various maturities for the recent spread widening of 211 bps. This table ties together two concepts we have discussed, duration (term risk) and credit spreads. Since longer bonds have a higher duration and are thus more price sensitive, a 211 bp move in spreads has a far greater effect on the price of the bonds. An investor in shorter maturity (2-year) HY bonds would suffer price decline of $60,000 vs. an investor in longer maturity HY bonds (30-year) would have a loss of over $300,000! However, the reality is far worse because 211bps is an average, longer bonds tend to widen more than shorter bond to reflect the additional term risk. So while a short HY bond may widen 150 bps on average a long bond could widen 300 bps or more making the loss even greater in the longer bond.

During times of high volatility IG bonds tend to perform far better than HY bonds – in other words they widen less resulting in a far smaller price decline. This is due to the fact that IG bonds have a much smaller chance of default so investors demand less risk premium.  While HY bonds widened 211 bps IG bonds only moved 45 bps over the same 4-month period. The table below shows the price move for IG bonds over the same period.

Maturity Approx. % Px Change Dollar Loss Per $1mm
2yr 1.25% $12,000
5yr 2.1% $21,200
10yr 3.8% $38,000
30yr 8% $80,000

It should be clear that investors in IG rated bonds are far better off during times of high volatility than HY investors. The 10yr HY investors’ loss was over FOUR times that of the IG investor. During times of volatility short maturity bonds with higher ratings will significantly outperform long maturity lower rated bonds. In the example above, if we assume the IG investor is earning an interest rate of 3% or better for 10-year maturity bonds the annual interest they earn is almost enough to offset the price decline of the spread widening ($30,000 in interest vs. $38,500 price decline). However, for the HY investor it isn’t even close. Looking at the spread table we see that in September HY investors were receiving 324 bps over the 10-year treasury, the 10-year treasury was approximately 3% in September meaning the HY investor was receiving a yield of about 6.25%. The $1 million HY portfolio would earn $62,500 in interest vs. the price decline of
$160,000 for a market decline of $100,000 when interest is included. That is the difference between opening your statement and seeing a market value of $991,500 on the $1 million IG portfolio vs. $900,000 on the same $1mm invested in a HY portfolio.

 
Summary

So where do credit spreads go from here and what should investors be doing to protect themselves?  Looking back at the historical spread table you can see that in September 2018 the spread difference between IG and HY bonds was at an all-time low of 209bps and has since moved to 375 bps. We repeatedly warned investors in our newsletter that this was coming and while this was a sharp move wider in a very short period it is likely a precursor of things to come. Remember, we are not even close to a recession yet as far as the economic growth numbers are concerned – as the forecast for recession become more imminent the spread widening will accelerate. As the table shows, during previous crisis periods and recessions HY spreads have reached as high as 2100 bps (21%) and it is not uncommon to see them at close to 1000 bps (10%). This means HY spreads have a lot of room to run should the economy begin to falter resulting in massive losses for HY investors. Our regular readers will know that we believe the coming credit crisis will be far worse than historical averages due simply to the massive amount of HY and low IG rated debt (see our articles on the debt bubble).

For over a year we have pounded the table that investors should avoid risk and keep maturities shorter than usual and look for bonds that are heavy in monthly cash-flow.  Clearly this strategy has paid off for our clients as our managed accounts significantly outperformed the Barclays Global Bond Index in 2018 as well as all of the largest bond mutual funds (and all stock indexes for that matter).  While the bond index delivered flat returns in 2018 our clients had total returns of over 4% and did so with less than 1/2 of the duration risk of the index and experienced very little price volatility in their portfolios – our average account saw small gains every single month and only 1 managed account saw a down month which was only 1/4 of 1% after fees.

o summarize, fixed income investors who are taking excessive duration and credit risk have been receiving one of the lowest risk premiums in history and the current widening is likely just the beginning. We clearly illustrated that investors with a low risk tolerance should steer clear of HY bonds and current investors should look to shorten duration and shore up credit quality. The recent liquidity drain has presented opportunities for income investors to get yields of 5%+ on short duration high quality bonds and so far, this has been a great place to hide out and weather the storm. Any extra yield to be gained
by purchasing long maturity HY bonds is likely to come at considerable pain in the very near future.

The lesson is don’t be shortsighted and fall into the yield chasing trap and set your portfolio up for massive success down the road – having short maturity bonds will give you money to put to work if/when the next crisis comes. In the meantime you can earn a decent return while you wait utilizing short duration
high quality bonds.