December 2018 Market Update
Market Update
(all values as of 04.30.2024)

Stock Indices:

Dow Jones 37,815
S&P 500 5,035
Nasdaq 15,657

Bond Sector Yields:

2 Yr Treasury 5.04%
10 Yr Treasury 4.69%
10 Yr Municipal 2.80%
High Yield 7.99%

YTD Market Returns:

Dow Jones 0.34%
S&P 500 5.57%
Nasdaq 4.31%
MSCI-EAFE 1.98%
MSCI-Europe 2.05%
MSCI-Pacific 1.82%
MSCI-Emg Mkt 2.17%
 
US Agg Bond 0.50%
US Corp Bond 0.56%
US Gov’t Bond 0.48%

Commodity Prices:

Gold 2,297
Silver 26.58
Oil (WTI) 81.13

Currencies:

Dollar / Euro 1.07
Dollar / Pound 1.25
Yen / Dollar 156.66
Canadian /Dollar 0.79
 

Macro Overview

Weariness among investors escalated towards the end of 2018 as uncertainty surrounding trade, the Federal Reserve, a government shutdown, and global economic growth lingered into the new year.

Even during the turbulent year of 2018, the U.S. economy continues its resilience into 2019, with unemployment at its lowest level in 49 years, wage growth reaching levels not seen since 2009 and consumer spending and industrial production remaining strong. A tight labor market along with moderate inflation has maintained an accommodating environment for consumers.

The year-end climate heading into 2019 became more challenging as equity markets reacted negatively to another rate hike in December along with two more expected hikes in 2019. Ironically, the market views the Fed hikes as a validation by the Fed that U.S. economic activity is healthy enough to endure further rate increases. 

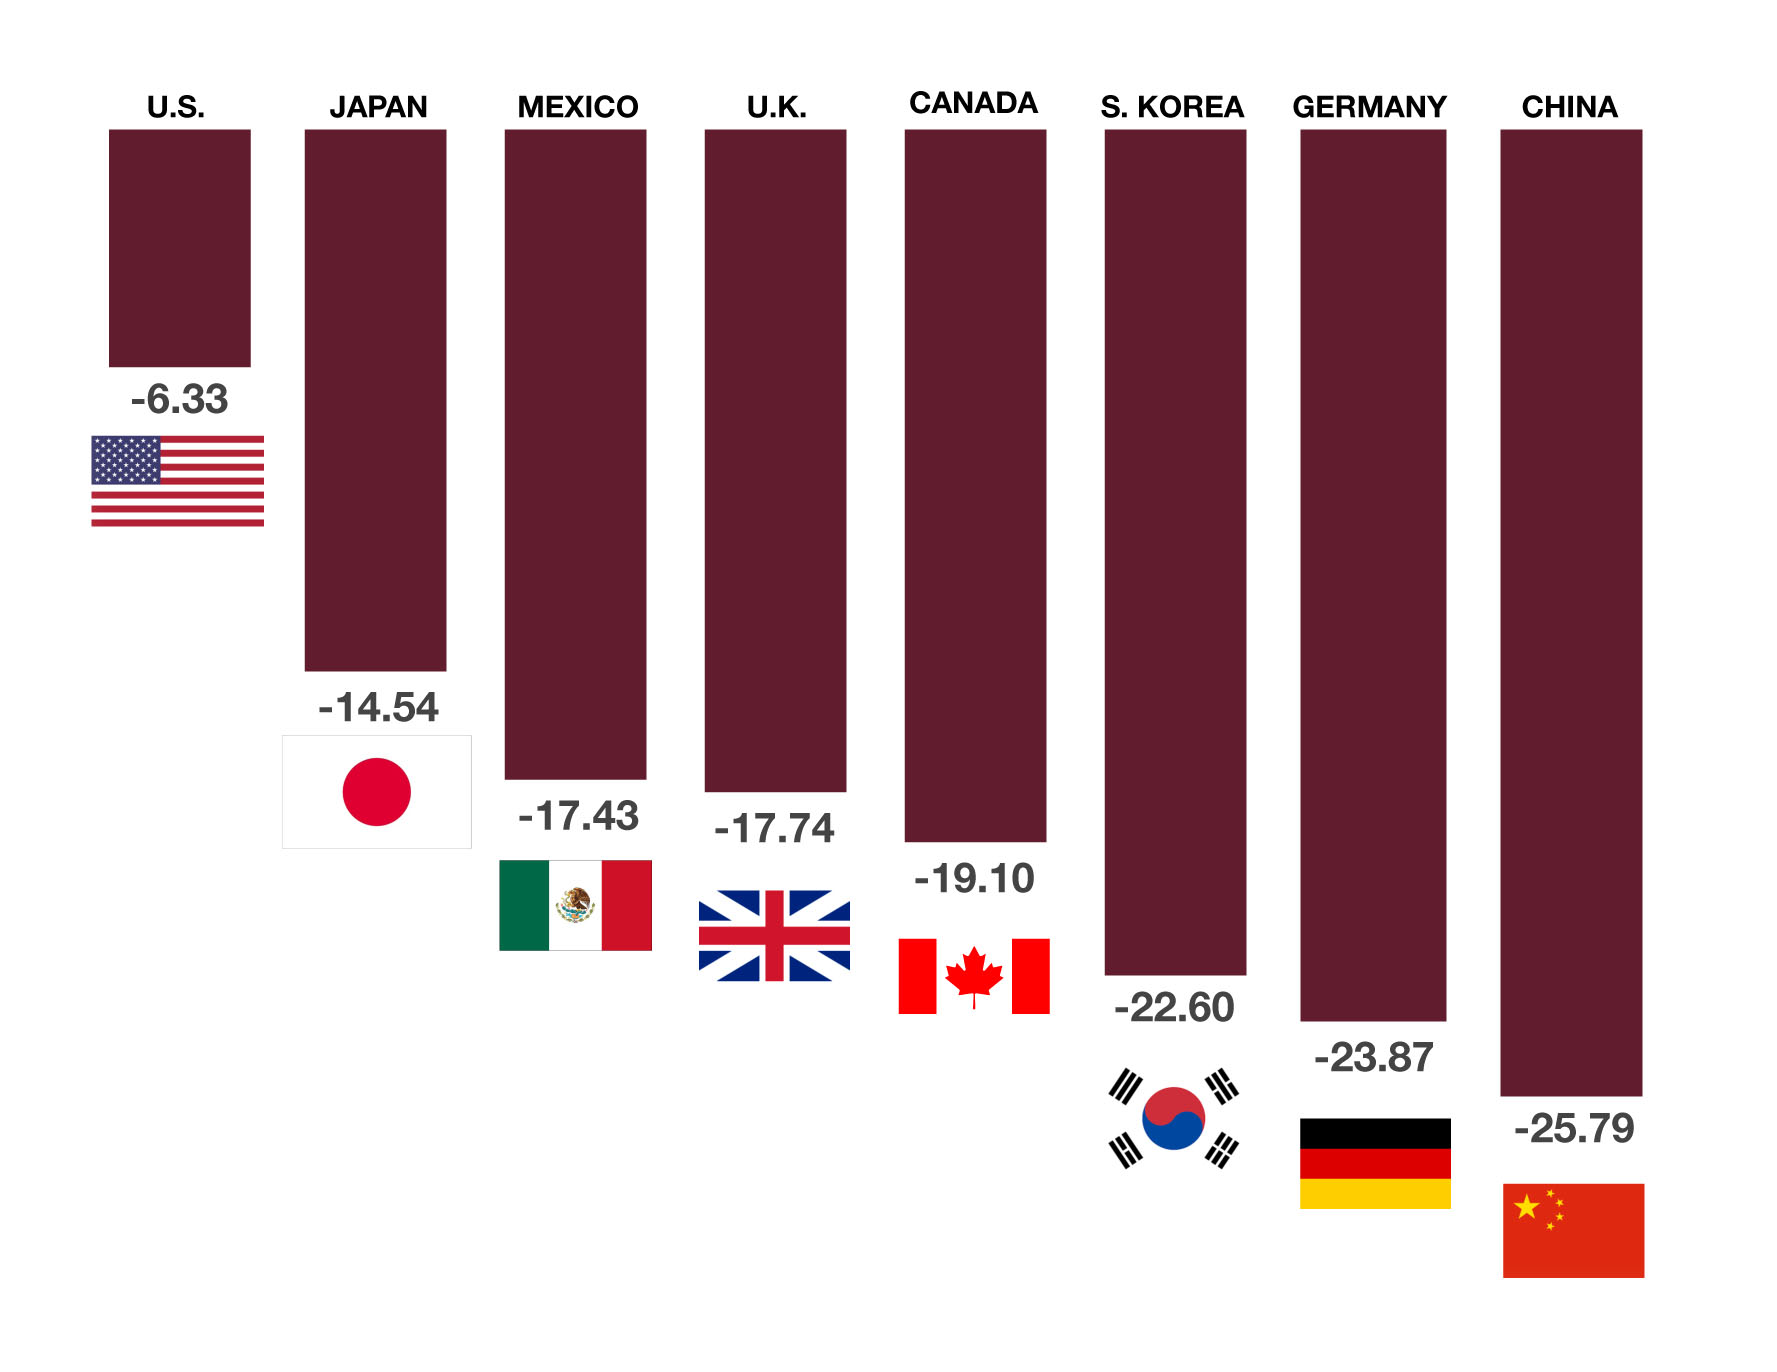
Global equity markets ended 2018 in negative territory with nearly every major index in both developed and emerging markets falling. China’s stock market was among the worst performer internationally as trade tensions took a toll on Chinese manufacturers and exporters. U.S. stock markets experienced volatility that had not occurred in several years resulting in a pullback for all major domestic equity indices in 2018.

Ongoing trade disputes and the imposition of new tariffs negatively influenced the markets and economic projections throughout year. Relations with China were forefront as the administration negotiated trade terms intended to better protect U.S. intellectual property and disparate tariffs.

Growing U.S. oil production and an increase in supplies led to a drop of U.S. oil prices by 25% in 2018. The benchmark for U.S. oil, West Texas Intermediate (WTI), fell from $60 per barrel in the beginning of the year to $45 per barrel by year-end, simultaneously reducing the price of gasoline nationwide.

According to the Federal Reserve Bank of New York, the likelihood of a recession remains relatively low with less than a 15% probability one will occur in the next year. The Fed has historically seen greater than 30% probabilities before each of the last seven recessions since 1970.  (Sources: Federal Reserve Bank of New York, Treasury, Labor Dept., Bloomberg)


The Fed raised rates four times in 2018

Global Equity Markets Decline In 2018 – Equity Review

Volatility throughout the trading year kept stock valuations tough to determine. A popular process that analysts use to value stocks is based on Price Earnings (PE) ratios, calculated by dividing the current market price of a stock by its earnings per share. PE ratios for stocks began the year above 20 for all three major equity indices and finished the year near 15. The lower the PE the less expensive stocks are relative to their earnings so a drop in PEs has made stocks more appealing to value seeking investors.

Global equity markets experienced widespread negative returns for 2018 with both developed and emerging market indices falling. Domestic equities faired better than international stocks for the year as earnings optimism and a strong dollar helped stabilized U.S. markets.

An increase in the use of options as a hedge against market volatility increased to roughly 20 million option contracts a day being traded, surpassing previous records according to data compiled by Options Clearing Corporation. Creative option strategies have evolved as increased stock volume accompanied by consistent volatility has become the norm. Computer as well as human initiated trades have also leant to staggering trading days resulting in wild market swings as traders cover open option contracts. (Sources: Options Clearing Corp., Bloomberg, Federal Reserve; https://fred.stlouisfed.org/series)

Short Term Bond Rates Rise – Fixed Income Review

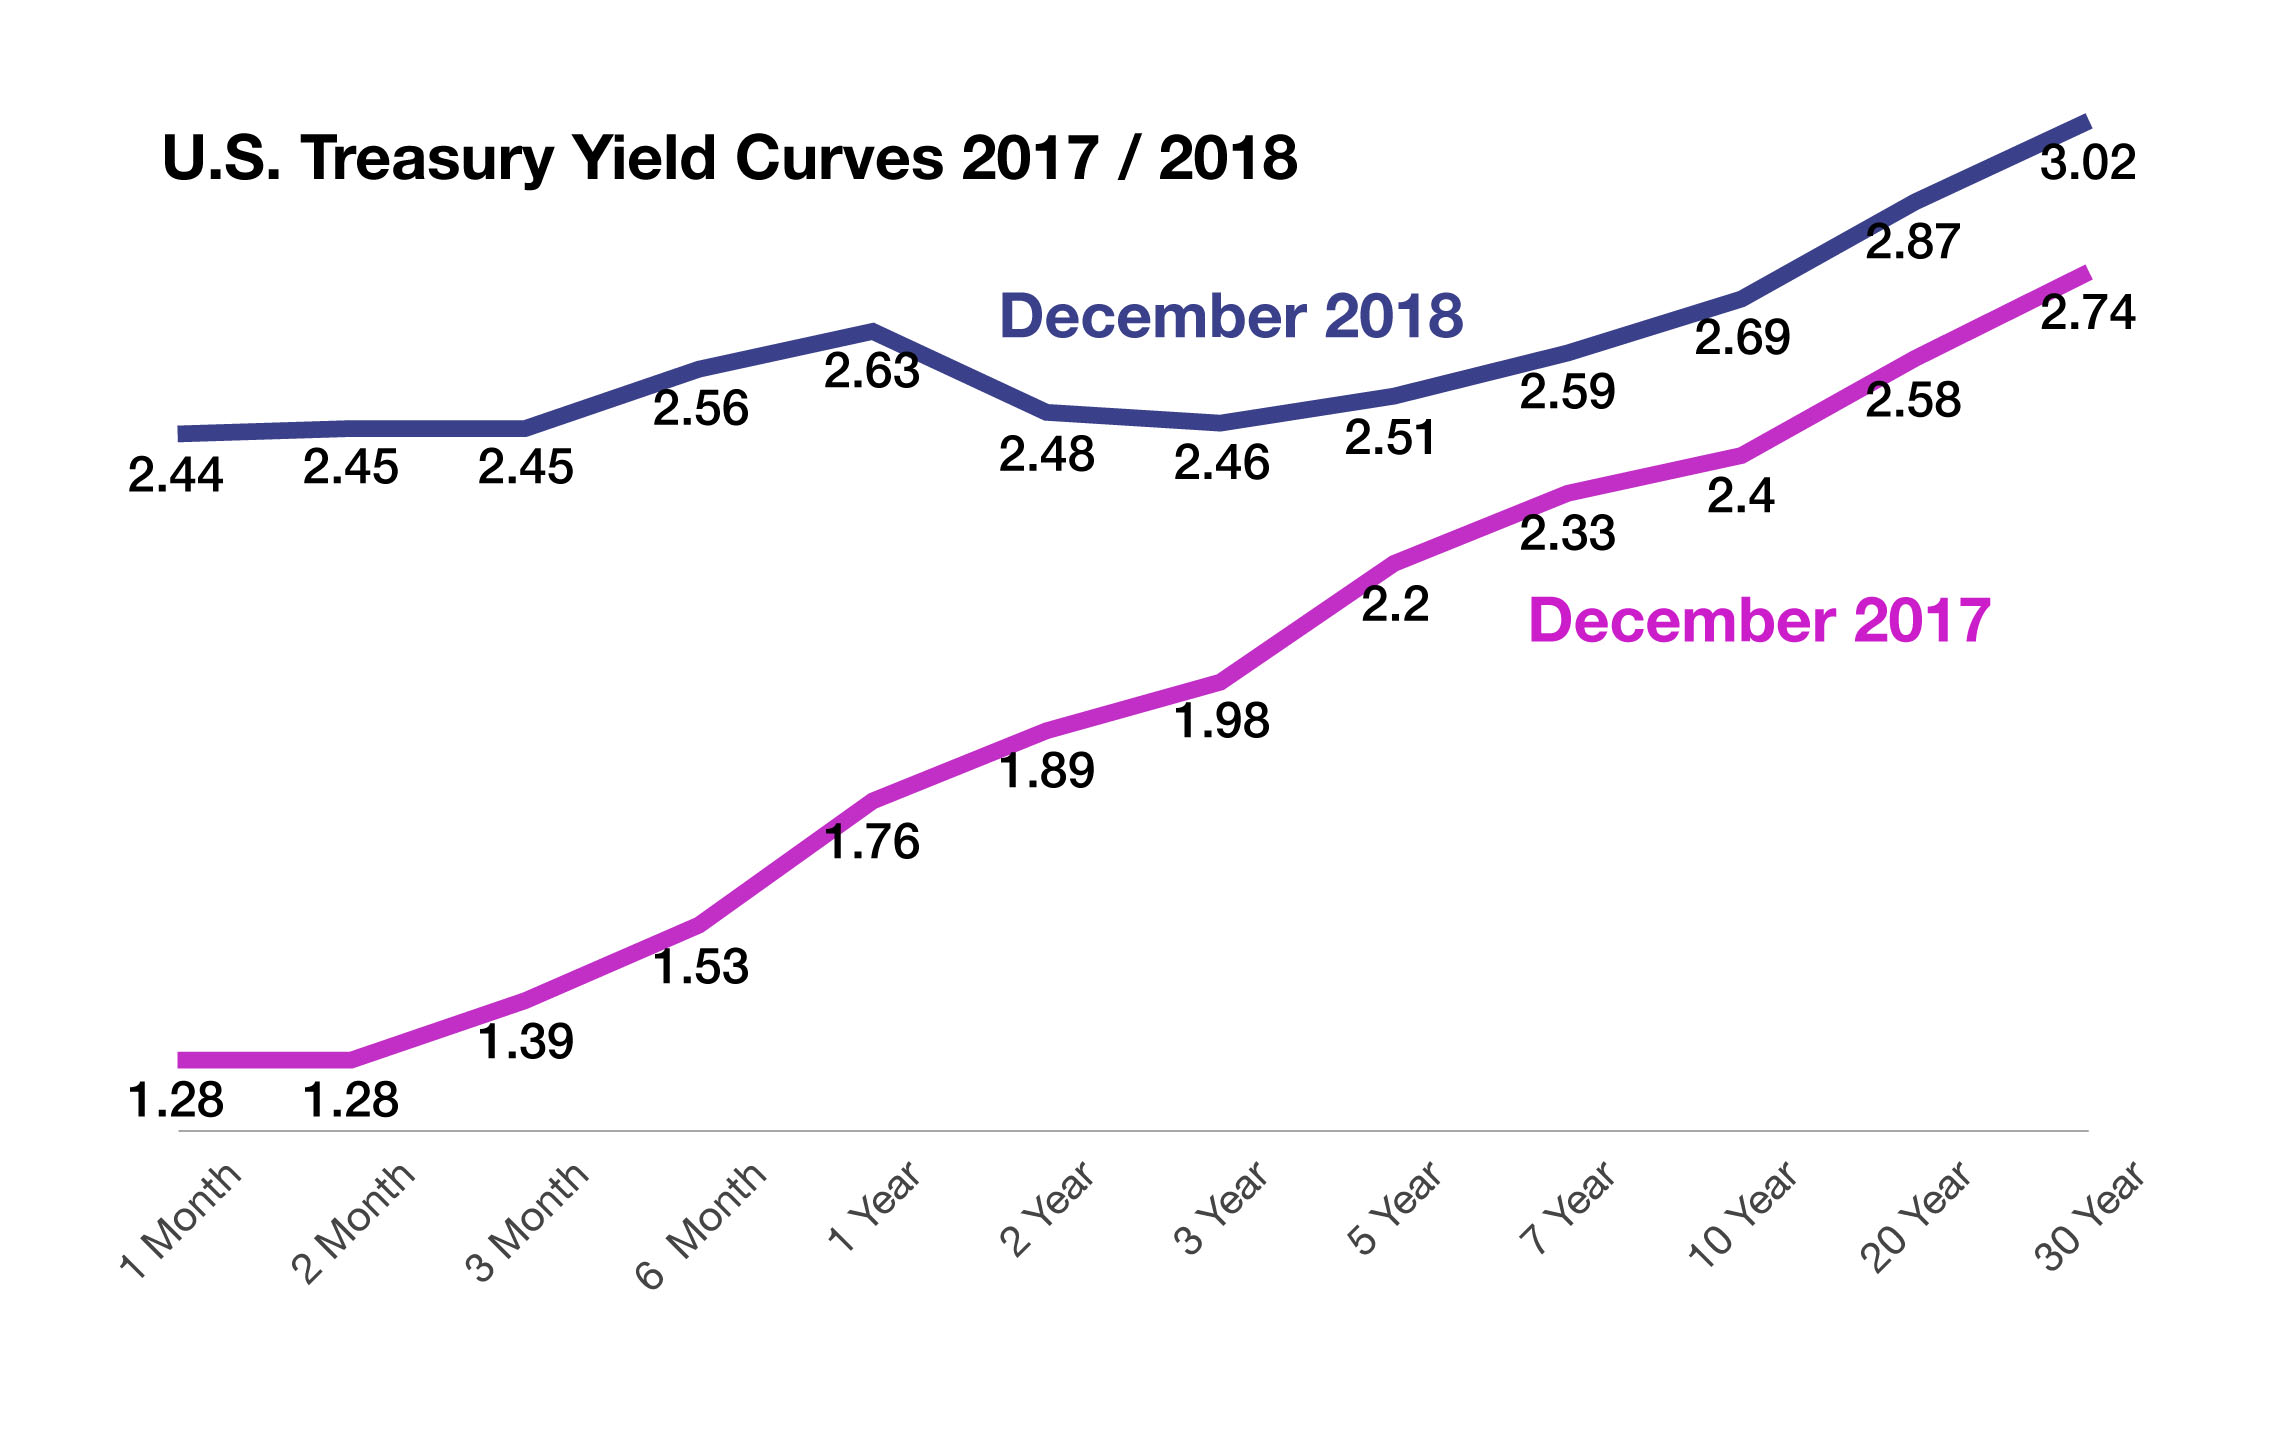
Shorter term bond yields rose closer to longer term bond yields, thus further flattening the Treasury bond yield curve, an economic gauge closely followed by market analysts. The benchmark 10-year Treasury Bond ended the year at 2.69%, down from a mid-year high of 3.24% it reached in November.

The Fed indicated that it would continue to shrink its balance sheet by $50 billion a month, a reversal from balance sheet expansion following the 2008-2009 financial crisis. What this means is that rather than buying government bonds in the marketplace and placing them on the Fed balance sheet, the Fed will instead forego holding additional bonds and allow bonds to mature without replacing them. This is a form of quantitative tightening as is raising short-term rates. 

The Fed raised rates four times in 2018 and has risen rates nine times since it began tightening rates from near-zero three years ago. The Fed signaled that it expects to raise rates at least twice in 2019. Some analysts believe that the Fed has raised rates in order to be able to lower them as a form of stimulus should economic conditions deteriorate. (Sources: Treasury Dept., Federal Reserve)

 
U.S. became a net oil exporter in 2018

The Common Occurrence Of Federal Government Shutdowns – Fiscal Policy

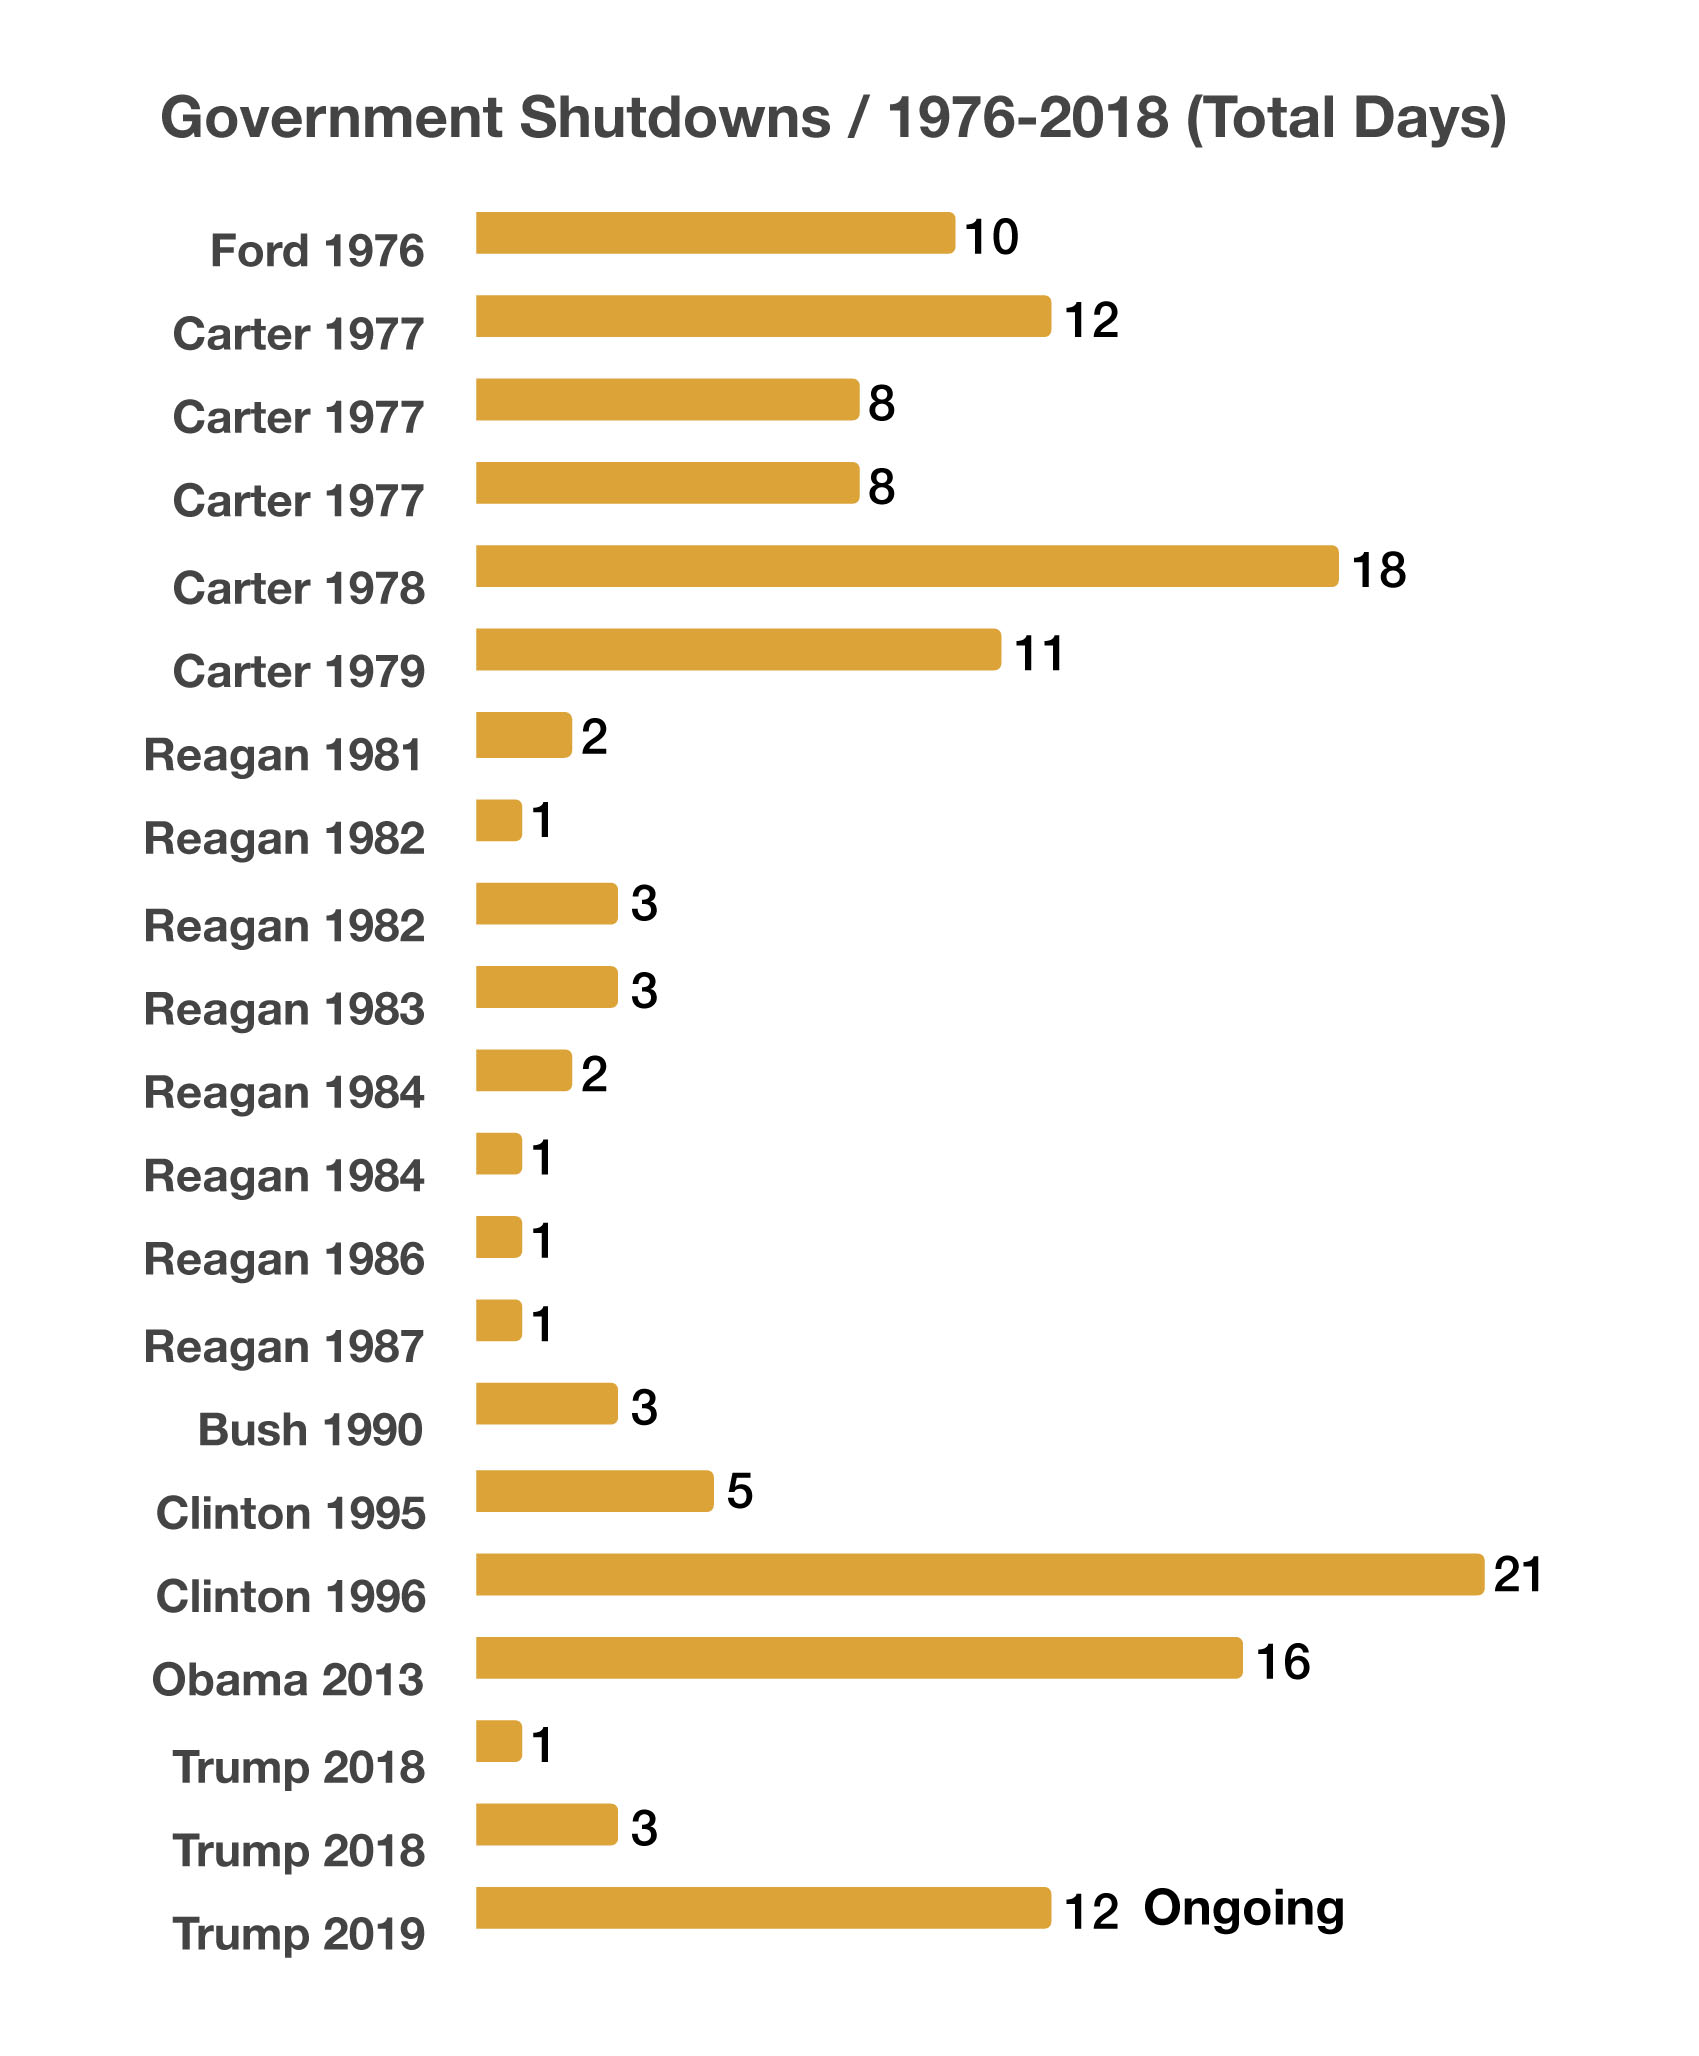
Government shutdowns have been a common occurrence over the years under most every president. The length of the shutdowns have varied from 2 days in 1981 under President Reagan to 21 days in 1996 under President Clinton. A shutdown occurs when Congress fails to pass or the President refuses to sign legislation funding federal government operations and agencies.

Estimated costs of the most recent government shutdown are still unknown, with lost wages, exports, and government services essential to the operation of private sector businesses being affected. How much the shutdown may have weighed on the economy may not be known until later in the year.

Government shutdowns entail partial closure of certain agencies and departments, not complete closures. Departments affected during the most recent shut down include Homeland Security, Housing & Urban Development, Commerce, FCC, Coast Guard, FEMA, Interior, Transportation, and the Executive Office of the President. 

Federal employees deemed as “essential” among the various departments are required to work without pay until a funding bill is passed by Congress. The closures affect numerous private businesses that rely and adhere to regulatory rules imposed by the Federal government, such as mortgage loans and Housing & Urban Development. (Sources: Congressional Records, https://www.congress.gov/congressional-record/2018/12/22)

U.S. Became Net Oil Exporter In 2018 – Oil Industry Overview

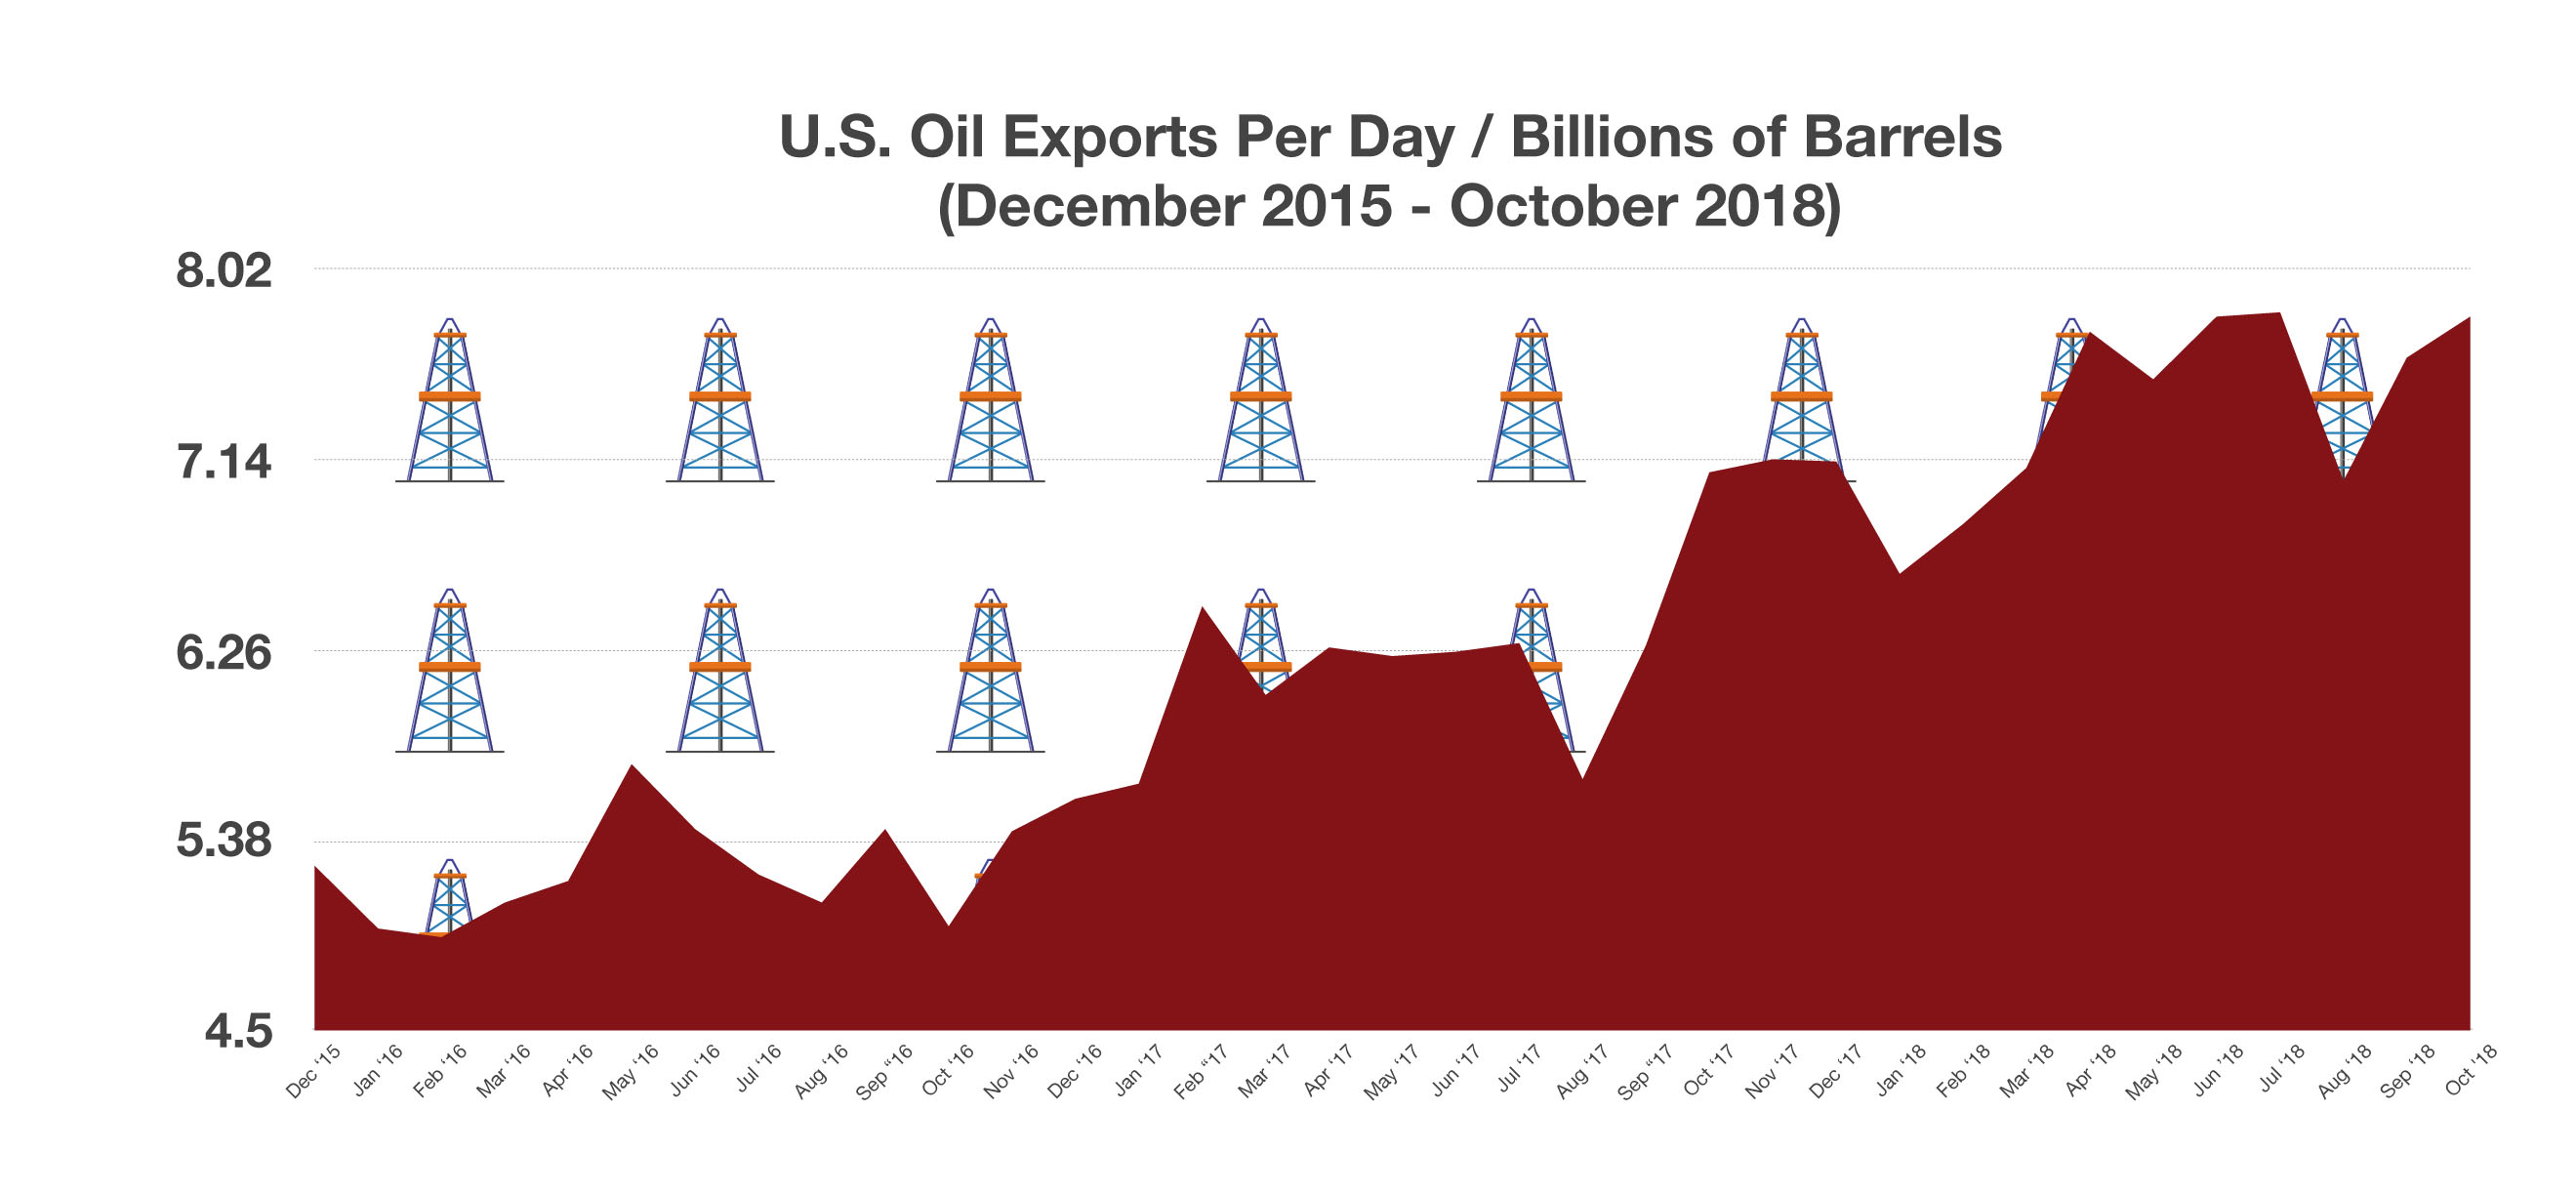
December marked the first time ever that the U.S. exported more crude oil and fuel than it imported, a result of ambitious U.S. production and the lifting of a decades old ban on U.S. oil exports in December 2015. With the U.S. now able to export its own oil production, both as refined and crude, it has increased stockpiling capabilities. Partially because of over supply, Congress agreed to remove the 40-year old ban on oil exports, thus allowing the U.S. to export some of its excess supplies. The onslaught of fracking and technological advances in drilling has led to increased U.S. production and supply growth. Saudi Arabia’s attempts to destabilize U.S. drillers with increased production and lower oil prices has essentially backfired. (Sources: IEA, U.S. Dept. of  Energy, EIA.gov)
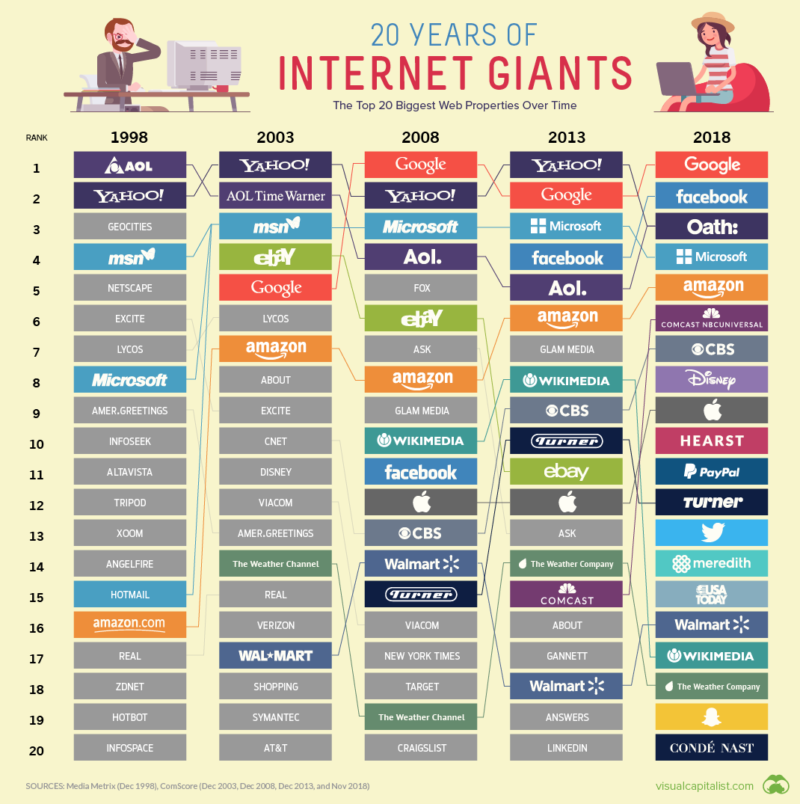


20 Years of Internet Giants

With each passing year, an increasingly large segment of the population no longer remembers images loading a single pixel row at a time, the earsplitting sound of a 56k modem, or the domination of web portals.

Many of the top websites in 1998 were basically news aggregators or search portals, which are easy concepts to understand. Today, brand touch-points are often spread out between devices (e.g. mobile apps vs. desktop site) and a myriad of services and sub-brands (e.g. Facebook’s constellation of apps). As a result, the world’s biggest websites are complex, interconnected web properties.   (Source:  Visual Capitalist)